Expansion and Age of the Supernova Remnant G350.10.3: High-Velocity Iron Ejecta from a Core-Collapse Event
Abstract
We report Chandra observations of the highly asymmetric core-collapse supernova remnant G350.10.3. We document expansion over 9 yr away from the roughly stationary central compact object, with sky-plane velocities up to km s-1 ( is the distance in units of 4.5 kpc), redshifts ranging from km s-1 to 2600 km s-1, and three-dimensional space velocities approaching 6000 km s-1. Most of the bright emission comes from heavy-element ejecta particularly strong in iron. Iron-enhanced ejecta are seen at 4000–6000 km s-1, strongly suggesting that the supernova was not a common Type IIP event. While some fainter regions have roughly solar abundances, we cannot identify clear blast-wave features. Our expansion proper motions indicate that G350.10.3 is no more than about 600 yr old, independent of distance: the third youngest known core-collapse supernova in the Galaxy, and one of the most asymmetric.
Astrophysical Journal Letters
1 Introduction
Young core-collapse supernova remnants (CC SNRs) can provide essential information on the progenitors, immediate environments, and explosion mechanisms of massive stars. However, young CC SNRs are surprisingly scarce in the Galaxy. From the past millennium we know of four very disparate objects: Cas A, age yr (e.g., Thorstensen et al., 2001); Kes 75 (G29.7), yr (Reynolds et al., 2018); the Crab Nebula, 966 yr; and G330.2, yr (Borkowski et al., 2018). Only Cas A has the appearance one might expect of a somewhat spherical explosion in a somewhat uniform ambient medium. Kes 75 shows only half a shell morphology, and the Crab none, and G330.2+1.0 has an extremely faint, asymmetric shell. Either the explosions themselves or their immediate surroundings, or both, are highly irregular.
Evidence continues to accumulate for the intrinsic asymmetry of the CC events themselves. Asymmetries formed in the first few hundred milliseconds can persist to ages of years (e.g., Wongwathanarat et al., 2017; Gabler et al., 2020; Orlando et al., 2020). Remnants interact with their surroundings as well, giving clues to the immediate pre-explosion environment. One indicator of explosion asymmetry is the evidence in a few SNe and SNRs of overturn in the ejecta, that is, of high-velocity iron-group elements (IGEs) in SNe, or of their presence at large radii in SNRs. A well-known example of the former is SN 1987A, where detection of prompt gamma-rays as well as direct measure of Fe line profiles demanded the mixing of IGEs to 3000 km s-1 (e.g., McCray & Fransson, 2016). In SN 1993J, modeling of the nebular spectrum implied the mixing of Fe out to at least 3000 km s-1(Houck & Fransson, 1996). Several other supernovae have shown evidence for Fe at velocities between 6500 and 8400 km s-1 (Utrobin & Chugai, 2019, and references therein). High IGE velocities are also found in Cas A, up to 4500 km s-1 (DeLaney et al., 2010). It is not known how widespread this phenomenon is among CC SNRs; its demonstration in more cases will provide both a spur and a constraint to modelers.
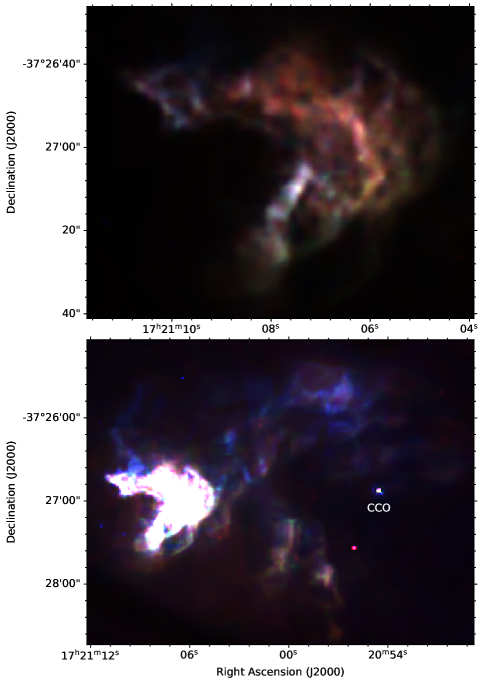
Here we confirm a fifth member to add to the list of CC SNe of the past millennium: G350.10.3, by far the most asymmetric of all (Figure 1). Discovered in radio (Salter et al., 1986), its identification as a single SNR had to wait for X-ray observations (Gaensler et al., 2008), which also identified a nearby point X-ray source, XMMU J172054.5-372652, and argued for its association with the remnant, though pulsations were not detected. This point source is thus presumed to be a compact central object (CCO) as seen in several other young SNRs. Those and subsequent observations (Lovchinsky et al., 2011) led to an age estimate of 600–1200 yr, based on simple spectral models. Spectra showed strong overabundances of Mg, Si, S, Ar, Ca, and Fe; emission appeared to be dominated by SN ejecta in all areas. The distance is still uncertain; Gaensler et al. (2008) quote 4.5 kpc based on an inferred high preshock density of 25 cm-3 and therefore an association with a nearby molecular cloud at that distance, while Yasumi et al. (2014) used Suzaku observations and different methods to obtain kpc. We shall quote results in terms of , the distance in units of 4.5 kpc. Yasumi et al. (2014) reported a significant anomaly in their analysis of the spatially integrated spectrum of G350.10.3: an overabundance of stable nickel relative to iron: Ni/Fe times the solar value (mass ratio of ). The combination of a dramatically asymmetric morphology and this nickel excess makes G350.10.3 a particularly interesting object for detailed study.
2 Chandra Observations
G350.10.3 was observed in 2009 May (PI: P. Slane), and we observed it in five segments in 2018 July for a total of 189 ks. The mean separation of the two epochs is 9.126 yr. In all observations, G350.10.3 was placed on the Advanced CCD Imaging Spectrometer (ACIS) S3 chip, with Very Faint mode used to reduce the particle background everywhere except for the bright east region where Faint mode was employed.
We aligned individual 2018 pointings using the CCO, while the inter-epoch alignment was done by matching the positions of seven point sources near the Chandra optical axis. We jointly fit them with 2D Gaussians to obtain best estimates of image shifts between epochs, with statistical errors in alignment not exceeding ACIS pixels in R.A. and decl. (the ACIS pixel size is ). These errors translate into proper motion (PM) errors in R.A. and decl. not exceeding 5 mas yr-1. We find a modest (0.27 ACIS pixels) apparent displacement of the CCO toward the north–northwest, which might be due to a PM with mas yr-1 and mas yr-1 ( km s-1). Both the magnitude and direction of the CCO motion are quite uncertain due to the large PM errors.
After alignment, we extracted images and spectra from event files. The individual 2018 event files were merged together prior to image extraction, but spectra were extracted separately from each individual event file. We then summed them together and averaged their spectral and ancillary responses by weighting them by individual exposure times.
The combined 2018 image is shown in Figure 1, where red corresponds to 0.5–1.6 keV, green to 1.6–2.6 keV, and blue to 2.6–7 keV. Substantial spectral variations are apparent and will be discussed below.

3 Expansion
Expansion between 2009 and 2018 is apparent by eye over most of the remnant. See Figure 2, which compares the 2009 (left) and 2018 (right) images of the bright E region in the top two rows, and displays insets from the 2009 image on a 2018 image in the bottom. We measured expansion in the discrete regions (labeled in Figure 2) using the same maximum-likelihood method we used for RCW 89 (Borkowski et al., 2020); we smoothed the 2018 0.5–7 keV image to use as a model, and fit the unsmoothed 2009 0.5–7 keV data to it, calculating shifts, and errors, in two directions. This method sufficed for the bright regions A–G; in fainter ones we used a Markov chain Monte Carlo (MCMC) method for the fitting, as described in Borkowski et al. (2018). But for the faintest knot K, we fit a 2D Gaussian (+ constant background) to unsmoothed data at both epochs, then calculated shifts between Gaussian peaks and converted them into PMs.
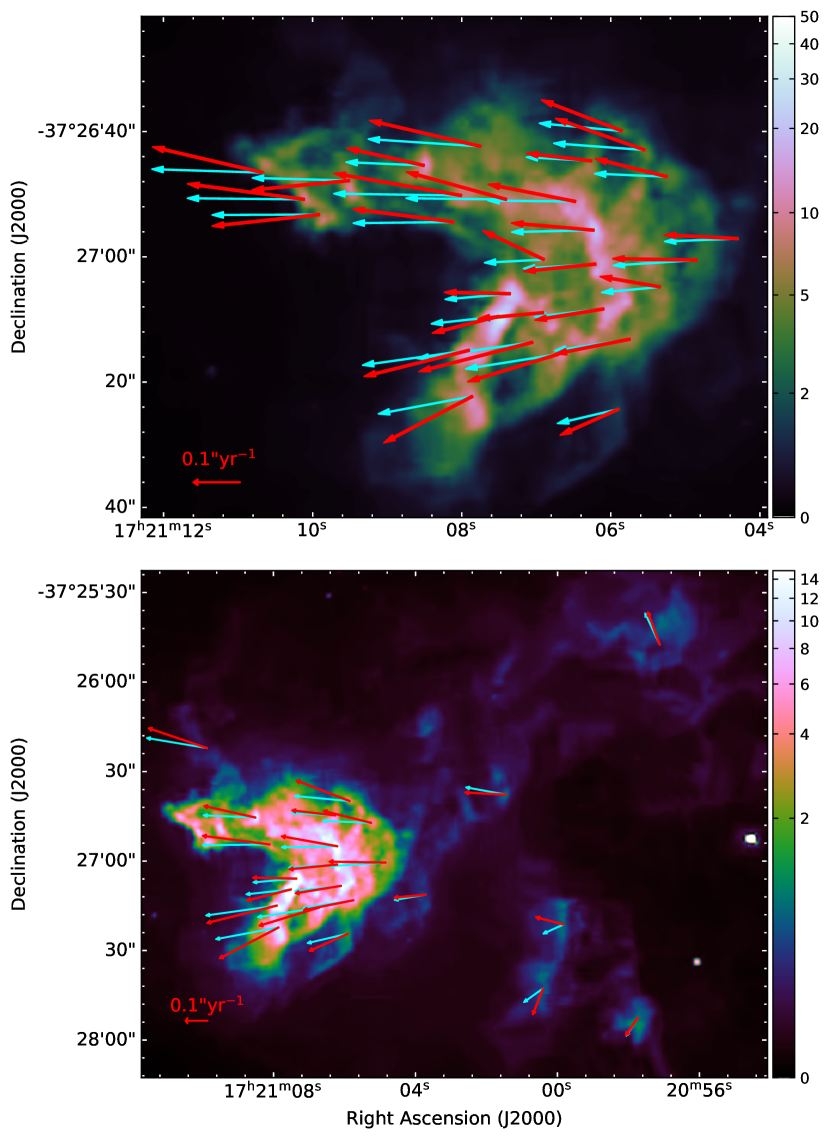
Table 1 gives our measured PMs (arcsec yr-1) in R.A. and decl., with errors (in mas, in parentheses). We also report radial (away from the CCO) and tangential motions. They are shown in Figure 3, where cyan arrows show the radial component of PM, while red arrows show the total. Some substantially nonradial motions are apparent. Table 1 also gives expansion ages (distances to the CCO divided by radial PMs).
| Region | aaR.A. PM. | bbDecl. PM. | ccRadial PM (away from the CCO). | ddTangential PM, negative (positive) for clockwise (counterclockwise) motion. | eeVelocities assume a distance of 4.5 kpc. | eeVelocities assume a distance of 4.5 kpc. | Expansion | ffFree expansion age (distance over ). | ggRelative deceleration , where the age is assumed to be 600 yr, the actual upper limit. So values are relative to region B3, the region with the shortest expansion age. | |
|---|---|---|---|---|---|---|---|---|---|---|
| () | ( yr-1) | ( yr-1) | ( yr-1) | ( yr-1) | (km s-1) | (km s-1) | (% yr-1) | (yr) | ||
| A1 | 192 | 810 | 0.74 | |||||||
| A2 | 185 | 740 | 0.81 | |||||||
| A3 | 183 | 800 | 0.75 | |||||||
| A4 | 178 | 860 | 0.70 | |||||||
| B1 | 166 | 1000 | 0.60 | |||||||
| B2 | 163 | 760 | 0.79 | |||||||
| B3 | 160 | 590 | 1.02 | |||||||
| B4 | 157 | 660 | 0.91 | |||||||
| B5 | 153 | 720 | 0.84 | |||||||
| B6 | 147 | 1160 | 0.52 | |||||||
| C1 | 153 | 1100 | 0.55 | |||||||
| C2 | 155 | 1070 | 0.56 | |||||||
| C3 | 160 | 700 | 0.86 | |||||||
| C4 | 161 | 790 | 0.76 | |||||||
| D1 | 148 | 1060 | 0.57 | |||||||
| D2 | 150 | 600 | 0.99 | |||||||
| E1 | 142 | 760 | 0.79 | |||||||
| E2 | 139 | 790 | 0.76 | |||||||
| E3 | 139 | 900 | 0.67 | |||||||
| E4 | 138 | 930 | 0.64 | |||||||
| E5 | 146 | 730 | 0.82 | |||||||
| F1 | 140 | 1000 | 0.60 | |||||||
| F2 | 134 | 890 | 0.67 | |||||||
| F3 | 128 | 1060 | 0.57 | |||||||
| F4 | 135 | 830 | 0.72 | |||||||
| G1 | 135 | 760 | 0.79 | |||||||
| G2 | 131 | 670 | 0.89 | |||||||
| G3 | 127 | 820 | 0.73 | |||||||
| G4 | 120 | 820 | 0.73 | |||||||
| H1 | 185 | 0.032 | 950 | 0.63 | ||||||
| H2 | 116 | 0.014 | 740 | 0.81 | ||||||
| H3 | 111 | 1090 | 0.55 | |||||||
| H4 | 139 | 1040 | 0.58 | |||||||
| K | 83 | 640 | 0.94 | |||||||
| NNE | 72 | 650 | 0.92 | |||||||
| SE1 | 69 | 970 | 0.62 | |||||||
| SE2 | 86 | 1140 | 0.53 | |||||||
| SSE | 71 | 1010 | 0.59 |
Note. — PM errors (in parentheses) are in milliarcsec yr-1.
Figure 3 and Table 1 present the basic results of our investigation. The expansion away from the CCO is dramatic and obvious. The highest velocities occur at the eastern edge, above the indentation, where motions appear to diverge around an unseen obstacle. Fainter regions to the southeast have markedly nonradial motions as well. Considerable variations in speed can be seen within the bright eastern area (top panel of Figure 3).
The remnant is of course younger than the shortest expansion age we find in Table 1, about 600 yr, independent of distance. We conclude that G350.10.3 is one of the three youngest known CC SNRs in the Galaxy, no more than twice the age of Cas A, and comparable to the age of Kes 75. We assume a nominal age of 600 yr for estimates below.
Table 1 also includes relative decelerations , that is, ratios of the nominal 600 yr age to the expansion ages. Since the true age may be less than 600 yr, the decelerations are upper limits. A wide range is apparent.
4 Spectroscopy
We examined spectra of several small regions that stood out kinematically. The most rapid expansion is found in regions A1–A3, with an average radial velocity (away from the neutron star) of about km s-1. Substantial deceleration is apparent in regions C1 and C2, which expand at about km s-1. The bright filament slightly further west (within regions E1–E4) expands slightly faster (about (–) km s-1), but has contrasting spectral properties. A much fainter region well separated from the bright eastern area is region NNE, expanding at only about km s-1 (but relatively undecelerated, i.e., high ).
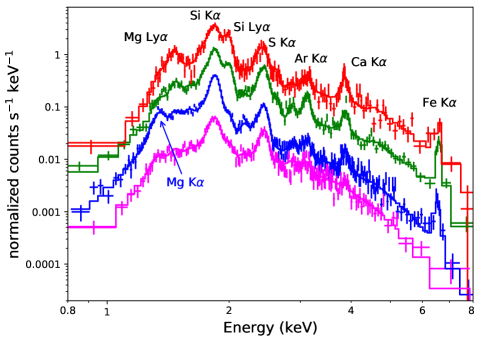
The spectra are shown in Figure 4. We fit them with plane-shock models with absorption that are available in Xspec (Arnaud, 1996), using the abundance set from Grevesse & Sauval (1998). For fainter regions A1–A3 and NNE, backgrounds were modeled rather than subtracted, allowing the use of C-statistics (Cash, 1979). Region NNE is well described by a plasma with subsolar () abundances (with solar heavy-element abundance ratios assumed), with temperature keV, ionization age cm-3 s, a redshift of km s-1, and hydrogen column cm-2 (errors are 90% confidence intervals). We conclude that it is dominated by shocked circumstellar or interstellar material (CSM/ISM); the apparently subsolar abundances may simply indicate that an additional continuum component, perhaps nonthermal, is also present, in addition to that due to H and He. The other three regions all require extremely oversolar abundances, suggesting that both lines and continua originate in heavy-element ejecta. Since O and heavier elements are primary nucleosynthetic products of CC SNe, we set abundances of elements lighter than O to zero, and fit for abundances of Mg, Al, Si, S, Ar, Ca, and Fe (with the relative IGE abundances fixed to solar ratios, and with Ne and odd- elements other than Al set to solar values). There is Fe present in all three spectra, with (regions A1–A3), (C1 and C2), and (region E). For Si and S, the intermediate-mass elements with the most prominent lines, , , , and , , and , respectively. Progressing from east to west, those three spectra show systematically decreasing temperature from keV, through keV to keV, and also decreasing from cm-3 s, through cm-3 s to cm-3 s. We find considerable line broadening and Doppler shifts for all three regions: all are redshifted, with A1–A3 moving away at km s-1. With our measured PM, we obtain a space velocity of 5800 km s-1 at an angle of 27∘ with the plane of the sky. The other two regions in the bright area also show recession speeds, with C1 and C2 at km s-1, and region set E at km s-1. Regions A1–A3 show the most extreme broadening, with () line widths of km s-1.
5 Results and Discussion
Here we summarize our results.
-
1.
We observe radial expansion away from the compact central object (CCO) in all directions in G350.10.3, at speeds ranging up to km s-1. The remnant age is less than the shortest expansion time we measure, about 600 years. We conclude that G350.10.3 is the remnant of one of the three most recent known core-collapse supernovae in the Galaxy.
-
2.
The CCO might be moving in the NNW direction with km s-1, a rather typical neutron star speed, but this is quite uncertain because of large PM errors. With this speed, the CCO must be still quite near the explosion center (within ).
-
3.
Nonradial motions are apparent in several regions. In the bright east quadrant, we observe flow around some X-ray-dark obstacle.
-
4.
We find that pure heavy-element ejecta devoid of H and He can explain all the emission seen in almost all the bright regions of G350.10.3, indicating that the shocked ejecta strongly dominate over any CSM/ISM emission there. In addition to intermediate-mass elements that dominate the X-ray spectra, there is freshly synthesized iron within these fast-moving ejecta. Some iron-rich regions are expanding at 3000–5000 km s-1. The region with the fastest expansion PMs also shows a redshift of 2000–3000 km s-1, for a space velocity of almost km s-1.
-
5.
We find markedly different conditions in faint parts of G350.10.3, in one of which we find no evidence for supersolar abundances.
The extreme spatial asymmetry of the X-ray emission with respect to the CCO must be due to some combination of intrinsic asymmetry in the explosion and asymmetric surroundings. Evidence of strong asymmetry in the explosion itself is provided by our finding of iron within very high velocity SN ejecta. Rayleigh-Taylor instabilities in expanding supernova ejecta have been invoked to explain elemental asymmetries inferred from observations of supernovae (e.g., Orlando et al., 2016), with 3D simulations showing “fingers” of iron-group elements penetrating to larger radii and velocities (Gabler et al., 2020). However, the range of models shown there failed to produce significant masses of iron moving at 4000 km s-1 or faster. A study of SN 2013ej, a peculiar SN IIP (Utrobin & Chugai, 2017), invoked a jetlike explosion in a red supergiant to fit the light curve, and deduced mixing of IGEs to 4000–6500 km s-1.
Evidence for a highly irregular CSM is also strong. A low velocity for the CCO argues against the east region representing the bulk of the ejecta, as it suggests equal momentum ejected in the opposite direction. The absence of bright emission to the west then indicates lower densities in that direction. Clearly absent is any strong indication of CCO motion opposite to the bulk of observed X-rays as found in five of six more symmetric remnants studied by Holland-Ashford et al. (2017). At a smaller scale, the interaction of ejecta with some dark obstacle in the east is very obvious, requiring a substantially higher density there. While the deceleration caused by this obstacle can be partly responsible for the much greater brightness in this area, the large deceleration we measure in southeast regions, which are quite faint, rules out any simple relation between deceleration and brightness. We conclude that both the ejecta and surrounding material in G350.10.3 are highly inhomogeneous.
We located one faint region (NNE) that appears to be relatively free of ejecta, suggesting that it represents a part of the blast wave interacting with circumstellar or interstellar material. However, we were unable to trace any coherent features corresponding to the blast wave on larger scales. Very blue (hard-spectrum) emission region H1 (see Figures 1 and 2) may be nonthermal emission, but scattered light from the adjacent bright emission makes analysis difficult.
The brightest part of G350.10.3 is made up of ejecta heated in a reverse (inward-facing) shock. Material farther from the CCO would have been shocked longer ago, so one might expect systematically increasing ionization ages as one moves east. Furthermore, if electrons are progressively heated by Coulomb collisions rather than in some collisionless process at the shock, the electron temperature should also increase in that direction. We observe both trends (see Figure 4 and the corresponding text). However, the spatial separation of those regions is almost certainly too large to be due to this effect in a single well-defined shock. The absence of an obvious feature corresponding to a reverse shock strengthens this conclusion. It is more likely that projection effects and multiple shocks are involved.
High-velocity Fe ejecta can be produced more easily in asymmetric models. Utrobin & Chugai (2017) showed that observations of several SN IIP events (i.e., from progenitors with extended envelopes) require high-velocity Fe, and modeled them successfully with highly asymmetric (bipolar) ejection of IGEs. On the other hand, Cas A resulted from a mostly stripped SN IIb progenitor, while SN 1987A’s progenitor was a blue supergiant—i.e., both events without extended envelopes. SN ejecta are expected to be least decelerated on average for SNe IIb, Ib, and Ic because of their relatively low ejecta masses. Maximum IGE velocities over 5000 km s-1 might be common in these stripped-envelope SNe. However, models of artificially mixed SNe Ibc (Woosley et al., 2020) are subluminous compared to observations, and may be subenergetic as well. So for G350.10.3, there is a slight preference for a stripped-envelope event as opposed to an SN IIP. But with no data from the supernova event that created G350.10.3, we cannot constrain the nature of the progenitor further.
The high Ni overabundance found by Yasumi et al. (2014), with a Ni/Fe mass ratio of ( times solar), while uncertain, is quite intriguing in view of the very high velocity Fe that we found in G350.10.3. Such elevated abundances of Ni are quite rare; Jerkstrand et al. (2015a) reported Ni/Fe times solar in SN 2012ec, and collected observations of several other SNe for which this determination is possible. Jerkstrand et al. (2015b) used parameterized thermodynamic trajectories to constrain the conditions for high Ni/Fe production, and showed that spherically symmetric models with lower progenitor mass are able to accomplish this. However, such 1D models do not explode. The asymmetries required for successful CC supernova explosions in simulations may also eject more neutron-rich IGEs for a wider mass range of progenitors. If future observations confirm the high Ni/Fe ratio in G350.10.3, it is possible that the explosion asymmetries required for the fast Fe may also play a role in stable nickel production.
Finally, we note that a distance as large as 9 kpc (Yasumi et al., 2014) would imply 12,000 km s-1 ejecta velocities, with some 56Ni ejected with such astonishing speeds during the explosion. However, the high column densities ( cm-2) argue against a distance much less than 4.5 kpc.
6 Conclusions
Our observations indicate that G350.10.3 is an extremely asymmetric remnant, with an expansion center at or near the CCO and expansion velocities of up to km s-1. These velocities give expansion ages of as little as 600 yr, so that the remnant is younger than this—the third youngest known CC SNR in the Galaxy. The presence of ejecta, iron in particular, at such high velocities is strong evidence in favor of G350.10.3 having resulted from an asymmetric, perhaps stripped-envelope supernova event. As such, it represents the most extreme case among remnants of this phenomenon, and warrants careful study. More detailed spectroscopic analysis is possible with these data, and can cast light on this phenomenon.
References
- Arnaud (1996) Arnaud, K. A. 1996, in ASP Conf. Ser.101, Astronomical Data Analysis and Systems V, ed. G. Jacoby & J. Barnes (San Francisco, CA: ASP), 17
- Borkowski et al. (2020) Borkowski, K. J., Reynolds, S. P., & Miltich, W. 2020, ApJL, 895, L32
- Borkowski et al. (2018) Borkowski, K. J., Reynolds, S. P., Williams, B. J., & Petre, R. 2018, ApJL, 868, L21
- Cash (1979) Cash, W. 1979, ApJ, 228, 939
- DeLaney et al. (2010) DeLaney, T., Rudnick, L., Stage, M. D., et al. 2010, ApJ, 725, 2038
- Gabler et al. (2020) Gabler, M., Wongwathanarat, A., & Janka, H.-T. 2020, arXiv:2008.01763
- Gaensler et al. (2008) Gaensler, B. M., Tanna, A., Slane, P. O., et al. 2008, ApJL, 680, L37
- Grevesse & Sauval (1998) Grevesse, N., & Sauval, A. J. 1998, SSRv, 85, 161
- Holland-Ashford et al. (2017) Holland-Ashford, T., Lopez, L. A., Auchettl, K., Temim, T., & Ramirez-Ruiz, E. 2017, ApJ, 844, 84
- Houck & Fransson (1996) Houck, J. C., & Fransson, C. 1996, ApJ, 456, 811
- Jerkstrand et al. (2015a) Jerkstrand, A., Smartt, S. J., Sollerman, J., et al. 2015a, MNRAS, 448, 2482
- Jerkstrand et al. (2015b) Jerkstrand, A., Timmes, F. X., Magkotsios, G., et al. 2015b, ApJ, 807, 110
- Lovchinsky et al. (2011) Lovchinsky, I., Slane, P., Gaensler, B. M., et al. 2011, ApJ, 731, 70
- McCray & Fransson (2016) McCray, R., & Fransson, C. 2016, ARAA, 54, 19
- Orlando et al. (2016) Orlando, S., Miceli, M., Pumo, M. L., & Bocchino, F. 2016, ApJ, 822, 22
- Orlando et al. (2020) Orlando, S., Ono, M., Nagataki, S., et al. 2020, A&A, 636, A22
- Reynolds et al. (2018) Reynolds, S. P., Borkowski, K. J., & Gwynne, P. H. 2018, ApJ, 856, 133
- Salter et al. (1986) Salter, C. J., Patnaik, A. R., Shaver, P. A., & Hunt, G. C. 1986, A&A, 162, 217
- Thorstensen et al. (2001) Thorstensen, J. R., Fesen, R. A., & van den Bergh, S. 2001, AJ, 122, 297
- Utrobin & Chugai (2017) Utrobin, V. P., & Chugai, N. N. 2017, MNRAS, 472, 5004
- Utrobin & Chugai (2019) Utrobin, V. P., & Chugai, N. N. 2019, MNRAS, 490, 2042
- Wongwathanarat et al. (2017) Wongwathanarat, A., Janka, H.-T., Müller, E., Pllumbi, E., & Wanajo, S. 2017, ApJ, 842, 13
- Woosley et al. (2020) Woosley, S., Sukhbold, T., & Kasen, D. 2020, arXiv:2009.06868
- Yasumi et al. (2014) Yasumi, M., Nobukawa, M., Nakashima, S., et al. 2014, PASJ, 66, 68