Instantaneous Normal Modes Reveal Structural Signatures for the Herschel-Bulkley Rheology in Sheared Glasses
Abstract
The Herschel-Bulkley law, a universal constitutive relation, has been empirically known to be applicable to a vast range of soft materials, including sheared glasses. Although the Herschel-Bulkley law has attracted public attention, its structural origin has remained an open question. In this letter, by means of atomistic simulation of binary Lennard-Jones glasses, we report that the instantaneous normal modes with negative eigenvalues, or so-called imaginary modes, serve as the structural signatures for the Herschel-Bulkley rheology in sheared glasses.
Many soft materials are empirically known to obey a universal constitutive relation, or the so-called Herschel-Bulkley (HB) law Herschel and Bulkley (1926), where is the steady-state average of the shear stress , is the yield stress, is the strain rate, is the HB exponent, and is a coefficient. Examples encompass, for instance, foams Gilbreth et al. (2006), emulsions Bécu et al. (2006); Dinkgreve et al. (2015), microgel suspensions Moller et al. (2009); Gutowski et al. (2012), soft athermal particles Olsson and Teitel (2012); Oyama et al. (2019a), blood Gosselin et al. (2016), vegetables, and fruits Diamante and Umemoto (2015). Experiments Petekidis et al. (2004); Philippe et al. (2018) and numerical simulations Tsamados (2010); Ikeda et al. (2012); Liu et al. (2016); Singh et al. (2020) have confirmed that glasses, the target of this letter, also exhibit HB-type rheological behaviors. Despite the ubiquity of the HB law, however, its structural origin remains an open question even after more than 90 years since the original paper by Herschel and Bulkley Herschel and Bulkley (1926).
In this letter, we explore the structural signatures of the HB law in sheared glasses by means of atomistic simulations. We first show that the shear stress suffers from finite size effects and thus that the HB exponent cannot be determined by direct fitting. To resolve this problem, we rely on the characteristic structural information of plastic events, or avalanches, which are responsible for the complex rheological response Lemaître and Maloney (2006). In particular, we numerically demonstrate that the instantaneous normal modes (INMs) Bembenek and Laird (1995); Stratt (1995); Keyes (1997); Gezelter et al. (1997); Bembenek and Laird (2001) allow us to extract structures of avalanches: so-called imaginary INMs (Im-INMs), which have negative eigenvalues, correspond to shear transformations (STs), the elementary processes of avalanches Maloney and Lemaître (2006). A phenomenological argument based on the criticality of yielding transition further enables us to determine the HB exponent from the shear rate dependence of the statistics of Im-INMs. The obtained value of is validated by the scaling collapse of the shear stress. With all these results, we conclude that Im-INMs serve as the structural signatures of the HB law in sheared glasses.
System setup. — We employ a two-dimensional () glass system introduced in ref. Oyama et al. (2020). The interparticle interaction is described by the Lennard-Jones potential with smoothing terms that guarantee the smoothness of potential and force at the cutoff distance , where determines the interaction range between particles and . To avoid crystallization, we consider a 50:50 binary mixture of particles with an equal mass and different interaction ranges. The interaction ranges for different combinations of particle types are , and , where subscripts and distinguish different species of particles. The energy scale is set to be constant regardless of particle species. Throughout this letter, physical variables are nondimensionalized by the length unit , the mass unit and the energy unit . We fix the number density to be . Initial configurations are obtained by minimizing the potential energy of randomly generated particle distributions. The thermal fluctuations are ignored.
We then apply external shear with different rates. At each numerical step, purely affine shearing deformation of strain is applied first, and then, the nonaffine dynamics are solved by integrating the equations of motion under the Lees-Edwards boundary condition Allen and Tildesley (1987). To dissipate the input energy, the drag force proportional to the nonaffine velocity is exerted on each particle as Lemaître and Maloney (2006); Salerno et al. (2012). In this work, we use . To tune the shear rate, we fix the strain step at and change the time step . By this protocol, plastic events are detected with the same resolution regardless of the shear rate .
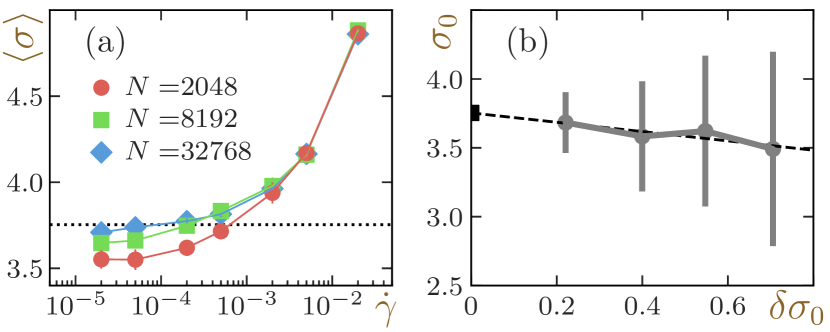
Flow curves of different system sizes. — We start with the results of flow curves, or the plot of the stress as a function of the shear rate , of different system sizes. We prepared different samples for each system size and applied simple shear at different rates in the range of . For each sample and shear rate, we calculated the mean steady-state stress from the data in the range of , where is the total amount of the applied strain. In Fig. 1(a), we plot the sample-averaged steady-state stress of different system sizes as functions of the shear rate . While the results of different system sizes match very well at high rates, they exhibit discrepancies at low rates. Because of these finite size effects, it is not clear which part should be fitted, and we cannot determine the HB parameters, namely, the yield stress and the HB exponent , by direct fitting.
The criticality of the yielding transition allows us to estimate the yield stress , with the finite size effects being properly taken into account. First, given the criticality, it is natural to set the following two scaling ansatzes: and , where stands for the distance to the critical point, and are critical exponents and is the characteristic length. In the current situation, corresponds to the average spatial expansion of avalanches Lin et al. (2014). These avalanches are composed of multiple STs, or the elementary processes of plastic events Maloney and Lemaître (2006).
Now, let us consider a system under athermal quasistatic (AQS) shear, where the thermal fluctuations are absent and shear is imposed quasistatically. Since the characteristic length reaches the system size () in this situation, utilizing the so-called statistical tilt symmetry Fisher (1998); Kolton et al. (2009); Lin et al. (2014), we can express the system size dependence of the steady-state average stress and its fluctuations as and respectively Lin et al. (2014), where and are nonuniversal constants. Because is positive by definition, the thermodynamic limit () gives the intrinsic yield stress , which is accompanied by the disappearance of fluctuations . We performed AQS simulations whose details are found in ref. Oyama et al. (2020) and measured as a function of , as shown in Fig. 1(b). By extrapolating the data, we obtained the value of the intrinsic yield stress as . We note that the degree of system size dependence depends on the details of systems, as reflected by nonuniversal coefficients and . In fact, while some previous studies have reported system size-dependent flow curves consistent with our results Lemaître and Caroli (2009); Chattoraj et al. (2010); Hatano (2011); Roy et al. (2015), such finite size effects were not observed in refs. Tsamados (2010); Singh et al. (2020).
The statistical tilt symmetry further enables us to derive a scaling relation that provides the value of the HB exponent , where is defined as , is the average time duration of avalanches of size , and is the fractal dimension of avalanches Kolton et al. (2009); Lin et al. (2014). However, while can be measured by AQS simulations as Oyama et al. (2020), cannot be measured in particle-based simulations in principle. Thus, we cannot utilize this scaling relation. To bypass this problem, we need another way to estimate .
Instantaneous normal modes. — We turn our attention to the structural signatures of plastic events, which are responsible for the complex rheological behaviors Lemaître and Maloney (2006). In the case of systems under AQS shear, normal mode (NM) analysis has revealed that the onset of plastic events can be captured by the minimum eigenvalue of the dynamical matrix, or the Hessian of the potential energy with respect to the particle positions Maloney and Lemaître (2004): in the vicinity of the critical strain at which a plastic event takes place, the minimum eigenvalue decreases as shear is applied 111We ignore the trivial modes corresponding to the global translations.. finally decays to zero at and excites a corresponding ST, the elementary process of a plastic event. The released energy from the excited ST propagates throughout the system via the elastic field and can excite further secondary STs, leading to an avalanche Maloney and Lemaître (2006). What if, then, we conduct similar analyses in systems under finite rate shear? To tackle this simple question, we employed INM analysis Bembenek and Laird (1995); Stratt (1995); Keyes (1997); Gezelter et al. (1997); Bembenek and Laird (2001). The INMs are obtained as the eigenmodes of the dynamical matrix calculated from the instantaneous particle configurations. Under AQS shear, the INMs are identical to the standard NMs by definition.
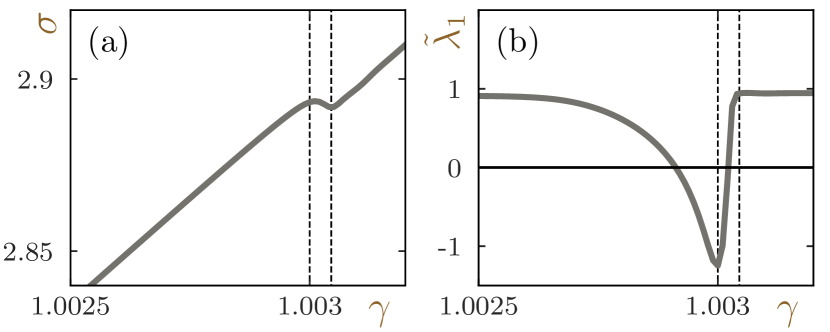
We now present the results of the INM analysis under finite rate shear. We note that although the results for the system with are explained in detail as a reference, the qualitative behaviors do not depend on the system sizes. When only one single ST is excited under a very slow shear (), we observe qualitatively similar behaviors to those of NMs under AQS shear (Fig. 2): all eigenvalues are positive in the elastic branch (where the stress rises), and the minimum eigenvalue decreases drastically in the vicinity of the critical strain . However, unlike the case of systems under AQS shear, the stress does not start decreasing when becomes zero. Thus, becomes even negative: the corresponding mode becomes a so-called imaginary mode. then stops decreasing at , at which the stress starts decreasing. Since the system requires nonzero time to dissipate the released energy from an excited ST, the corresponding Im-INM survives over a finite strain even beyond . These results suggest that Im-INMs correspond to evolving excited STs. In fact, as presented below, this speculation is the case even when multiple Im-INMs are present simultaneously.
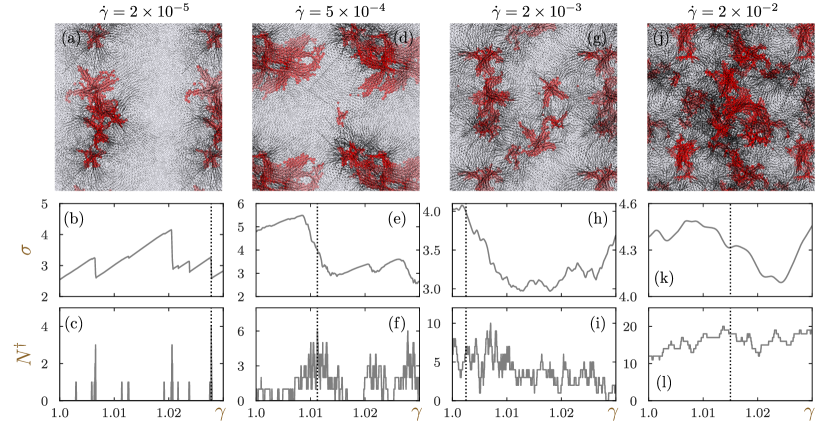
As stated above, STs sometimes form avalanches whose shapes change drastically as increases. To present the shear-rate-dependent change in structures of avalanches, we further plot the stress and the number of Im-INMs as functions of the applied strain in Fig. 3. When the rate is low (), peaks of are observed in a clearly synchronized manner with stress drop events (Fig. 3(b,c)). In particular, large stress drop events are accompanied by multiple Im-INMs. If we visualize the obtained Im-INMs at a peak, we find that STs corresponding to those modes form a quasilinear avalanche (Fig. 3(a)). When the shear rate becomes intermediate (), the amount of strain applied during the average lifetime of an ST becomes comparable to the typical strain interval between STs. As a result, successive STs barely overlap temporally, as indicated by a narrow peak with at approximately (Fig. 3(e,f)). Nevertheless, avalanche events, which are indicated by multiple Im-INMs and take place less frequently, hardly overlap. The absence of overlaps of avalanches is manifested by the fact that becomes zero between avalanches. The visualization result (Fig. 3(d)) of the event with the largest is composed of a large system-spanning avalanche and an isolated ST. When the shear rate becomes high (), a strain large enough to induce secondary avalanches is applied during the typical lifetime of avalanches, and even avalanches start overlapping. As a consequence, stress drop events and the peaks of become obscured, and we cannot precisely locate them anymore (Fig. 3(h,i)). The typical number of Im-INMs is notably larger than those under slower shear, and their visualization is composed of multiple avalanches, as shown in Fig. 3(g). The temporal overlap of avalanches is the cause of the decrease in the characteristic length of avalanches and expected for the system with Lin et al. (2014). We stress that, indeed, holds for (Fig. 1(a)). If we increase the shear rate further (), both stress drops and peaks of becomes completely obscured (Fig. 3(k,l)). Although this result is presumably because many avalanches are simultaneously present, we can no longer decompose the visualized structure into individual avalanches (Fig. 3(j)).
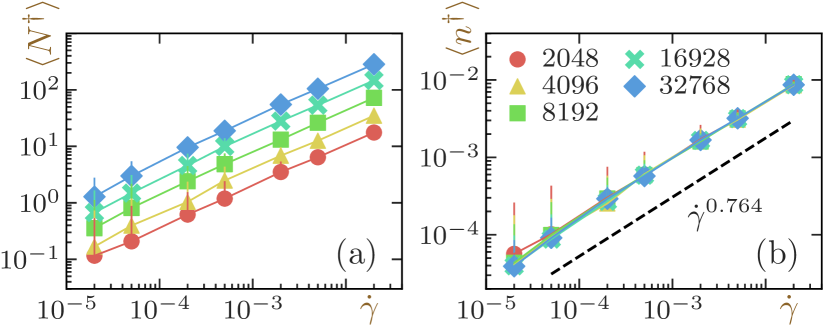
To quantify these complicated shear-rate-dependent structural changes of avalanches, we measure the average number of Im-INMs, , which carries information about the typical number and size of avalanches. We plot the results as functions of the shear rate in Fig. 4(a). As seen here, increases in a power-law manner regardless of the system size and the shear rate. Furthermore, if we define the Im-INM density , the results for different system sizes all overlap without any parameters (Fig. 4(b)). These results suggest that can be expressed as , where the exponent is estimated as by fitting (All values of critical exponents are summarized in SM2 222See the Supplemental Material at [URL will be inserted by publisher]).
Scaling argument. — Now, we present an argument that reveals the relation between the exponent and the HB exponent . Above threshold (), there are multiple avalanches with an average linear size of . By definition, the number of avalanches in this situation is described as Lin et al. (2014). Since avalanches possess -dimensional fractal structures, we can estimate the number of STs per avalanche as . The expected average number of STs is then expressed simply by the product of and as
| (1) |
Here, we utilized the relations Kolton et al. (2009); Lin et al. (2014), and in the last equality. This simple estimation accounts for the linear dependence of on the system size . Furthermore, importantly, Eq. 1 predicts that the exponent should coincide with the HB exponent 333 The simple estimation here itself is applicable only to the situations with , which is met for large systems and the high shear rate regime, although the same power-law behavior is observed for all system sizes and shear rates..
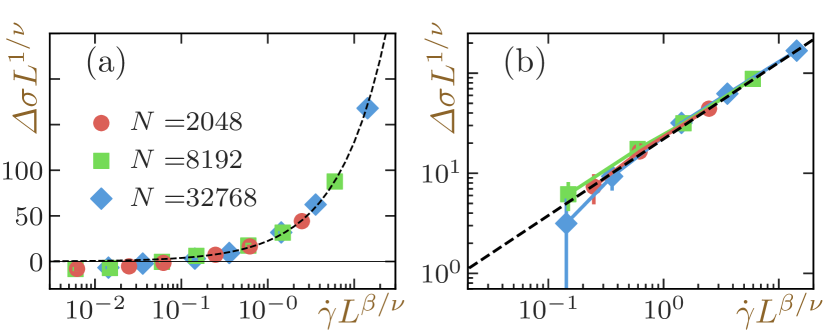
To further check the reliability of the obtained value of the HB exponent , now, we consider the finite size scaling of the flow curves. The scaling ansatzes simply imply the scaling relation , where is a suitable scaling function Lin et al. (2014). As shown in Fig. 5(a), the results for different system sizes are collapsed very well with this relation. Furthermore, the curve of the HB law precisely captures the simulation data meeting (Fig. 5(b)). Note that the exponents and meet the relation . These results mean that the HB exponent can be accurately estimated by the average number of Im-INMs, and thus, we conclude that these modes serve as the structural signatures of the HB law.
We stress that mean-field theory Hébraud and Lequeux (1998) predicts the value of , and several studies have reported consistent values Lemaître and Caroli (2009); Dinkgreve et al. (2015); Vasisht et al. (2018); Cabriolu et al. (2019); Singh et al. (2020). We show in SM3 Note (2) that if we ignore the finite size effects and fit to the whole data of a single system size directly as in previous studies, we also obtain consistent values .
Summary and overview. — To summarize, we first showed that Im-INMs provide information about evolving STs. Then, by investigating the shear rate-dependent development of complicated structures of avalanches, we further showed that the average number of Im-INMs exhibits a power-law dependence on the shear rate with the same exponent as the HB law. These findings were further validated by the success of scaling collapse of flow curves with different system sizes. From all these results, we conclude that Im-INMs are the structural signatures of the HB rheology of sheared glasses.
It would be very important to investigate whether the findings in this letter are applicable to other soft materials that obey the HB law, such as suspensions or emulsions, where the jamming criticality also plays a major role. Investigating the effects of the introduction of thermal Karmakar et al. (2010); Chattoraj et al. (2010, 2011) or various types of active noises Fily and Marchetti (2012); Berthier et al. (2017); Oyama et al. (2019b) would also provide useful knowledge for material design.
Acknowledgements.
This work was financially supported by KAKENHI grants (nos. 18H05225, 19H01812, 19K14670, 20H01868, 20H00128, 20K14436 and 20J00802) and partially supported by the Asahi Glass Foundation.References
- Herschel and Bulkley (1926) Winslow H Herschel and Ronald Bulkley, “Konsistenzmessungen von Gummi-Benzollösungen,” Kolloid-Zeitschrift 39, 291–300 (1926).
- Gilbreth et al. (2006) Christopher Gilbreth, Scott Sullivan, and Michael Dennin, “Flow transitions in two-dimensional foams,” Phys. Rev. E 74, 051406 (2006).
- Bécu et al. (2006) Lydiane Bécu, Sébastien Manneville, and Annie Colin, “Yielding and Flow in Adhesive and Nonadhesive Concentrated Emulsions,” Phys. Rev. Lett. 96, 138302 (2006), arXiv:0603171 [cond-mat] .
- Dinkgreve et al. (2015) M. Dinkgreve, J. Paredes, M. A. J. Michels, and D. Bonn, “Universal rescaling of flow curves for yield-stress fluids close to jamming,” Phys. Rev. E 92, 012305 (2015).
- Moller et al. (2009) Peder Moller, Abdoulaye Fall, Vijayakumar Chikkadi, Didi Derks, and Daniel Bonn, “An attempt to categorize yield stress fluid behaviour,” Philos. Trans. R. Soc. A Math. Phys. Eng. Sci. 367, 5139–5155 (2009).
- Gutowski et al. (2012) Iris A Gutowski, David Lee, John R. de Bruyn, and Barbara J Frisken, “Scaling and mesostructure of Carbopol dispersions,” Rheol. Acta 51, 441–450 (2012).
- Olsson and Teitel (2012) Peter Olsson and S. Teitel, “Herschel-Bulkley Shearing Rheology Near the Athermal Jamming Transition,” Phys. Rev. Lett. 109, 108001 (2012).
- Oyama et al. (2019a) Norihiro Oyama, Hideyuki Mizuno, and Kuniyasu Saitoh, “Avalanche Interpretation of the Power-Law Energy Spectrum in Three-Dimensional Dense Granular Flow,” Phys. Rev. Lett. 122, 188004 (2019a).
- Gosselin et al. (2016) David Gosselin, Maxime Huet, Myriam Cubizolles, David Rabaud, Naceur Belgacem, Didier Chaussy, and Jean Berthier, “Viscoelastic capillary flow: the case of whole blood,” AIMS Biophys. 3, 340–357 (2016).
- Diamante and Umemoto (2015) Lemuel Diamante and Moyuru Umemoto, “Rheological Properties of Fruits and Vegetables: A Review,” Int. J. Food Prop. 18, 1191–1210 (2015).
- Petekidis et al. (2004) G Petekidis, D Vlassopoulos, and P N Pusey, “Yielding and flow of sheared colloidal glasses,” J. Phys. Condens. Matter 16, S3955–S3963 (2004).
- Philippe et al. (2018) Adrian-marie Philippe, Domenico Truzzolillo, Julian Galvan-Myoshi, Philippe Dieudonné-George, Véronique Trappe, Ludovic Berthier, and Luca Cipelletti, “Glass transition of soft colloids,” Phys. Rev. E 97, 040601 (2018).
- Tsamados (2010) M. Tsamados, “Plasticity and dynamical heterogeneity in driven glassy materials,” Eur. Phys. J. E 32, 165–181 (2010).
- Ikeda et al. (2012) Atsushi Ikeda, Ludovic Berthier, and Peter Sollich, “Unified study of glass and jamming rheology in soft particle systems,” Phys. Rev. Lett. 109, 018301 (2012), arXiv:1203.0825 .
- Liu et al. (2016) Chen Liu, Ezequiel E. Ferrero, Francesco Puosi, Jean-Louis Barrat, and Kirsten Martens, “Driving Rate Dependence of Avalanche Statistics and Shapes at the Yielding Transition,” Phys. Rev. Lett. 116, 065501 (2016), arXiv:1506.08161 .
- Singh et al. (2020) Murari Singh, Misaki Ozawa, and Ludovic Berthier, “Brittle yielding of amorphous solids at finite shear rates,” Phys. Rev. Mater. 4, 025603 (2020), arXiv:1912.06416 .
- Lemaître and Maloney (2006) Anaël Lemaître and Craig Maloney, “Sum Rules for the Quasi-Static and Visco-Elastic Response of Disordered Solids at Zero Temperature,” J. Stat. Phys. 123, 415–453 (2006), arXiv:0410592 [cond-mat] .
- Bembenek and Laird (1995) Scott D. Bembenek and Brian B. Laird, “Instantaneous Normal Modes and the Glass Transition,” Phys. Rev. Lett. 74, 936–939 (1995).
- Stratt (1995) Richard M. Stratt, “The Instantaneous Normal Modes of Liquids,” Acc. Chem. Res. 28, 201–207 (1995).
- Keyes (1997) T. Keyes, “Instantaneous Normal Mode Approach to Liquid State Dynamics,” J. Phys. Chem. A 101, 2921–2930 (1997).
- Gezelter et al. (1997) J. Daniel Gezelter, Eran Rabani, and B. J. Berne, “Can imaginary instantaneous normal mode frequencies predict barriers to self-diffusion?” J. Chem. Phys. 107, 4618–4627 (1997).
- Bembenek and Laird (2001) Scott D. Bembenek and Brian B. Laird, “Instantaneous normal modes analysis of amorphous and supercooled silica,” J. Chem. Phys. 114, 2340–2344 (2001).
- Maloney and Lemaître (2006) Craig E. Maloney and Anaël Lemaître, “Amorphous systems in athermal, quasistatic shear,” Phys. Rev. E 74, 016118 (2006), arXiv:0510677 [cond-mat] .
- Oyama et al. (2020) Norihiro Oyama, Hideyuki Mizuno, and Atsushi Ikeda, “Unified View of Avalanche Criticality in Sheared Glasses,” (2020), arXiv:2009.02635 .
- Allen and Tildesley (1987) Michael P Allen and Dominic J Tildesley, Computer simulation of liquids (Oxford University Press, 1987).
- Salerno et al. (2012) K. Michael Salerno, Craig E. Maloney, and Mark O. Robbins, “Avalanches in Strained Amorphous Solids: Does Inertia Destroy Critical Behavior?” Phys. Rev. Lett. 109, 105703 (2012), arXiv:1204.5965 .
- Lin et al. (2014) Jie Lin, Edan Lerner, Alberto Rosso, and Matthieu Wyart, “Scaling description of the yielding transition in soft amorphous solids at zero temperature,” Proc. Natl. Acad. Sci. 111, 14382–14387 (2014), arXiv:1403.6735 .
- Fisher (1998) Daniel S. Fisher, “Collective transport in random media: from superconductors to earthquakes,” Phys. Rep. 301, 113–150 (1998).
- Kolton et al. (2009) Alejandro B. Kolton, Alberto Rosso, Thierry Giamarchi, and Werner Krauth, “Creep dynamics of elastic manifolds via exact transition pathways,” Phys. Rev. B 79, 184207 (2009).
- Lemaître and Caroli (2009) Anaël Lemaître and Christiane Caroli, “Rate-Dependent Avalanche Size in Athermally Sheared Amorphous Solids,” Phys. Rev. Lett. 103, 065501 (2009).
- Chattoraj et al. (2010) Joyjit Chattoraj, Christiane Caroli, and Anaël Lemaître, “Universal Additive Effect of Temperature on the Rheology of Amorphous Solids,” Phys. Rev. Lett. 105, 266001 (2010), arXiv:1005.1179 .
- Hatano (2011) Takahiro Hatano, “Rheology and dynamical heterogeneity in frictionless beads at jamming density,” J. Phys. Conf. Ser. 319, 012011 (2011).
- Roy et al. (2015) Arka Prabha Roy, Kamran Karimi, and Craig E. Maloney, “Rheology, diffusion, and velocity correlations in the bubble model,” (2015), arXiv:1508.00810 .
- Note (2) See the Supplemental Material at [URL will be inserted by publisher].
- Maloney and Lemaître (2004) Craig Maloney and Anaël Lemaître, “Universal Breakdown of Elasticity at the Onset of Material Failure,” Phys. Rev. Lett. 93, 195501 (2004), arXiv:0405096 [cond-mat] .
- Note (1) We ignore the trivial modes corresponding to the global translations.
- Note (3) The simple estimation here itself is applicable only to the situations with , which is met for large systems and the high shear rate regime, although the same power-law behavior is observed for all system sizes and shear rates.
- Hébraud and Lequeux (1998) P Hébraud and F Lequeux, “Mode-Coupling Theory for the Pasty Rheology of Soft Glassy Materials,” Phys. Rev. Lett. 81, 2934–2937 (1998), arXiv:9805373 [cond-mat] .
- Vasisht et al. (2018) Vishwas V Vasisht, Sudeep K Dutta, Emanuela Del Gado, and Daniel L Blair, “Rate Dependence of Elementary Rearrangements and Spatiotemporal Correlations in the 3D Flow of Soft Solids,” Phys. Rev. Lett. 120, 018001 (2018).
- Cabriolu et al. (2019) Raffaela Cabriolu, Jürgen Horbach, Pinaki Chaudhuri, and Kirsten Martens, “Precursors of fluidisation in the creep response of a soft glass,” Soft Matter 15, 415–423 (2019), arXiv:1807.04330 .
- Karmakar et al. (2010) Smarajit Karmakar, Edan Lerner, Itamar Procaccia, and Jacques Zylberg, “Statistical physics of elastoplastic steady states in amorphous solids: Finite temperatures and strain rates,” Phys. Rev. E 82, 031301 (2010).
- Chattoraj et al. (2011) Joyjit Chattoraj, Christiane Caroli, and Anaël Lemaître, “Robustness of avalanche dynamics in sheared amorphous solids as probed by transverse diffusion,” Phys. Rev. E 84, 011501 (2011).
- Fily and Marchetti (2012) Yaouen Fily and M Cristina Marchetti, “Athermal Phase Separation of Self-Propelled Particles with No Alignment,” Phys. Rev. Lett. 108, 235702 (2012).
- Berthier et al. (2017) Ludovic Berthier, Elijah Flenner, and Grzegorz Szamel, “How active forces influence nonequilibrium glass transitions,” New J. Phys. New J. Phys 19 (2017).
- Oyama et al. (2019b) Norihiro Oyama, Takeshi Kawasaki, Hideyuki Mizuno, and Atsushi Ikeda, “Glassy dynamics of a model of bacterial cytoplasm with metabolic activities,” Phys. Rev. Res. 1, 032038 (2019b), arXiv:1904.09052 .