FRB131104 Swift BAT data revisited: No evidence of a gamma-ray counterpart
Abstract
We present a re-analysis of the Swift Burst Alert Telescope (BAT) data around the radio detection of FRB 131104. Possible evidence of a gamma-ray counterpart was presented by DeLaunay et al. (2016). However, based on our analysis using all the available BAT data, no significant emission is found in either the temporal or the image domain. We place a 5 fluence upper limit of 3.3 10-6 erg cm-2 and 2.7 10-6 erg cm-2 ( keV) with an integration time of 300 s assuming a simple power-law spectrum with photon index of and , respectively. Our result does not support the association of this FRB with a high-energy counterpart, in agreement with growing observational evidence that most FRBs are not associated to catastrophic events such as gamma-ray bursts.
1 Introduction
Fast Radio Bursts (FRBs; Lorimer et al. 2007; Thornton et al. 2013) are bright (Jy) and short-lived (10 ms) pulses of coherent, low-frequency (0.4–8 GHz) radio emission. With an estimated all-sky rate of 103 - 104 events per day (Thornton et al., 2013; Champion et al., 2016; Connor et al., 2016a), FRBs dominate the transient radio sky. Yet their true nature remains a mystery. Mounting observational evidences – such as their high Galactic latitudes, excessive dispersion and rotation measures (Lorimer et al., 2007; Thornton et al., 2013; Masui et al., 2015; Petroff et al., 2016), and the recent identification of their host galaxies (e.g. Chatterjee et al., 2017; Bhandari et al., 2020) – suggest that FRBs originate from cosmological distances. They have a power law luminosity function spanning orders of magnitude (Luo et al., 2018, 2020a; Lu et al., 2020a, b), and an isotropic equivalent energy in the range erg (Zhang, 2020).
The fact that at least some FRB sources repeat Spitler et al. (2016); Scholz et al. (2016); CHIME/FRB Collaboration (2019a, b); Luo et al. (2020b) and that the FRB event rate density exceeds those of catastrophic explosions such as supernovae (Ravi, 2019; Luo et al., 2020a) suggest that the majority of FRBs should arise from non-catastrophic events. Likely scenarios include bursting magnetar (Popov & Postnov, 2013; Lyubarsky, 2014; Katz, 2016; Lu et al., 2020b) or radio pulsar giant pulses (Cordes & Wasserman, 2016; Connor et al., 2016b), or some models invoking interactions with a neutron star magnetosphere (Zhang, 2017, 2020). Nevertheless, the possibility that a small fraction of FRBs may be related to catastrophic events is not ruled out.
Among catastrophic models, several scenarios predict an association between an FRB and a gamma-ray burst (GRB). First, if the collapse of a supramassive neutron star can make an FRB (Falcke & Rezzolla, 2014), Zhang (2014) showed that a GRB could be followed by an FRB, occurring at the time when the internal X-ray plateau abruptly ends (Troja et al., 2007). Second, several authors have suggested that compact binary mergers may produce an FRB in association with a short GRB (e.g. Wang et al., 2016; Zhang, 2016). Finally, even for non-catastrophic events, a foreground neutron star magnetosphere being suddenly reshaped by the blastwave of a GRB can also make an FRB associated with a GRB (Zhang, 2017). A robust GRB-FRB association is essential to constrain these models.
Most searches for coincident GRB-FRB associations, unsurprisingly, gave negative results (e.g. Bannister et al., 2012; Palaniswamy et al., 2014; Sun et al., 2018; Cunningham et al., 2019; Martone et al., 2019; Anumarlapudi et al., 2020; Guidorzi et al., 2020; Palliyaguru et al., 2020; Rowlinson et al., 2020). However, one potential association has been claimed. DeLaunay et al. (2016) (hereafter D16) presented the discovery of a long-lived (380 s) hard X-ray transient, Swift J0644.5-5111, spatially coincident with FRB 131104 (Ravi et al., 2015). The onset of the high-energy emission appears delayed by 300 s with respect to the FRB, and due to its low significance (4) it was not found by the standard on-board trigger algorithm, but during a targeted archival search for FRB counterparts. This search included two more known FRBs for which no gamma-ray counterpart was detected in the Swift data. A possible origin for Swift J0644.5-5111 and its association to FRB131104 was discussed by Murase et al. (2017). Shannon & Ravi (2017) pointed out that the lack of a radio afterglow disfavors a standard GRB fireball scenario, whereas Gao & Zhang (2017) found that the radio upper limits can be still consistent with the existence of a GRB for a reasonable range of parameters. Zhang (2017) suggested that the event could be a result of interaction between a GRB blastwave and the magnetosphere of a foreground neutron star (the “cosmic comb” model).
The association between a long-lasting high-energy transient and an FRB, if confirmed, would greatly constrain FRB source models, at least for this event. For instance, the reported long duration disfavors those scenarios with a short-lived central engine, such as compact object mergers. Most importantly, if placed at the same estimated redshift 0.5 of FRB 131104, the observed fluence erg cm-2 implies a total energy release erg, similar to GRBs. This would challenge most non-catastrophic progenitor models and suggest that there could be a category of catastrophic FRBs.
However, it should not be overlooked that the claimed detection of D16 is suspiciously located at the edge of the Burst Alert Telescope (BAT)’s field of view. This region, characterized by a low (5%) partial coding, is known to be affected by large noise fluctuations and complex systematic effects, and is generally excluded in standard analyses. For this reason, we performed a re-analysis of the Swift/BAT data presented by D06 and assessed the significance of the putative source Swift J0644.5-5111 with different analysis techniques.
Throughout the paper we use as reference time the radio detection time of FRB 131104, which is 18:03:59 UT on November 4th, 2013 (Ravi et al., 2015).
2 BAT Data Analysis
At the FRB trigger time Swift was pointing toward the location of GRB 130925A (Piro et al., 2014), at R.A., Dec. = 41.105∘, (J2000). Swift slewed to this pre-planned target starting from 171 s, settled at 19 s, and kept observing it until 18:17:57 UT (+14 min). No BAT on-board trigger occurred at or around . For this reason, the typical burst data products, such as the event data with full time and spectral resolution, are not available. However, the BAT produces several other data products all the time, regardless of whether there is a trigger or not. For our search, we used these continuous BAT data, such as the raw light curves data (Sec. 2.1), the survey data (Sec. 2.2) and the scaled map data (Sec. 2.3).
2.1 Raw light curves data
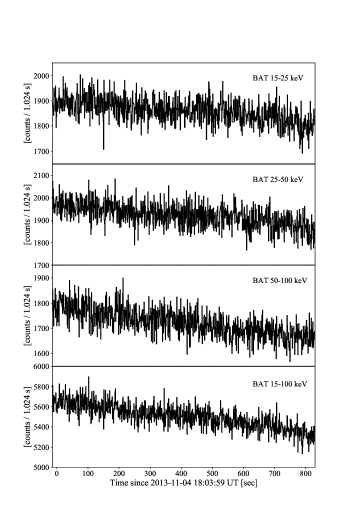
Figure 1 shows the 64 ms and 1.024 s raw (i.e. non-background subtracted) light curves around in the four energy bands (15-25 keV, 25-50 keV, 50-100 keV and 15-100 keV). Each light curve is accumulated over the full array of BAT detectors and has no positional information. Since the distribution of the count rate at the 100-350 keV band shows a systematically larger standard deviation than that of the rest of the light curves, we removed the data of the 100-350 keV band from the search. We searched for excess emission above the background level over the time interval from 19 s to 14 min when FRB 131104 was in the field of view of BAT. The signal-to-noise ratio (SNR) was calculated by scanning the light curve bins using the foreground count in one time bin and the background count in ten time bins prior to the foreground bin. The searched timescales are 64 ms, 128 ms, 512 ms, 1.024 s, 2.048 s, 5.120 s, and 10.24 s. The detection thresholds are set as 3 for 64 ms and 128 ms, 2 for 512 ms, 1.024 s, and 2.048 s, 1 for 5.120 s and 0.05 for 10.24 s timescales. Table 1 summarized the maximum SNR and also calculated false-positive detection applying the number of trial in four different energy bands and seven different time scales. Given the high chance of a false positive detection, we concluded that no significant excess was found between 64 ms and 10 s time scales in the BAT raw light curve data.
2.2 Survey data
BAT survey data are continuously collected during pointed observations. They have typical integration times of 5 minutes and are stored in an 80 energy channel histogram for each detector. These data are used, for example, in the BAT all-sky hard X-ray survey (Markwardt et al., 2007; Tueller et al., 2010; Baumgartner et al., 2013) and also for searching a weak GRB emission prior to and post to the GRB trigger time (Lien et al., 2016). They are particularly useful to investigate a weak and long-lasting transient as they allow for a good characterization of the sky background over the same temporal window.
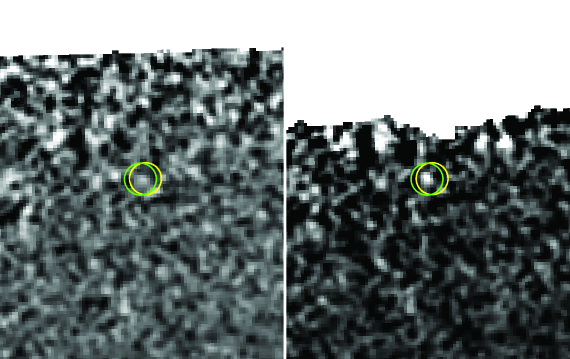
In our case, survey data are available starting from 7 s. We processed them using the standard batsurvey script. As described in the Swift BAT calibration document, SWIFT-BAT-CALDB-CENTROID-v2111http://heasarc.gsfc.nasa.gov/docs/heasarc/caldb/swift/docs/bat/SWIFT-BAT-CALDB-CENTROID-v2.pdf, three types of the aperture masks are included in the BAT calibration database (CALDB). They are the full aperture mask (detection mask), the reduced aperture mask (flux mask) and the difference between the full and the reduced aperture mask (edge mask). Although the ‘detection mask’ is the actual BAT aperture mask, it is usually recommended to use the ‘flux mask’, which excludes the edges of the field of view. This is because fluxes for far off-axis sources are often not accurate and should not be considered in standard analyses. However, in our case, the FRB position is at the edge of the field of view and the ‘detection mask’ should be used to accurately measure the significance of detected sources. The source partial coding fraction using the ‘detection mask’ is only 5.7%. The left panel of figure 2 shows the BAT sky image in the 15-150 keV band between s and s (total integration time of 300s). Furthermore, the Swift BAT team is using the ‘detection mask’ for GRBs located at the partial coding fraction less than 10% in the published three GRB catalog papers (Sakamoto et al., 2008, 2011; Lien et al., 2016). Our work also uses the ’detection mask’ which is the recommended analysis procedure for a source located at a low partial coding fraction.
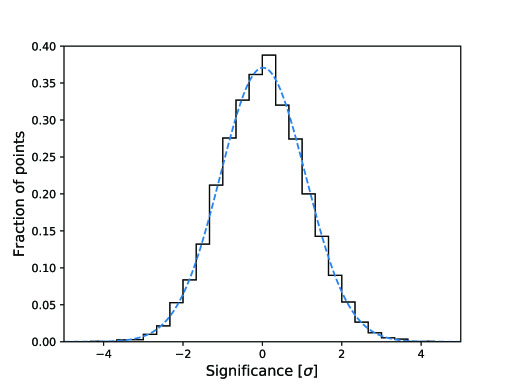
The source significance at the radio222The radio position used in the analysis is (R.A., Dec.) = (101.040, ) (J2000). and the D16 positions is 1.7 and 2.4 , respectively. To quantify the significance directly from the data, we randomly ran the source detection software, batcelldetect, throughout the image and extracted the SNR at random positions. We extracted 8379 random points in the BAT sky image, and the distribution of their significance is shown in Figure 3. Both 1.7 and 2.4 values are well within the noise distribution of the image, and the probability to measure a comparable SNR at a random position is 6.1% and 1.4%, respectively. Therefore, we conclude that the signal is not statistically significant to claim a detection in the BAT survey data.
The fluence upper limit is estimated as follows. From the noise sky map, we derive an average value of 3.2 10-2 counts s-1 at the radio FRB position, which corresponds to a 5 detection threshold of 0.16 counts s-1. Using the task batdrmgen, we then generate an energy response file at the incident angle of the FRB position ( 51∘) and input it into xspec. The rate-to-flux conversion factor is derived assuming a power-law spectral shape with photon index of (the photon index of the claimed D16 source) and (Crab-like spectrum). The resulting 5 fluence upper limits in the 15-150 keV with an integration time of 300 s are 3.3 10-6 erg cm-2 and 2.7 10-6 erg cm-2, respectively. The fluence reported by D16 is 4.0 10-6 erg cm-2 which is at a comparable level of our derived upper limit.
The results of D16 can be reproduced only by processing the survey data using the ‘flux mask’. The right panel of Figure 2 shows the corresponding sky image. In this image the significance of the candidate counterpart is 4.3 , close to what reported in D16. Therefore, it is clear that the main difference between D16 and our analysis is in the selection of the aperture mask, and that the significance of the high energy source sensitively on this particular choice, dropping from 4.3 (with the ‘flux mask’) to 2.4 (with the ‘detection mask’). Based on this fact, we conclude that the statistical significance adopted by D16 overestimates the true SNR of this source, and find no robust evidence to claim a detection of a high-energy counterpart at the FRB position.
2.3 Scaled map data
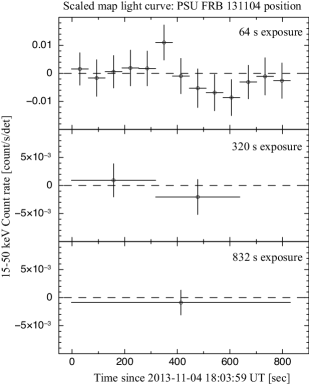
During regular Swift operations, the onboard processor stores detector plane count maps every 64 s in order to enable the discovery of long duration transients (image trigger). The maps are collected in the 15-50 keV energy band, and then scaled relative to a full scale value of 255. These scaled maps can then be convolved with the mask pattern to produce a BAT sky image.
For FRB131104, the scaled map data are available from s to +830 s with integration time of 64 s, 320 s, and a full 832 s exposure. The scaled map data are processed using the standard BAT tools. The scaled map count map is transferred to the sky image using batfftimage specifying the ‘detection mask’ aperture. The generated sky image is cleaned only for the flat fielding using batclean (the balancing option is ‘flight’). Then, the count rate at both the radio and the D16 positions are extracted by batcelldetect. Finally, the extracted count rates are corrected to the on-axis count-rates based on the Crab data (Sakamoto et al., 2016).
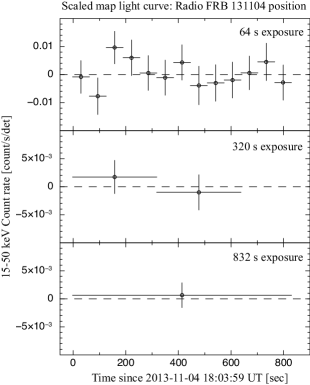
Figure 4 shows the light curves in the 15-50 keV band generated from the scaled map data using the radio and the D16 positions. No significant emission is evident, and the count rate is seen to fluctuate around zero (top panel of figure 4). During the time interval of the putative BAT transient (+318 s and +637 s), the source significance is 0.3 . For comparison, the light curve generated from the same scaled map data presented in D16 (Figure 1 of D16) shows a gradual trend (from high to low) in count rate, which is similar to the background trend seen in the right panel of Figure 1.
In order to improve the sensitivity of our search, we selected a background interval ( s and +318 s) and subtracted the corresponding image to the source image, extracted over the time interval +318 s and +637 s. In this subtracted image the source significance increases to 0.7 , and is therefore not sufficient for a detection.
3 Conclusion and Discussion
We investigated all the available BAT data around the onset of FRB 131104, from the raw light curves to the sky images. No significant emission is seen in the search for both short timescales (64 ms and 1.6 s) based on the light curve analysis and long timescales (64 s up to 5 min) based on the image analysis. Our null result does not confirm the detection of a hard X-ray counterpart for FRB 131104, claimed by D16 using the same BAT data.
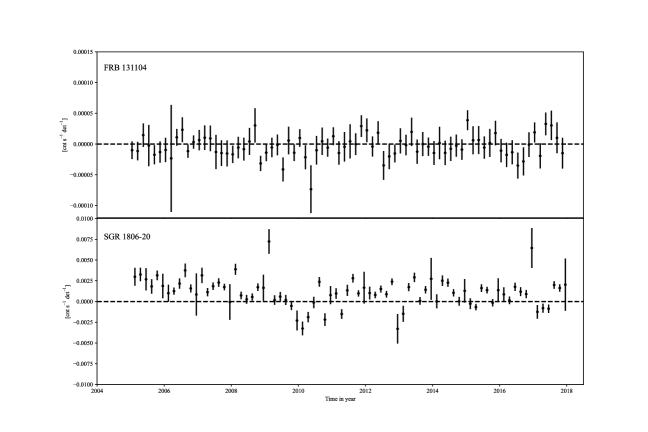
As shown in Figure 5, no significant detection from FRB 131104 is seen by BAT over the last 14 years of its operation. On the other hand, the hard X-ray emission from the Galactic magnetar, SGR 1806-20, is constantly detected by the monthly averaged data of BAT. This demonstrates that long lasting emission from an active magnetar can be seen by BAT and recovered by our analysis. However, such an emission is not evident from FRB 131104.
Recently the FRB-like millisecond radio bursts and the burst in the hard X-ray band were simultaneously detected from the known Galactic magnetar SGR 1935+2154 (Mereghetti et al., 2020). This discovery provides strong support for a magnetar as the origin of at least some fraction of FRBs. Although it is not possible to conduct a detailed search to investigate as a magnetar origin for FRB 131104 because of the limitation of the available data, a recent new capability of downlinking the BAT event data based on an external trigger by a rapid uplink commanding (Tohuvavohu et al., 2020) will enhance to identify such a possibility by the BAT data.
Our result suggests that so far there is no evidence of FRBs associated with catastrophic events such as GRBs. This is consistent with the consensus in the community that the majority of FRBs, if not all, are related to non-catastrophic, repeating sources (e.g. Nicholl et al., 2017; Ravi, 2019; Luo et al., 2020a). The existence of catastrophic events remains possible, but the fraction should be quite small (Zhang, 2020). Continued searches of FRBs in association with catastrophic events (GRBs and compact binary coalescence gravitational wave signals) will progressively tighten the upper limit of the fraction of catastrophic FRBs.
References
- Anumarlapudi et al. (2020) Anumarlapudi, A., Bhalerao, V., Tendulkar, S. P., Balasubramanian, A. 2020, ApJ, 888, 40
- Bannister et al. (2012) Bannister, K. W., Murphy, T., Gaensler, B. M., & Reynolds, J. E. 2012, ApJ, 757, 38
- Bhandari et al. (2020) Bhandari S., Sadler E. M., Prochaska J. X., Simha S., Ryder S. D., Marnoch L., Bannister K. W., et al. 2020, ApJL, 895, L37
- Baumgartner et al. (2013) Baumgartner, W. H., Tueller, J., Markwardt, C. B., et al. 2013, ApJS, 207, 19
- Champion et al. (2016) Champion, D. J., Petroff, E., Kramer, M., et al. 2016, MNRAS, 460, L30
- Chatterjee et al. (2017) Chatterjee, S., Law, C. J., Wharton, R. S., et al. 2017, Nature, 541, 58
- CHIME/FRB Collaboration (2019a) CHIME/FRB Collaboration 2019a, Nature, 566, 235
- CHIME/FRB Collaboration (2019b) CHIME/FRB Collaboration 2019b, ApJ, 885, L24
- Connor et al. (2016a) Connor, L., Lin, H.-H., Masui, K., et al. 2016a, MNRAS, 460, 1054
- Connor et al. (2016b) Connor, L., Sievers, J., & Pen, U.-L. 2016b, MNRAS, 458, L19
- Cordes & Wasserman (2016) Cordes, J. M., & Wasserman, I. 2016, MNRAS, 457, 232
- Cunningham et al. (2019) Cunningham, V., et al. 2019, ApJ, 879, 40
- DeLaunay et al. (2016) DeLaunay, J.J., Fox, D.B., Murase, K., et al. 2016, 832, L1
- Falcke & Rezzolla (2014) Falcke, H., & Rezzolla, L. 2014, A&A, 562, A137
- Gao & Zhang (2017) Gao, H., & Zhang, B. 2017, ApJ, 835, L21
- Guidorzi et al. (2020) Guidorzi, C., Marongiu, M., Martone, R., et al. 2020, A&A, 637, 69
- Katz (2016) Katz, J. I. 2016, ApJ, 826, 226
- Lien et al. (2016) Lien, A., Sakamoto, T., Barthemly, S. D., et al. 2016, ApJS, 829, 7
- Lorimer et al. (2007) Lorimer, D. R., Bailes, M., McLaughlin, M. A., Narkevic, D. J., & Crawford, F. 2007, Science, 318, 777
- Lu et al. (2020a) Lu, W., Piro, A. & Waxman, E. 2020a, MNRAS, 498, 1973
- Lu et al. (2020b) Lu, W., Kumar, P. & Zhang, B. 2020b, MNRAS, 498, 1397
- Luo et al. (2018) Luo, R., Lee, K., Lorimer, D. R., & Zhang, B. 2018, MNRAS, 481, 2320
- Luo et al. (2020a) Luo, R., et al. 2020a, MNRAS, 494, 665
- Luo et al. (2020b) Luo, R., et al. 2020b, Nature, 586, 693
- Lyubarsky (2014) Lyubarsky, Y. 2014, MNRAS, 442, L9
- Markwardt et al. (2007) Markwardt, C. B., Tueller, J., Skinner, G. K., et al. 2005, ApJL, 633, L77
- Martone et al. (2019) Martone, R., Guidorzi, C., Margutti, R., et al. 2019, A&A, 631, 62
- Masui et al. (2015) Masui, K., Lin, H.-H., Sievers, J., et al. 2015, Nature, 528, 523
- Mereghetti et al. (2020) Mereghetti, S., Savchenko, V., Ferrigno, C., et al. 2020, ApJ, 898, L29
- Murase et al. (2017) Murase, K., Mészáros, P., & Fox, D. B. 2017, ApJ, 836, L6
- Nicholl et al. (2017) Nicholl M., et al., 2017, ApJ, 843, 84.
- Palaniswamy et al. (2014) Palaniswamy, D., Wayth, R. B., Trott, C. M., et al. 2014, ApJ, 790, 63
- Palliyaguru et al. (2020) Palliyaguru, N. T., Agarwal, D., Golpayegani, G., et al. 2020, MNRAS, in press
- Petroff et al. (2016) Petroff, E., Barr, E. D., Jameson, A., et al. 2016, PASA, 33, e045
- Piro et al. (2014) Piro, L., Troja, E., Gendre, B., et al. 2014, ApJ, 790, L15
- Popov & Postnov (2013) Popov, S. B., & Postnov, K. A. 2013, arXiv:1307.4924
- Ravi et al. (2015) Ravi, V., Shannon, R. M., & Jameson, A. 2015, ApJ, 799, L5
- Ravi (2019) Ravi, V., 2019, Nat. Astron., 3, 928
- Rowlinson et al. (2020) Rowlinson, A., Starling, R. L. C., Gourdji, K., et al. 2020, arXiv:2008.12657
- Sakamoto et al. (2008) Sakamoto, T., Barthelmy, S. D., Barbier, L., et al. 2008, ApJS, 175, 179
- Sakamoto et al. (2011) Sakamoto, T., Barthelmy, S. D., Baumgartner, W. H., et al. 2011, ApJS, 195, 2
- Sakamoto et al. (2016) Sakamoto, T., Oda, R., Mihara, T., et al. 2016, PASJ, 68 (SP-1), S2 (1-11)
- Scholz et al. (2016) Scholz, P., Spitler, L. G., Hessels, J. W. T., et al. 2016, ApJ, 833, 177
- Shannon & Ravi (2017) Shannon, R. M., & Ravi, V. 2017, ApJ, 837, L22
- Spitler et al. (2016) Spitler, L. G., Scholz, P., Hessels, J. W. T., et al. 2016, Nature, 531, 202
- Sun et al. (2018) Sun, S., Yu, W., Yu, Y., et al. 2018, ApJ, 885, 55
- Thornton et al. (2013) Thornton, D., Stappers, B., Bailes, M., et al. 2013, Science, 341, 53
- Tohuvavohu et al. (2020) Tohuvavohu, A., Kennea, J. A., DeLaunay, J., et al. 2020, ApJ, 900, 35
- Troja et al. (2007) Troja E., Cusumano G., O’Brien P. T., Zhang B., Sbarufatti B., Mangano V., Willingale R., et al., 2007, ApJ, 665, 599
- Tueller et al. (2010) Tueller, J., Baumgartner, W., Markwardt, C. B., et al. 2010, ApJS, 186, 378
- Wang et al. (2016) Wang, J.-S., Yang, Y.-P., Wu, X.-F., et al. 2016, ApJ, 822, L7
- Zhang (2014) Zhang, B. 2014, ApJ, 780, L21
- Zhang (2016) Zhang, B. 2016, ApJ, 827, L31
- Zhang (2017) Zhang, B. 2017, ApJ, 836, L32
- Zhang (2020) Zhang, B. 2020, Nature, 587, 45
| Searched time scale [s] | Maximum SNR & False-positive detection | # of trial | |||
| 15-25 keV | 25-50 keV | 50-100 keV | 15-150 keV | ||
| 0.064 | 3.8 (153.8 s) | 4.2 (383.2 s) | 4.3 (234.8 s) | 4.0 (70.3 s) | 13421 |
| 0.97 | 0.18 | 0.11 | 0.43 | ||
| 0.128 | 3.8 (605.1 s) | 3.6 (539.6 s) | 4.1 (169.1 s) | 4.2 (13.8 s) | 6710 |
| 0.49 | 1.1 | 0.14 | 2.3 | ||
| 0.512 | 3.1 (89.0 s) | 2.9 (280.0 s) | 3.2 (637.4 s) | 3.4 (346.1 s) | 1677 |
| 1.6 | 3.1 | 1.2 | 0.56 | ||
| 1.024 | 2.9 (76.2 s) | 3.3 (187.8 s) | 3.5 (213.4 s) | 3.3 (102.9 s) | 838 |
| 1.6 | 0.41 | 0.19 | 0.4 | ||
| 2.048 | 3.6 (488.9 s) | 3.0 (187.8 s) | 3.9 (212.4 s) | 3.0 (187.8 s) | 419 |
| 0.067 | 0.57 | 0.020 | 0.57 | ||
| 5.120 | 1.7 (525.8 s) | 1.4 (525.8 s) | 0.1 (489.9 s) | 1.3 (525.8 s) | 167 |
| 7.4 | 13 | 76 | 16 | ||
| 10.240 | 0.4 (484.8 s) | 0.1 | 0.1 | 0.1 | 83 |
| 28 | 38 | 38 | 38 | ||