Flux-density measurements of the high-redshift blazar PSO J047.4478+27.2992 at 4.7 and 8.2 GHz with RATAN-600
Abstract
We report the first detection at 4.7 and 8.2 GHz with the RATAN-600 radio telescope of the source PSO J047.4478+27.2992, which has been announced as a blazar at . The average flux densities are and mJy at 4.7 and 8.2 GHz respectively, and an upper limit is estimated as 3 mJy at 11.2 GHz. The light curve at 4.7 GHz, obtained on a time-scale of four months, exhibits moderate variability of the source (fractional variability ). The new RATAN-600 measurements extend previous literature data to higher frequencies, indicating a single power-law radio spectrum with =. The monochromatic radio luminosity at 4.7 GHz W Hz-1 is consistent with values for high-redshift quasars at .
keywords:
galaxies: high-redshift – quasars: general – radio continuum: galaxies – quasars: individual: NVSS J030947+2717571 Introduction
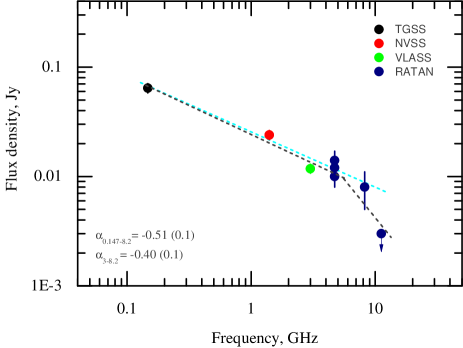
The newly discovered high-redshift blazar PSO J047.4478+27.2992 at , also known as NVSS J030947+271757 and as PSO J030947.49+271757.31 in Belladitta et al. (2020), is the only known blazar at .In this paper, we will refer to the object as PSO J0309+2717. Its redshift was obtained from spectroscopic observations with the Large Binocular Telescope in 2019. The radio, optical, and X-ray photometric and spectroscopic properties discussed in Belladitta et al. (2020) are the basis of the hypothesis that its radio and X-ray emissions are jet dominated. The object was observed in X-rays in the 0.5-10 keV energy band with Swift/XRT, and it appears to be the second most luminous active galactic nucleus (AGN) in X-rays at (Belladitta et al., 2020; Medvedev et al., 2020). It has three measurements in the radio band: mJy at 1.4 GHz (NVSS, Condon et al. 1998), mJy at 147 MHz (TGSS, Intema et al. 2017), and mJy at 3 GHz (VLASS111https://cirada.ca/catalogues, Lacy et al. 2020; Gordon et al. 2020).
Blazars are radio-loud AGNs with their relativistic jets seen at a small angle to the observer’s line of sight (Urry & Padovani, 1995); this is why they can be visible at high redshifts and provide information about the early Universe. However, the fraction of radio-loud quasars decreases with increasing redshift starting from (Momjian et al., 2014). This could be explained by the change in the relative accretion modes and spin magnitude of supermassive black holes (SMBHs) in AGNs (Jiang et al., 2007; Wang et al., 2007; Dotti et al., 2013), because SMBHs need a significant amount of time to form, and this happens in the first yr after the Big Bang (Schneider, 2015). At high redshifts () fewer quasars are expected to be found because they are either not fully formed or have not reached a peak of activity yet; therefore it is hard to detect them (Schmidt et al., 1995; Madau & Dickinson, 2014). The estimated radio-loud fraction of quasars is between 6 and 19 per cent at (Bañados et al., 2015). This fraction argues against the strong evolution of radio-loud quasars with redshift. As an example, there are 106 radio-loud quasars at redshifts in the sky area , with flux densities mJy at 1.4 GHz, and only 11 at (NASA/IPAC Extragalactic Database). There are very few measurements for them in other frequency bands.
Here we present the results of simultaneous RATAN-600 observations of PSO J0309+2717 at three frequencies (4.7, 8.2, and 11.2 GHz) from 2020 May–September. Our goal was to measure the radio continuum spectrum of the object at frequencies higher than 1.4 GHz and evaluate its variability properties in the radio domain.
2 RATAN-600 observations and results
The RATAN-600 radio telescope was used in the transit mode at six frequencies from 1.2 to 22.3 GHz (Parijskij, 1993). The parameters of the antenna and receivers are listed in Table 1 (a detailed description is given in e.g. Mingaliev et al. 2017).
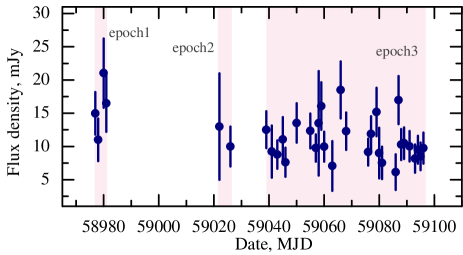
Data reduction and calibration were done using the RATAN standard methods (Aliakberov et al., 1985; Udovitskiy et al., 2016). The observations were spread over 4, 2, and 45-d periods in May, June, and July–September respectively (epoch 1, epoch 2, and epoch 3), for which one-dimensional scans were averaged to increase the detection level. As a result, we obtained flux densities for three observational epochs (Table 2).
The average signal at 4.7 GHz was measured with a signal-to-noise (S/N) level for every epoch, and the flux densities are mJy for epoch 1 and mJy for epoch 3. At the 8.2 GHz frequency a flux density of mJy was measured only for epoch 3 at a level (Table 2). We estimated an upper limit of 3 mJy for the 11.2 GHz flux density.
The total relative rms error of each flux-density measurement is estimated using the relation (Udovitskiy et al., 2016).
| (1) |
where is the total standard flux-density error; the flux density at a frequency ; the standard calibration curve error, which is about 1-2 per cent and 2-5 per cent at 4.7 and 8.2 GHz respectively; the elevation calibration function; the standard error of the antenna temperature measurement; and the antenna temperature.
The uncertainty of the antenna temperature measurement depends on the receiver’s noise, the atmospheric fluctuations, and the accuracy of the antenna surface setting for an actual source observation. The systematic uncertainty of the absolute flux-density scale (3–7 per cent at frequencies of 4.7 and 8.2 GHz) is not included in the total flux error. The range of rms errors of single flux-density measurements is 20–60 per cent for PSO J0309+2717 at 4.7 GHz. The total flux-density errors at 4.7 and 8.2 GHz for averaged scans (see Table 2) are 22 per cent and 37 per cent respectively.
The light curve of PSO J0309+2717 at 4.7 GHz is constructed using measurements with S/N (Fig 1). The variability estimates are of the same order as the measurement uncertainties: the variability index and the fractional variability . We used the following formulas to calculate them:
| (2) |
where and are the maximum and minimum flux densities, and and are their errors (Aller et al., 1992), and
| (3) |
where is the variance, is the mean value of the flux density, and the root mean square error (Vaughan et al., 2003).
The uncertainty of the fractional variability is determined as:
| (4) |
The radio spectrum of the source is shown in Fig. 2 and summarizes the available radio measurements of NVSS, TGSS, VLASS, and RATAN. In the case of the VLASS data, we adopted the flux-density value as stated in the current version of the catalogue, although the authors note that it is likely underestimated by 10 per cent. In the latter case, the 3 GHz data point in the radio spectrum would be slightly higher. Assuming a single power-law distribution for continuum emission, the average radio spectral index was calculated as . If we assume low or moderate variability at 3, 4.7, and 8.2 GHz on a time-scale of 1.5 years (2019 March–2020 September), the spectral index calculated based on the VLASS and RATAN data could be considered as quasi-simultaneous. Considering the upper limit at 11.2 GHz, the spectrum of PSO J0309+2717 steepens at high frequencies ( GHz), and if we fit the spectrum with two linear components, we obtain flat and ultra-steep spectrum parts with and . This indicates that the object can be a compact steep-spectrum (CSS) or a megahertz-peaked-spectrum (MPS) source with a maximum flux density at frequencies less than 0.147 GHz (1 GHz or less in the rest frame).
We estimated the monochromatic radio luminosity at 4.7 GHz W Hz-1. We used the CDM cosmology with km s-1 Mpc-1, =0.3089, and =0.6911 (Planck Collaboration, 2016), and followed the standard formula:
| (5) |
where is the frequency, is the measured flux density, is the redshift, is the spectral index, and is the luminosity distance.
| FWHMRA×Dec. | |||
|---|---|---|---|
| GHz | GHz | mJy/beam | |
| MJD | ||||
|---|---|---|---|---|
| mJy | mJy | |||
| (1) | (2) | (3) | (4) | (5) |
| epoch 1 | 4 | 4 | – | |
| 58977 - | ||||
| 58981 | ||||
| epoch 2 | 2 | 2 | – | |
| 59022, | ||||
| 59026 | ||||
| epoch 3 | 40 | 45 | ||
| 59041 - | ||||
| 59096 |
3 Comparison with other high-redshift blazars
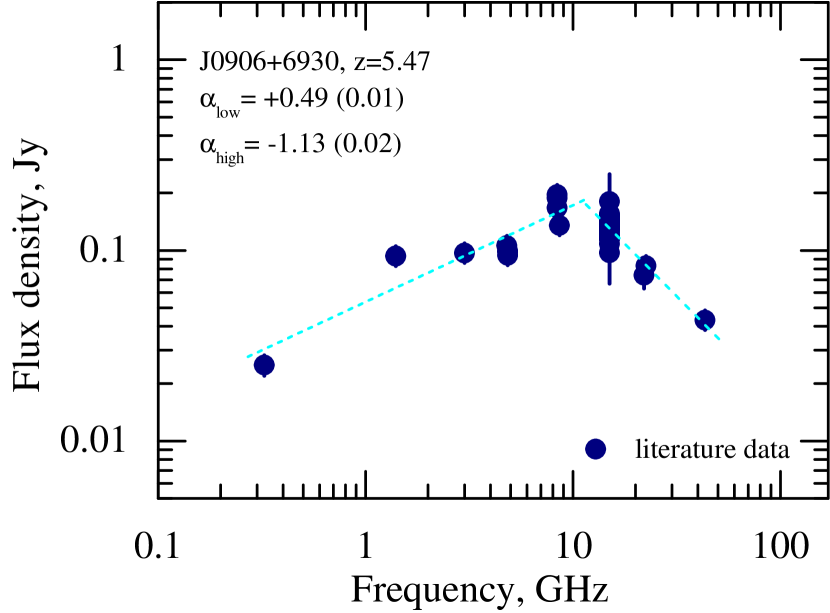
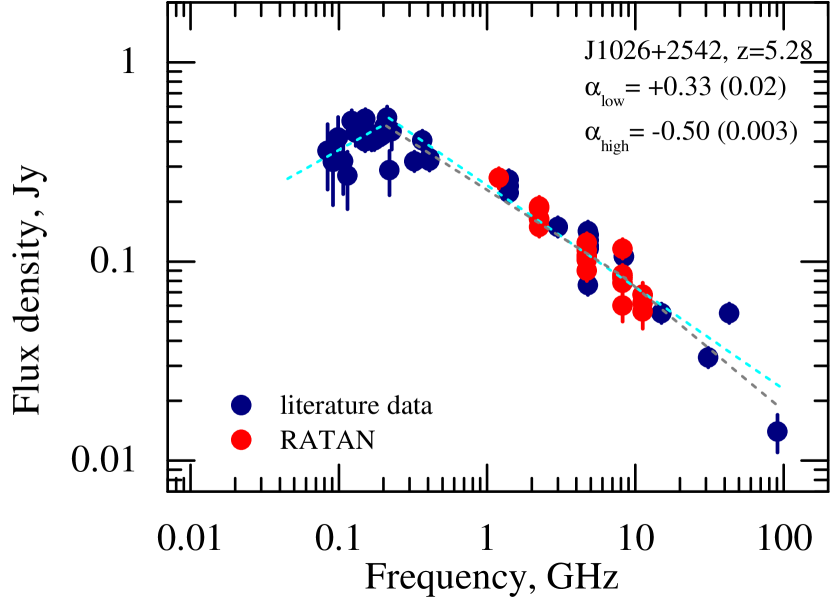
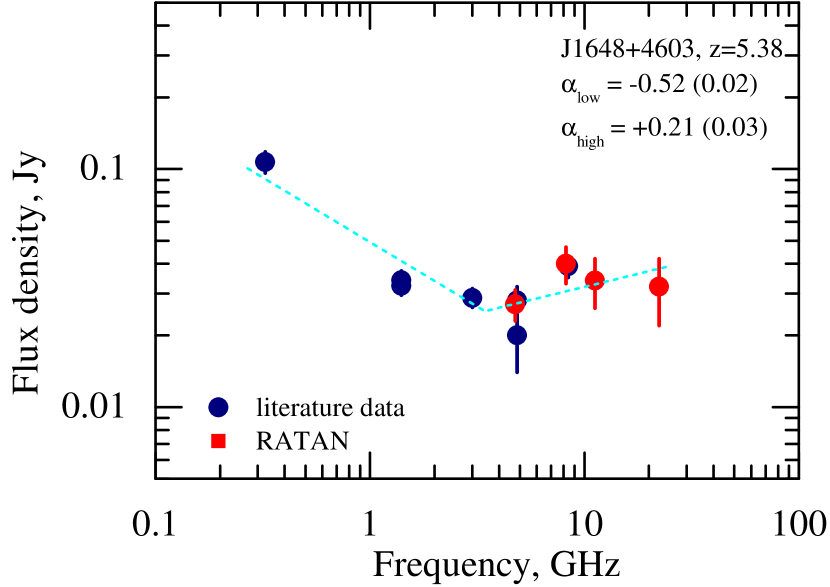
We compared the radio spectrum of PSO J0309+2717 with that of the three currently most distant blazars at . They are BZQ J0906+6930 at =5.47 (Romani et al., 2004), BZQ J1026+2542 at = 5.28 (Sbarrato et al., 2012), and NVSS J164854+460328 (J1648+4603 in what follows) at =5.38 (Caccianiga et al., 2019). The blazars have been classified in the literature based on the common criteria using both radio and X-ray properties, and only for two of them, BZQ J0906+6930 and BZQ J1026+2542, has Doppler boosting been confirmed with VLBI observations that revealed a core–jet structure on parsec scales (Frey et al., 2015; Zhang et al., 2017; Frey et al., 2018; An et al., 2020). Their available radio spectra are presented in Fig 3, where data from CATS222www.sao.ru/cats (Verkhodanov et al., 1997) and other literature data are plotted with blue circles, and RATAN-600 measurements for BZQ J1026+2542 and J1648+4603 are presented as red circles. Their radio properties are listed in Table 3.
The second most distant blazar, BZQ J0906+6930, is a bright radio source with a flux density at 1.4 GHz of 98 mJy at . VLBI observations suggest a less powerful jet compared to blazars in general (An et al., 2020). The peaked radio spectrum has a turnover frequency of GHz in the observer’s frame or GHz in the source rest frame, which makes BZQ J0906+6930 a high-frequency peaking object (HFP) candidate. We calculated the spectral indices as and . Its light curve obtained at 15 GHz with the OVRO 40-m radio telescope demonstrates moderate variability (Zhang et al., 2017). At frequencies of about 4.8 and 8 GHz, the variability index is 0.06 and 0.18 over time-scales of 9 and 10 yr respectively (CATS data base). A small number of radio measurements, covering about 20 yr of observations, and possible variability could mean that the radio spectrum of BZQ J0906+6930 is possibly not a peaked one.
The blazar BZQ J1026+2542 is one of the brightest distant blazars in the radio domain with a flux density of 257 mJy at 1.4 GHz (Condon et al., 1998). Its radio spectrum was obtained from simultaneous measurements at five frequencies from 1.2 to 11.2 GHz with RATAN-600 in the period from 2017 February–2019 August. The flux-density measurements were obtained at 11.2, 8.2, 1.2 GHz with an S/N ratio detection level and with S/N at 4.7, 2.3 GHz (Table 4). During six observing epochs, the blazar was not detected at 22.3 GHz (the upper limit is about 11 mJy), and it was detected at 1.2 GHz only once in 2017 December. The radio spectrum of BZQ J1026+2542 is peaked with the maximum = GHz in the observer frame of reference ( GHz in the source rest frame). The spectral indices below and above the peak frequency are and respectively. At frequencies above 8 GHz its spectrum gets steeper and can be described by two linear parts with and (Fig 3). The spectrum of BZQ J1026+2542 is well determined in the 0.084–91 GHz frequency range, and the measurements cover a period of more than 40 yr (according to the CATS data base). The source demonstrates quite low variability over a time-scale of 13–14 yr: at about 8 GHz based on the VLA measurements in 2003–2006 (Healey et al., 2007) and on the average RATAN-600 fluxes during 2017–2019; the variability index based on the RATAN measurements at 2.3–8.2 GHz is also estimated in the range of . The radio spectrum below the peak is mainly represented by quasi-simultaneous GMRT measurements, which are in good agreement with the other MHz measurements (Douglas et al., 1996; Intema et al., 2017). The peaked spectrum seems to be real for BZQ J1026+2542 since its variability is quite low and is similar to that of the known gigahertz-peaked-spectrum sources (GPS) (Mingaliev et al., 2013; Sotnikova et al., 2019; O’Dea & Saikia, 2020).
The radio spectrum of J1648+4603 can be classified as complex based on the literature data (Gregory & Condon, 1991; Gregory et al., 1996; White et al., 1997; Rengelink et al., 1997; Condon et al., 1998; Myers et al., 2003) and RATAN-600 simultaneous measurements at 4.7, 8.2, and 11.2 GHz, with = and =. Two linear fits give a value of 3.7 GHz for the frequency of the minimum flux density of the spectrum. The flux densities measured with RATAN-600 at 4.7 and 8.2 GHz in 2020 are consistent within the uncertainties with the Green Bank 4.85 GHz measurements in 1986 November and 1987 October and with the VLA 8.4 GHz measurement in 1994–1995 (Gregory et al., 1996; Myers et al., 2003). This suggests the absence of significant flux variations of the source over long time-scales. The spectrum of J1648+4603 can be explained by a sum of two major components. One of them is flat or peaked and can be associated with a parsec-scale jet that dominates at frequencies greater than 5 GHz. The second one is steep at frequencies up to 1 GHz, representing synchrotron radiation of optically thin extended structures up to kiloparsec scales (Kovalev et al., 2002). The spectral shape and variability properties for J1648+4603 are not determined robustly due to the absence of systematic measurements.
As a result, we have found that two of the four currently known most distant blazars have peaked spectra, and one has a complex spectrum with a peaked part at high frequencies. PSO J0309+2717 with a formally flat radio spectrum has a hint to an ultra-steep spectrum at high frequencies if we consider the upper limit at 11.2 GHz. In this case, it is a possible peaked-spectrum source (MPS/CSS) with a turnover frequency 0.147 GHz. BZQ J1026+2542 has a GPS spectrum, based on a sufficient number of data points including simultaneous ones. For BZQ J0906+6930 the peaked type of spectrum is apparently caused by a compilation of scarce data points. Classical GPS sources have a steep or even ultra-steep spectrum in the optically thin emission mode. They are not variable, and their spectral shape and small angular size are explained by young ages. However, the high-frequency research of the Planck Collaboration (2011) has shown that a large fraction of sources having GPS spectra are associated with compact sources with beamed jets, usually with blazars.
We compared the radio luminosities of the aforementioned blazars with those from a sample of quasars (106 sources with 100 mJy at 1.4 GHz in Sotnikova et al., in preparation). The typical radio luminosity for that sample is – W Hz-1, which is consistent with the estimated values for the four most distant blazars. Our calculated monochromatic radio luminosity for BZQ J0906+6930 ( W Hz-1) is almost the same as that of Frey et al. (2018), where W Hz-1 was obtained at frequencies of 2.3 and 8.6 GHz. On average, our derived values of radio luminosity at 4.7 GHz for the four blazars at are typical and in good agreement with those for the sample of distant radio-loud quasars at in Coppejans et al. (2016). The radio luminosity of low-redshift quasars is significantly lower; e.g. Jarvis et al. (2019) reported – W Hz-1 for a sample of obscured quasars.
| Source | Type | |||||||
| GHz | GHz | mJy | W/Hz | |||||
| (1) | (2) | (3) | (4) | (5) | (6) | (7) | (8) | (9) |
| PSO J0309+2717 | 6.10 | – | – | flat | ||||
| BZQ J0906+6930 | 5.47 | peaked | ||||||
| BZQ J1026+2542 | 5.28 | peaked | ||||||
| NVSS J164854+460328 | 5.38 | – | – | complex |
| Source | MJD | ||||||
|---|---|---|---|---|---|---|---|
| J1026+2542 | 57805 | ||||||
| 57837 | |||||||
| 58106 | |||||||
| 58226 | |||||||
| 58320 | |||||||
| 58715 | |||||||
| J1648+4603 | 59068 |
4 Summary
The newly discovered most distant blazar PSO J0309+2717 at a redshift was observed with the RATAN-600 radio telescope at three frequencies simultaneously: 4.7, 8.2, and 11.2 GHz. It was detected at 4.7 GHz with S/N (2020 May–September ) and at 8.2 GHz with S/N (2020 July–September ). The averaged flux-density over three epochs is mJy at 4.7 GHz and mJy at 8.2 GHz. The flux density upper limit at 11.2 GHz is estimated as 3 mJy.
Using the new RATAN-600 measurements along with literature data at 0.147, 1.4, and 3 GHz, we have revealed a flat radio spectrum with =. This result is in good agreement with the previous spectral index estimates from Belladitta et al. (2020) and Spingola et al. (2020). However, if we consider the upper limit at 11.2 GHz, the radio spectrum steepens at higher frequencies (), in the same way as the spectral index of BZQ J1026+2542 steepens from to (Sbarrato et al., 2013).
The light curve at 4.7 GHz obtained on a time-scale of four months exhibits moderate variability with . Future long-term observations at higher frequencies will help us to assess the possible variability of the source.
Comparison of the radio properties of PSO J0309+2717 with other distant blazars has revealed that their radio luminosities are similar at W Hz-1. This value is consistent with radio luminosities for high-redshift quasars at (Sotnikova et al., in preparation) and (Coppejans et al., 2016).
Acknowledgements
We thank the referee for providing useful suggestions and comments that significantly improved the paper.
This work is supported in the framework of the national project “Science” by the Ministry of Science and Higher Education of the Russian Federation under the contract 075-15-2020-778.
The observations were carried out with the RATAN-600 scientific facility.
Observations with RATAN-600 are supported by the Ministry of Science and Higher Education of the Russian Federation.
MM, TM, and VS acknowledge support through the Russian Government Programme of Competitive Growth of Kazan Federal University.
This research has made use of the NASA/IPAC Extragalactic Database (NED), which is operated by the Jet Propulsion Laboratory, California Institute of Technology, under contract with the National Aeronautics and Space Administration.
Data Availability
The data underlying this article are available in the article.
References
- Aliakberov et al. (1985) Aliakberov K. D., Mingaliev M. G., Naugol’Naya M. N., Trushkin S. A., Sharipova L. M., Yusupova S. N., 1985, Bulletin of the Special Astrophysics Observatory, 19, 59
- Aller et al. (1992) Aller M. F., Aller H. D., Hughes P. A., 1992, ApJ, 399, 16
- An et al. (2020) An T., et al., 2020, Nature Communications, 11, 143
- Bañados et al. (2015) Bañados E., et al., 2015, ApJ, 804, 118
- Belladitta et al. (2020) Belladitta S., et al., 2020, A&A, 635, L7
- Caccianiga et al. (2019) Caccianiga A., et al., 2019, MNRAS, 484, 204
- Condon et al. (1998) Condon J. J., Cotton W. D., Greisen E. W., Yin Q. F., Perley R. A., Taylor G. B., Broderick J. J., 1998, AJ, 115, 1693
- Coppejans et al. (2016) Coppejans R., et al., 2016, MNRAS, 463, 3260
- Dotti et al. (2013) Dotti M., Colpi M., Pallini S., Perego A., Volonteri M., 2013, ApJ, 762, 68
- Douglas et al. (1996) Douglas J. N., Bash F. N., Bozyan F. A., Torrence G. W., Wolfe C., 1996, AJ, 111, 1945
- Frey et al. (2015) Frey S., Paragi Z., Fogasy J. O., Gurvits L. I., 2015, MNRAS, 446, 2921
- Frey et al. (2018) Frey S., Titov O., Melnikov A. E., de Vicente P., Shu F., 2018, A&A, 618, A68
- Gordon et al. (2020) Gordon Y. A., et al., 2020, Research Notes of the American Astronomical Society, 4, 175
- Gregory & Condon (1991) Gregory P. C., Condon J. J., 1991, ApJS, 75, 1011
- Gregory et al. (1996) Gregory P. C., Scott W. K., Douglas K., Condon J. J., 1996, ApJS, 103, 427
- Healey et al. (2007) Healey S. E., Romani R. W., Taylor G. B., Sadler E. M., Ricci R., Murphy T., Ulvestad J. S., Winn J. N., 2007, ApJS, 171, 61
- Intema et al. (2017) Intema H. T., Jagannathan P., Mooley K. P., Frail D. A., 2017, A&A, 598, A78
- Jarvis et al. (2019) Jarvis M. E., et al., 2019, MNRAS, 485, 2710
- Jiang et al. (2007) Jiang L., Fan X., Ivezić Ž., Richards G. T., Schneider D. P., Strauss M. A., Kelly B. C., 2007, ApJ, 656, 680
- Kovalev et al. (2002) Kovalev Y. Y., Kovalev Y. A., Nizhelsky N. A., Bogdantsov A. B., 2002, Publ. Astron. Soc. Australia, 19, 83
- Lacy et al. (2020) Lacy M., et al., 2020, PASP, 132, 035001
- Madau & Dickinson (2014) Madau P., Dickinson M., 2014, Annual Review of Astronomy and Astrophysics, 52, 415
- Medvedev et al. (2020) Medvedev P., et al., 2020, MNRAS, 497, 1842
- Mingaliev et al. (2013) Mingaliev M. G., Sotnikova Y. V., Mufakharov T. V., Erkenov A. K., Udovitskiy R. Y., 2013, Astrophysical Bulletin, 68, 262
- Mingaliev et al. (2017) Mingaliev M., et al., 2017, Astronomische Nachrichten, 338, 700
- Momjian et al. (2014) Momjian E., Carilli C. L., Walter F., Venemans B., 2014, AJ, 147, 6
- Myers et al. (2003) Myers S. T., et al., 2003, MNRAS, 341, 1
- O’Dea & Saikia (2020) O’Dea C. P., Saikia D. J., 2020, arXiv e-prints, p. arXiv:2009.02750
- Parijskij (1993) Parijskij Y. N., 1993, IEEE Antennas and Propagation Magazine, 35, 7
- Planck Collaboration (2011) Planck Collaboration 2011, A&A, 536, A14
- Planck Collaboration (2016) Planck Collaboration 2016, A&A, 594, A13
- Rengelink et al. (1997) Rengelink R. B., Tang Y., de Bruyn A. G., Miley G. K., Bremer M. N., Roettgering H. J. A., Bremer M. A. R., 1997, A&AS, 124, 259
- Romani et al. (2004) Romani R. W., Sowards-Emmerd D., Greenhill L., Michelson P., 2004, ApJ, 610, L9
- Sbarrato et al. (2012) Sbarrato T., et al., 2012, MNRAS, 426, L91
- Sbarrato et al. (2013) Sbarrato T., et al., 2013, ApJ, 777, 147
- Schmidt et al. (1995) Schmidt M., Schneider D. P., Gunn J. E., 1995, AJ, 110, 68
- Schneider (2015) Schneider P., 2015, Extragalactic Astronomy and Cosmology: An Introduction, 2 edn. Springer-Verlag Berlin Heidelberg, doi:10.1007/978-3-642-54083-7
- Sotnikova et al. (2019) Sotnikova Y. V., Mufakharov T. V., Majorova E. K., Mingaliev M. G., Udovitskii R. Y., Bursov N. N., Semenova T. A., 2019, Astrophysical Bulletin, 74, 348
- Spingola et al. (2020) Spingola C., Dallacasa D., Belladitta S., Caccianiga A., Giroletti M., Moretti A., Orienti M., 2020, A&A, 643, L12
- Udovitskiy et al. (2016) Udovitskiy R. Y., Sotnikova Y. V., Mingaliev M. G., Tsybulev P. G., Zhekanis G. V., Nizhelskij N. A., 2016, Astrophysical Bulletin, 71, 496
- Urry & Padovani (1995) Urry C. M., Padovani P., 1995, PASP, 107, 803
- Vaughan et al. (2003) Vaughan S., Edelson R., Warwick R. S., Uttley P., 2003, MNRAS, 345, 1271
- Verkhodanov et al. (1997) Verkhodanov O. V., Trushkin S. A., Andernach H., Chernenkov V. N., 1997, in Hunt G., Payne H., eds, Astronomical Society of the Pacific Conference Series Vol. 125, Astronomical Data Analysis Software and Systems VI. p. 322 (arXiv:astro-ph/9610262)
- Wang et al. (2007) Wang R., et al., 2007, AJ, 134, 617
- White et al. (1997) White R. L., Becker R. H., Helfand D. J., Gregg M. D., 1997, ApJ, 475, 479
- Zhang et al. (2017) Zhang Y., et al., 2017, MNRAS, 468, 69