Quantum confined Rydberg excitons in Cu2O nanoparticles
Abstract
The quantum confinement of Rydberg excitons is an important step towards exploiting their large nonlinearities for quantum applications. We observe Rydberg excitons in natural nanoparticles of Cu2O. We resolve up to the principal quantum number in a bulk Cu2O crystal and up to in nanoparticles extracted from the same crystal. The exciton transitions in nanoparticles are broadened and their oscillator strengths decrease as compared to those in the bulk (decreasing as ). We explain our results by including the effect of quantum confinement of exciton states in the nanoparticles. Our results provide an understanding of the physics of Cu2O Rydberg excitons in confined dimensions.
I Introduction
Solid-state quantum systems provide unprecedented capabilities for the realization of novel devices owing to their robustness, miniaturization capability and scalability Keyes (1988); Awschalom et al. (2013); Devoret and Schoelkopf (2013); Loredo et al. (2016); Mak and Shan (2016); Gonzalez-Zalba (2018). The operation of such devices requires developing means to efficiently produce, control and detect strongly interacting particles. Excitons, elementary excitations in semiconductors consisting of a Coulomb-bound pair of an electron and a hole, are considered major candidates towards this direction. An exciton represents a solid-state analog of the hydrogen atom and hence excited states can be observed as a hydrogen-like discrete series at energies below the bandgap, with the Rydberg energy and the principal quantum number Fox (2011). Excitons in cuprous oxide (Cu2O) were observed as early as 1952 Hayashi and Katsuki (1952), and their various physical properties have been studied since then Meyer et al. (2013). However only energy levels up to in Cu2O were observed for many decades until the Rydberg spectrum was extended to in 1996 Matsumoto et al. (1996).
Among semiconductors, Cu2O has the advantage of a large Rydberg energy which allows access to much higher excited states. In a recent high-resolution laser absorption study Kazimierczuk et al. (2014), it was shown that Cu2O hosts Rydberg excitons up to . This demonstration opened the portal to the field of giant Rydberg excitons in solid-state Thewes et al. (2015); Grünwald et al. (2016); Heckötter et al. (2017a, b); Takahata and Naka (2018); Krüger and Scheel (2018); Lynch et al. (2018); Mund et al. (2019); Zielińska-Raczyńska et al. (2019), in close analogy with their highly excited counterparts in atomic Physics Jones et al. (2017). Owing to their giant microscopic dimensions (up to ) leading to the onset of exciton blockade, Rydberg excitons in Cu2O exhibit enhanced optical nonlinearities at much smaller densities compared with other traditional semiconductors Kazimierczuk et al. (2014); Walther et al. (2018). These nonlinearities can be harnessed by quantum confinement of the excitons in semiconductor low-dimensional structures such as quantum wells and quantum dots Konzelmann et al. (2020). Studying these excitons in confined dimensions is a crucial step towards harnessing these nonlinearities for applications. Nanoparticles Smith and Nie (2010) are naturally a suitable system for quantum confinement and an interesting platform for realising quantum technologies with Rydberg excitons, potentially underpinning future devices such as single-photon sourcesKhazali et al. (2017) and single-photon switchesBaur et al. (2014).
In this work, we report the observation of Rydberg excitons in nanoparticles of Cu2O. We resolve the yellow -exciton states in natural nanoparticles up to , while we observe up to in the bulk crystal that the particles were extracted from. We show that the reduction of the crystal structure from bulk to nanoparticles leads to broadened linewidths and an apparent reduction of the oscillator strength of the excitonic peaks compared to that in the bulk. We describe both effects by the quantum confinement of the Rydberg states and the size distribution of our nanoparticles. Our results are the first demonstration of the effect of quantum confinement in linewidth and oscillator strength of Rydberg excitons.
II Experimental Methods
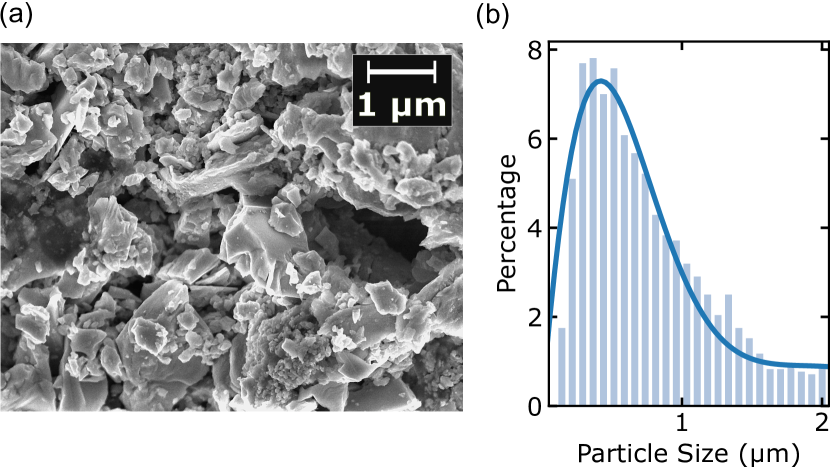
Cu2O nanoparticles were extracted from the residual powder from polishing a natural crystal mined in Tsumeb, Namibia. After forming a suspension of Cu2O powder in water, a droplet of this suspension is deposited onto a CaF2 substrate. Scanning electron microscopy (SEM) reveals that Cu2O particles tend to aggregate and form a thin layer due to Van der Waals forces as the particles redistribute during water evaporation [Fig. 1(a)]. The particles are of various sizes and shapes with a average and median diameter size of and nm [Fig. 1(b)]. We refer to these particles as natural nanoparticles (NNPs). Nanoparticles are compared to a thin slab of natural bulk crystal that is cut and mechanically polished down to a thickness of .
We perform broadband transmission spectroscopy (see Supplementary Information 1 for setup). The excitation source is a green-yellow light-emitting diode (LED) with a center wavelength of (Thorlabs MINTF4). The resulting signal is collected, dispersed and analyzed in a spectrometer (Andor Shamrock 750) coupled to a CCD camera. For transmission spectroscopy, an objective lens (20 Mitutoyo Plan Apo, NA = 0.42) focuses the excitation light to a spot on our sample (100 m diameter) and a second objective lens (same NA as excitation) collimates the transmitted light before it enters the spectrometer. The sample is maintained at using a liquid-helium flow cryostat. We use CaF2 substrates because of their excellent thermal conductivity at cryogenic temperatures and transparency in the visible spectrum.
III Experimental results
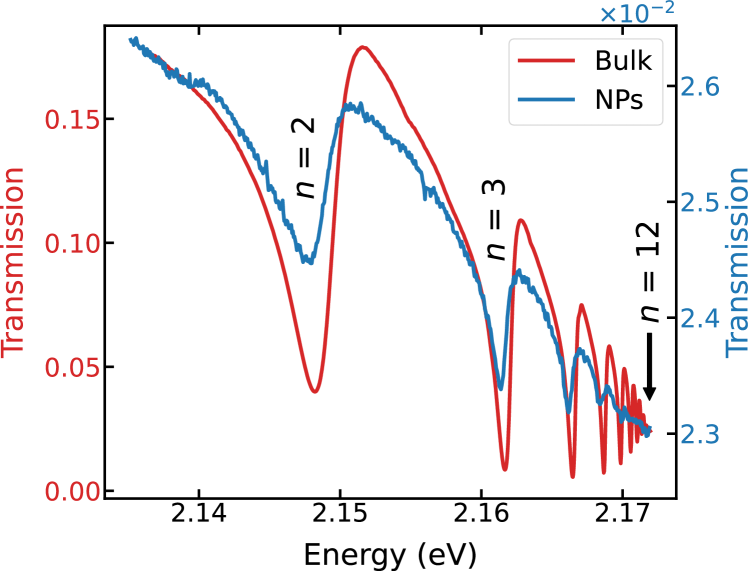
The transmission spectrum of the bulk crystal reveals a series of absorption lines corresponding to the excited states of Rydberg excitons in Cu2O [red line in Fig. 2(b)]. These states are labelled by their principal quantum number, . We can reliably identify Rydberg states up to overlaid on a continuous phonon background Baumeister (1961); Jolk and Klingshirn (1998). The reduced number of exciton lines observed in our experiment compared to previous works Kazimierczuk et al. (2014) is primarily attributed to the small diameter and broadband spectrum of our excitation source. The asymmetric lineshape stems from the Fano interference between the discrete excitonic states and the absorption background originating from phonon-assisted absorption of the 1 exciton Toyozawa (1964). By fitting the exciton resonance energies to the Rydberg formula, we extract the bandgap energy and the Rydberg energy , which agree with those reported in the literature Agekyan et al. (1974); Matsumoto et al. (1996).
The transmission spectra of the nanoparticles covering a large area (100 m diameter) on the substrate show clear exciton peaks [blue line in Fig. 2(b)]. Exciton resonances are evident as discrete asymmetric dips on top of the phonon background. A noticeable difference between the spectra of clusters and that of the thinned bulk crystal is that, in the former, is the sharp decrease in the peak absorption of the excitons as increase, such that we can only resolve resonances up to .
Repeating the measurements on synthetic nanoparticles (SNPs) of comparable sizes can show if the reduced number of observed excitonic resonances in NNPs could be due to the polishing procedure. The transmission spectrum for SNPs, exhibits the same number of resonances as the one for NNPs (see Supplementary Information 2). Therefore, we rule out polishing as the reason for the observation of the reduced number of transitions. We note that resonances with the same are slightly blueshifted in the bulk crystal compared to those in nanoparticles due to a small temperature variation in each experiment (see Supplementary Fig. 3).
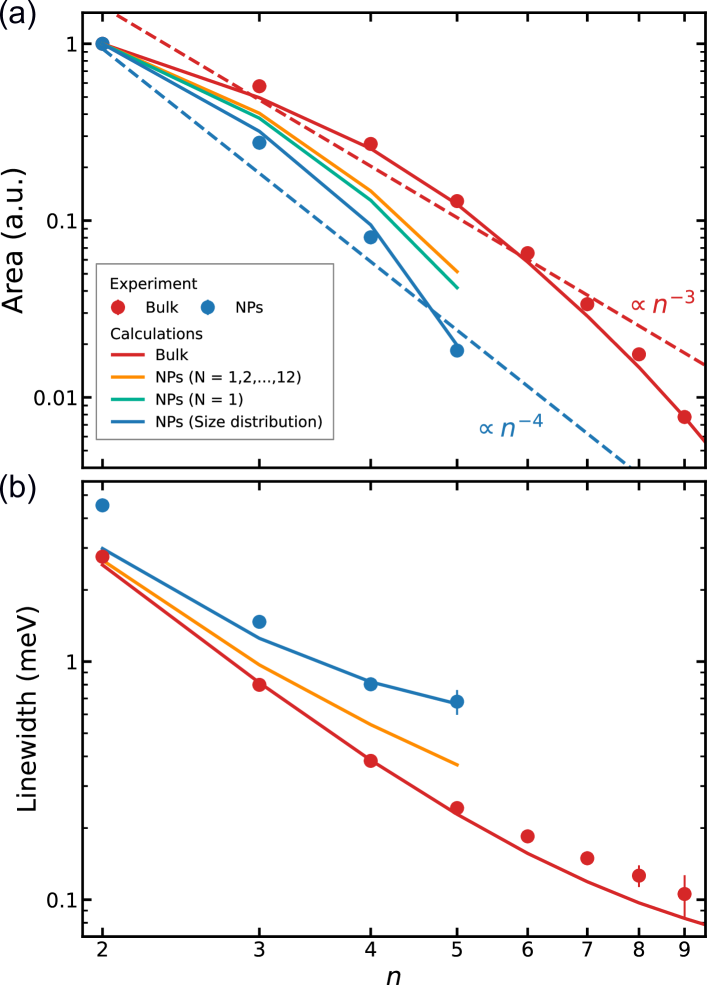
The comparison of oscillator strength (peak area) of the excitons in bulk and NPs shows (see Fig. 3a) that the relative peak area of excitons in nanoparticles of Cu2O decreases as compared to that in the bulk (decreasing as , which is the theoretical dependence). Individual peaks were fitted with an asymmetric Lorentzian Kazimierczuk et al. (2014) to extract their linewidth. The linewidth of NPs is approximately double the linewidth of the bulk thin crystal for the first three observed resonances. The broadening is more pronounced for as the linewidth increases by nearly three folds for NPs (Fig. 3b).
Previously, the broadening of excitons in nanoparticles of CuCl ( diameter) was found to be due to quantum confinement and size distribution Ekimov et al. (1985, 1986). Here, we show that quantum confinement results in the broadening of the transitions in a similar process, however, due to the narrow linewidth of the transitions the effect is visible for larger nanoparticle sizes.
IV Theoretical description
From the point of view of the classification of low-dimensional semiconductor structures, the considered nano-crystals are quantum dots (QDs). The SEM images (Fig. 1) suggest that the best model shape is a spherical quantum dot, with a median diameter of 700 nm. Assuming that the interaction between dots is small enough, we may consider interband transitions in an isolated QD, and then average the results over a size distribution of QDs. As it has been shown previouslyZiemkiewicz et al. (2020), the optical properties of QDs can be studied with the real density matrix approach (RDMA). In this method, the optical response (absorption, reflection, transmission) is obtained by solving a set of equations for the excitonic amplitude and electric field vector of the wave propagating in the nanostructure. The quantities are the coordinates of the electron and the hole, and R is the center-of-mass coordinate of the electron-hole pair. The basic equations of RDMA have the form Ziemkiewicz et al. (2020)
| (1) |
where is a phenomenological damping coefficient, is a smeared-out transition dipole density, is the fundamental gap, and is the relative electron-hole distance. The operator stands for the two-band effective mass Hamiltonian, which includes the electron and hole kinetic energy, the electron-hole interaction potential and the confinement potentials. In consequence, the Hamiltonian is given by
| (2) |
where the second and the third terms on the r.h.s. are the electron and the hole kinetic energy operators with appropriate effective masses, the fourth term is the electron-hole attraction, and the two last terms are the surface confinement potentials for the electron and hole. The total polarization of the medium is related to the coherent amplitude by
| (3) |
This, in turn, is used in Maxwell’s field equation
| (4) |
where =7.5 is the QD material dielectric constant. Equations (1)-(4) form a system of coupled integro-differential equations in 6-dimensional configuration space The optical properties of spherical QDs can be described by means of the exciton center-of-mass (COM) quantization methodZiemkiewicz et al. (2020). One assumes that the COM is confined within a sphere of radius , which will give the confinement states. Those states will overlap with the 3-dimensional exciton states. The effective QD susceptibility in this limit is given by the formula (see supplementary information)
| (5) | |||
where are the spherical Bessel functions (), are roots of the equation , , nm is the Rydberg radius and are energies of excitonic levels.
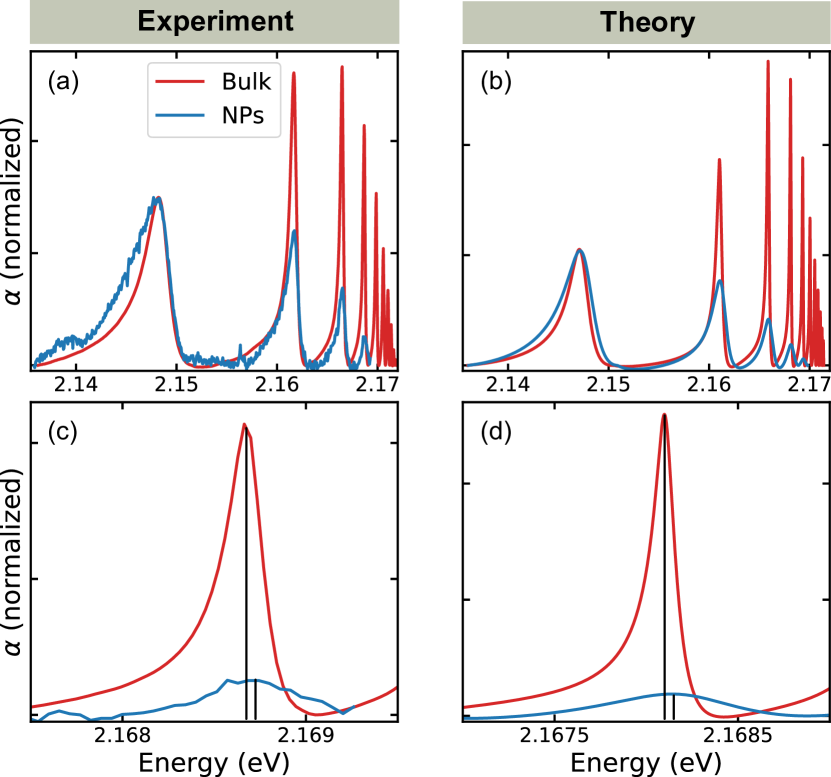
Fig. 4 shows a comparison of experimental and calculated absorption spectra. The bulk crystal spectrum is also calculated from Eq. (IV) by taking a very large NP radius . Due to the relatively large size of considered NPs and the corresponding confinement energy shifts on the order of , the direct observation of them can be challenging. To get a clearer picture of the results, the absorption coefficient obtained for bulk and nanoparticle systems has been normalized and the NP spectrum was shifted to obtain an exact match of lines, removing the influence of different experimental conditions such as temperature mentioned before. In such a case, we observe a difference of between bulk and NP lines for state (vertical lines on Fig. 4 (c) and (d)), both in the experimental spectra and calculation results. This amounts to the difference between confinement energy of and state, the latter one being negligible. This result is a close match to the theoretical predictions of Konzelmann et al. Konzelmann et al. (2020).
Our calculations show an excellent match between the measured oscillator strength and the theoretical estimates when the size distribution of the nanoparticles in considered [blue line in Fig. 3(a)]. The calculation for single NP size (=350 nm) fails to fully explain the oscillator strength reduction [orange line in Fig. 3(a)], further confirming that quantum dot size distribution is crucial to the understanding of the observed effects. Moreover, upper confinement states () contribute to 23% of the peak area for , with a smaller effect for . The calculated linewidths match the experimental data for , while slightly underestimating the linewidth of state [blue line in Fig. 3(b)]. Again, we find that it is crucial to take into account the size distribution of the NPs, further evidencing the effect of NP size.
V Discussion
Previous studies Kazimierczuk et al. (2014) have shown that the power-dependent optical bleaching (reduction of peak area) only becomes visible for for a pump intensity of 1 mW/mm2. Moreover, the intensity required to see optical bleaching scales as . Therefore, to notice any nonlinearities at one needs laser power on the order of 1 W/mm2. The intensity of the illuminating light in our experiment ( mW/mm2) is sufficiently low that the nonlinear effects observed in bulk can be neglected for the observed excitonic states. We note that in nanoparticles, the blockade diameter can become comparable to particle size for low (see Supplementary Fig. S4). The intensities in our experiment, however, are 3 orders of magnitude weaker than that required to reach the blockade effect.
The reduction in oscillator strength due to damage to crystal structure can be ruled out since we observe this reduction in natural as well as synthetic NPs (see Supplementary Information 2). Strain on Cu2O crystals can cause a change in the absorption strength due to change from isotropic to anisotropic states Agekyan (1977). The substrates can exert stress on Cu2O crystals and affect the exciton transitions especially if the crystal is glued onto the cold finger or strongly sandwiched between two substrates. However, the nanoparticles here are held in place only by the van der Waals forces.
Electron-hole plasma generated due to the incident broadband light can affect the excitons. The collision of excitons with electron-hole plasma results in the reduction of exciton lifetime, broadening of the transitions as well as reducing the exciton oscillator strength. However, this effect was observed Heckötter et al. (2018) to be significant only for levels higher than .
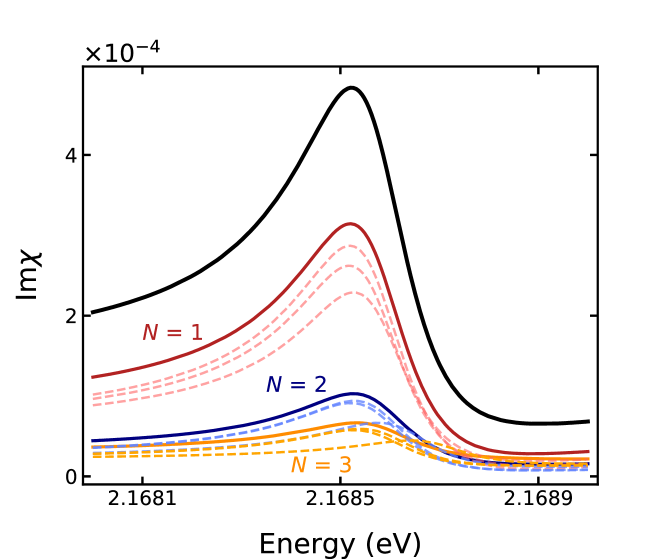
The quantum confinement, however, is the dominant effect here. Theoretically, for excitons in Cu2O three dimensional confinement to diameter, the lowest confinement state (=1) would exhibit a blueshift of Konzelmann et al. (2020), which is an order of magnitude smaller than the linewidth of the transition. However, the states provide a non-trivial contribution to the total area of the observed excitonic line, which is a measure of oscillator strength. This is shown on the Fig. 5, where states are marked by red, blue and green lines respectively. Since the energy shift of those states is proportional to , it can reach values of over for . Moreover, for the given dot radius , the energy shift is approximately proportional to and a relatively large energy shift on the order of can be expected at the lower end of the obtained NP sizes. This is clearly seen in Fig. 5, where strongly blueshifted peaks corresponding to small NPs are visible. All these factors contribute to the shape of the total line (black curve) and result in an apparent reduction of the oscillator strength; every observed excitonic line is an overlap of the primary confinement state () and multiple blueshifted higher states which are too close to each other to discern them on the spectrum. The contribution of these states is twofold. 1- They make the transitions more symmetric. Since they have higher energy than the state, their effect is more pronounced on the right-hand side of the absorption peak; this is visible in Fig. 4(c) and (d) where the asymmetric lineshape of the bulk crystal is transformed into Gaussian shape. The effect is also visible for lower states [Fig. 4(a) and (b)], but it is much less pronounced due to smaller energy shifts. 2- They significantly increase the background absorption. Since the oscillator strength of confinement states quickly decreases with , their contribution affects mostly the base of the absorption line. The widened bases overlap, forming a strong absorptive background. This greatly reduces the area of the peak visible above that background resulting in an apparent reduction of the oscillator strengths.
In conclusion, we successfully observed Rydberg excitons in nanoparticles of Cu2O. Through optical spectroscopy, we showed that reducing the size of the system leads to a subsequent reduction in the oscillator strength and an apparent linewidth broadening. We explained our observations through the quantum confinement of the excitons in the nanoparticles. Our work paves the way for exploiting Cu2O Rydberg excitons in the nanoscale for their large nonlinearities.
acknowledgements
We acknowledge EPSRC Grant No. EP/S014403/1 and The Royal Society RGS\R2\192174. K.O. acknowledges EPSRC for PhD studentship support through grant no. EP/L015110/1. We thank Michael Huang, Matthew Jones, Stephen Lynch, Stefan Scheel and Mikhail M. Glazov for fruitful discussions.
References
- Keyes (1988) R. W. Keyes, IBM Journal of Research and Development 32, 84 (1988).
- Awschalom et al. (2013) D. D. Awschalom, L. C. Bassett, A. S. Dzurak, E. L. Hu, and J. R. Petta, Science 339, 1174 (2013).
- Devoret and Schoelkopf (2013) M. H. Devoret and R. J. Schoelkopf, Science 339, 1169 (2013).
- Loredo et al. (2016) J. C. Loredo, N. A. Zakaria, N. Somaschi, C. Anton, L. de Santis, V. Giesz, T. Grange, M. A. Broome, O. Gazzano, G. Coppola, I. Sagnes, A. Lemaitre, A. Auffeves, P. Senellart, M. P. Almeida, and A. G. White, Optica 3, 433 (2016).
- Mak and Shan (2016) K. F. Mak and J. Shan, Nature Photonics 10, 216 (2016).
- Gonzalez-Zalba (2018) M. F. Gonzalez-Zalba, arXiv:1801.06722 [cond-mat] (2018), arXiv: 1801.06722.
- Fox (2011) M. Fox, Optical properties of solids, 2nd ed., Oxford master series in condensed matter physics No. 3 (Oxford Univ. Press, Oxford, 2011) oCLC: 772954632.
- Hayashi and Katsuki (1952) M. Hayashi and K. Katsuki, Journal of the Physical Society of Japan 7, 599 (1952).
- Meyer et al. (2013) B. K. Meyer, A. Polity, D. Reppin, M. Becker, P. Hering, B. Kramm, P. J. Klar, T. Sander, C. Reindl, C. Heiliger, M. Heinemann, C. Müller, and C. Ronning, Oxide Semiconductors, edited by B. G. Svensson, S. J. Pearton, and C. Jagadish, Semiconductors and Semimetals, Vol. 88 (Elsevier, 2013) pp. 201 – 226.
- Matsumoto et al. (1996) H. Matsumoto, K. Saito, M. Hasuo, S. Kono, and N. Nagasawa, Solid. Stat. Comm. 97, 5 (1996).
- Kazimierczuk et al. (2014) T. Kazimierczuk, D. Fröhlich, S. Scheel, H. Stolz, and M. Bayer, Nature 514, 343 (2014).
- Thewes et al. (2015) J. Thewes, J. Heckötter, T. Kazimierczuk, M. Aßmann, D. Fröhlich, M. Bayer, M. Semina, and M. Glazov, Physical Review Letters 115, 027402 (2015).
- Grünwald et al. (2016) P. Grünwald, M. Aßmann, J. Heckötter, D. Fröhlich, M. Bayer, H. Stolz, and S. Scheel, Physical Review Letters 117, 133003 (2016).
- Heckötter et al. (2017a) J. Heckötter, M. Freitag, D. Fröhlich, M. Aßmann, M. Bayer, M. A. Semina, and M. M. Glazov, Physical Review B 96, 125142 (2017a).
- Heckötter et al. (2017b) J. Heckötter, M. Freitag, D. Fröhlich, M. Aßmann, M. Bayer, M. A. Semina, and M. M. Glazov, Physical Review B 95, 035210 (2017b).
- Takahata and Naka (2018) M. Takahata and N. Naka, Physical Review B 98, 195205 (2018).
- Krüger and Scheel (2018) S. O. Krüger and S. Scheel, Physical Review B 97, 205208 (2018).
- Lynch et al. (2018) S. A. Lynch, C. Hodges, W. W. Langbein, L. Gallagher, J. Rogers, C. S. Adams, M. P. A. Jones, and R. P. Singh, in 2018 20th International Conference on Transparent Optical Networks (ICTON) (IEEE, Bucharest, 2018) pp. 1–4.
- Mund et al. (2019) J. Mund, C. Uihlein, D. Fröhlich, D. R. Yakovlev, and M. Bayer, Physical Review B 99, 195204 (2019).
- Zielińska-Raczyńska et al. (2019) S. Zielińska-Raczyńska, G. Czajkowski, K. Karpiński, and D. Ziemkiewicz, Physical Review B 99, 245206 (2019).
- Jones et al. (2017) M. P. A. Jones, L. G. Marcassa, and J. P. Shaffer, Journal of Physics B: Atomic, Molecular and Optical Physics 50, 060202 (2017).
- Walther et al. (2018) V. Walther, R. Johne, and T. Pohl, Nature Communications 9, 1309 (2018).
- Konzelmann et al. (2020) A. Konzelmann, B. Frank, and H. Giessen, Journal of Physics B: Atomic, Molecular and Optical Physics 53, 024001 (2020).
- Smith and Nie (2010) A. M. Smith and S. Nie, Accounts of Chemical Research 43, 190 (2010).
- Khazali et al. (2017) M. Khazali, K. Heshami, and C. Simon, Journal of Physics B: Atomic, Molecular and Optical Physics 50, 215301 (2017).
- Baur et al. (2014) S. Baur, D. Tiarks, G. Rempe, and S. Dürr, Physical Review Letters 112, 073901 (2014).
- Baumeister (1961) P. W. Baumeister, Physical Review 121, 359 (1961).
- Jolk and Klingshirn (1998) A. Jolk and C. F. Klingshirn, physica status solidi (b) 206, 841 (1998).
- Toyozawa (1964) Y. Toyozawa, Journal of Physics and Chemistry of Solids 25, 59 (1964).
- Agekyan et al. (1974) V. T. Agekyan, B. S. Monozon, and I. P. Shiryapov, physica status solidi (b) 66, 359 (1974).
- Ekimov et al. (1985) A. Ekimov, A. Onushchenko, A. Plyukhin, and A. L. Efros, Journal of Experimental and Theoretical Physics 61, 891 (1985).
- Ekimov et al. (1986) A. Ekimov, A. Onushchenko, M. Raikh, and A. L. Efros, J. Exp. Theor. Phys. 63, 1054 (1986).
- Ziemkiewicz et al. (2020) D. Ziemkiewicz, K. Karpiński, S. Zielińska-Raczyńska, and G. Czajkowski, Physical Review B 101, 205202 (2020).
- Agekyan (1977) V. T. Agekyan, physica status solidi (a) 43, 11 (1977).
- Heckötter et al. (2018) J. Heckötter, M. Freitag, D. Fröhlich, M. Aßmann, M. Bayer, P. Grünwald, F. Schöne, D. Semkat, H. Stolz, and S. Scheel, Physical Review Letters 121, 097401 (2018).