]sj-spencer.github.io
Inflationary stimulated Raman scattering in shock-ignition plasmas
Abstract
In the shock-ignition inertial confinement fusion scheme, high-intensity lasers propagate through an inhomogeneous coronal plasma, driving a shock designed to cause fuel ignition. During the high-intensity ignitor laser pulse, in the long scale-length coronal plasma, back-scattered stimulated Raman scattering (SRS) is likely to be in the kinetic regime. In this work, we use one-dimensional particle-in-cell simulations to show that there is a non-linear frequency shift caused by kinetic effects, resulting in the growth of SRS in an inhomogeneous plasma far exceeding the predictions of fluid theory, so-called inflationary SRS or iSRS. We find that iSRS occurs over a wide range of density scale-lengths relevant to shock-ignition and other directly-driven inertial confinement fusion schemes. The presence of iSRS in shock-ignition plasmas has implications for the theoretical gains from shock-ignition inertial confinement fusion. Here we quantify the intensity threshold for the onset of iSRS for shock-ignition relevant parameters.
I Introduction
Shock-ignition (SI) [1, 2] is a direct-drive [3] inertial confinement fusion (ICF) scheme where the fuel assembly and ignition stages of the implosion are decoupled using a characteristic laser pulse shape. In the first stage a low-intensity ( ) pulse is used to ablate the outer layer of the target, creating a long density scale-length coronal plasma and compressing the fuel. In the second stage, high-intensity ( ) beams are used to launch a strong shock into the target, which in turn leads to a non-isobaric pressure profile. In a successful experiment, when the pressure peaks at the centre, ignition occurs. In the ignition stage of the pulse, the average laser intensity on target is above the threshold for laser-plasma instabilities (LPI) [4], such as stimulated Raman scattering (SRS)[5], stimulated Brillouin scattering (SBS)[5], and two-plasmon decay (TPD)[6].
One laser-plasma instability of major concern[7] to shock-ignition is stimulated Raman scattering, a three-wave parametric instability that transfers energy from the laser to an electron plasma wave (EPW) and a scattered light wave [5]. SRS is only possible in plasma regions where the following matching conditions can be satisfied: , , where the subscripts refer to the incident laser, electron plasma wave, and scattered light wave, respectively. The production of scattered light by SRS is deleterious to the SI scheme as it diverts laser energy away from the target and reduces laser-illumination uniformity. The effect of SRS-generated electron plasma waves on shock-ignition is less well understood, as it depends on the specific waves which are amplified. As the SRS EPWs Landau damp, they transfer energy to electrons with velocities . Of these suprathermal electrons, those with energies less than are predicted to stop behind the converging shock, and could act to augment the ignition shock [8]. Electrons with energies greater than are likely to deposit their energy ahead of the shock and pre-heat the target, making it more difficult to compress [9]. For this reason, it is important to understand the energy distribution of suprathermal electrons produced by SRS in shock-ignition scenarios.
Previous simulation studies of stimulated Raman scattering in shock-ignition have identified dominant SRS growth at and , where it grows as an absolute instability[10, 11]. SRS has also been observed at densities such that it grows as a weakly kinetic convective instability; characterised by the condition that[12]: . Furthermore, some studies have shown the presence of SRS in the strongly kinetic limit (), where it occurs by kinetic inflation [13, 9], as explained below.
SRS which occurs via kinetic inflation (from here on referred to as inflationary SRS, or iSRS) has been studied extensively in the low-density homogeneous plasmas relevant to indirect-drive ICF on the NIF [14, 15, 16, 17, 18, 19, 20]. In attempting to explain experimental measurements of large SRS-reflectivities at high values of [21, 22], it was suggested that some mechanism caused a reduction in the Landau damping rate by four to five times, compared to the damping for a Maxwellian plasma [22]. Anomalously large SRS-reflectivities were recreated in simulations [23, 14], and were explained by reference to O’Neil’s 1965 model of reduced EPW damping caused by electron-trapping[24]. In homogeneous plasmas, iSRS occurs when an SRS EPW grows to a point where it can trap electrons for one complete bounce period or longer, without them becoming de-trapped due to velocity-space diffusion or side-loss[14]. This trapped electron population leads to modification of the distribution function, in the form of a locally flattened region around the EPW phase velocity. This translates to a modification of the dielectric properties of the plasma, resulting in a reduction in the EPW’s associated Landau damping rate [24, 14], and increased SRS growth.
Key results of previous studies of inflationary SRS in homogeneous plasmas include: a theory for the saturation of iSRS in terms of EPW bowing and the trapped-particle modulation instability [18]; the derivation of an inflation threshold intensity in terms of competition between trapping in the EPW and diffusion in velocity space [16]; and the description of iSRS in terms of a transition from convective to absolute growth [25]. Inflationary SRS has also been identified as an important mechanism in simulations with ensembles of laser speckles [19, 26].
In the large-scale inhomogeneous plasmas associated with shock-ignition () the mechanism and effects of inflationary SRS have, so far, received little attention. The few papers which do refer to iSRS in SI inhomogeneous plasmas assume that the explanation of iSRS in a homogeneous plasma in terms of reduced Landau damping also applies to iSRS in an inhomogeneous plasma. However, iSRS in an inhomogeneous plasma actually happens by a different mechanism. In the case of a homogeneous plasma, reduced Landau damping due to electron-trapping in the EPW leads to an increase of the SRS growth rate which, if sufficiently large, can cause a transition from convective to absolute growth [25]. For an inhomogeneous plasma, where the growth of SRS is always convective, the reduction in Landau damping associated with trapping in the EPW has no net effect on the convective gain. While the local SRS growth rate may depend on the EPW damping rate in an inhomogeneous plasma, the region of SRS convective growth is also extended, leading to a net Rosenbluth gain[27] which is independent of Landau damping [28, 29]. We therefore look to another non-linear effect caused by the trapped electrons in the SRS EPW, the non-linear frequency shift[30]. In an inhomogeneous plasma, the frequency shift resulting from electron-trapping can compensate for the wave-number mismatch on propagating up the density gradient, thereby allowing growth over a larger region - an auto-resonance [31, 32]. Chapman et al. (2012) [32], proposed this theory for iSRS in an inhomogeneous plasma close to the hohlraum wall in indirect-drive ICF. They demonstrated the auto-resonant interaction[31] between the non-linear frequency shift associated with electron-trapping in EPW and the wave-number mismatch caused by plasma inhomogeneity; which allows larger SRS gain[32].
Inflationary SRS has been suggested as the cause of SRS from low densities in simulations of LPI in shock ignition [33]. Sub-scale shock-ignition experiments have detected SRS scattered light from densities , where the inflationary mechanism should be important [12]. Recent full-scale (, ) directly-driven experiments have detected significant SRS-reflected light from densities [34]. Another full-scale (, ) SI experiment measured SRS-reflected light from densities between . Under the conditions of the experiment, ranges from and the measured SRS is assumed to be inflationary in origin [35]. For a single laser speckle in an inhomogeneous plasma with density scale-length , Riconda et al. (2011) [13] demonstrated that iSRS was associated with electron-trapping in the EPW. By varying from 0.03 to 0.06, i.e. an increase in laser intensity from to , they showed a transition to iSRS.
The primary aim of this study is to identify shock-ignition plasma parameters where iSRS may occur. This information will guide future studies examining the longer term consequences of iSRS growth, such as its saturation mechanisms or interaction with other instabilities, which will require more detailed and computationally expensive modelling. Here we show that inflationary SRS can occur in inhomogeneous plasmas with density scale-lengths , such as expected for shock-ignition coronal plasmas, and at shock-ignition laser intensities and plasma temperatures. We demonstrate that iSRS in these simulations is characterised by electron-trapping, frequency shift of the EPW and the appearance of beam-acoustic modes (BAM). Through a set of parameter studies we estimate the transition threshold for iSRS at different density scale-lengths and densities. These simulations are all restricted to 1D to determine where iSRS can occur in isolation from other effects. We also comment on the possible risk to SI from inflationary SRS and approaches to maximise the benefit of the hot-electron production.
The outline of this paper is as follows: Section II describes the code used and the choice of initial conditions. In Section III we demonstrate how one may detect the presence of iSRS in PIC simulations of shock-ignition plasmas. Section IV describes how the iSRS behaviour changes with the density scale-length of the coronal plasma. We also characterise the hot-electron populations, and comment on their potential impact on the ignition shock. Section V summarises our results.
II Code and initial conditions
Simulations are performed using the particle-in-cell (PIC) code EPOCH [36], which solves Maxwell’s equations on a fixed grid and self-consistently moves particles under the Lorentz force law. The initial plasma conditions span a range of SI-relevant parameters. The simulation parameters are chosen to achieve our primary aim of identifying plasma parameters where iSRS may occur, which does not require large simulations of the entire LPI system.
The simulations all used a domain size of and ran to with 2048 particles per cell (PPC) for the electron species. We treat the ions as a neutralising background population since we simulate only a two pico-second interval of SRS development, during which ion dynamics will not become important [37]. For the plasma parameters laid out above, electron-ion collisions occur on a characteristic timescale of approximately at the highest density probed, . Since the inflationary Raman process we are investigating takes place on a sub-picosecond timescale, we do not include collisions in our simulations. The plasma density profiles are given by the expression and can be seen in Table 1.
We simulate a frequency-tripled Nd:glass laser with vacuum wavelength , polarised in the -direction. The laser intensity was varied in 20 logarithmically evenly-spaced increments between and , with a half-Gaussian temporal profile followed by a flat top, and a rise-time of 50 laser periods. We use absorbing boundaries for the fields and thermal for the particles; these replace any particle leaving the simulation with an incoming particle with velocity consistent with a Maxwellian plasma based on the initial temperature of .
| 300 | 0.15 | ||
|---|---|---|---|
| 500 | 0.12 | ||
| 500 | 0.15 | ||
| 500 | 0.20 | ||
| 1000 | 0.15 |
EPOCH uses a pseudorandom number generator (PRNG) to generate the initial particle distribution. Each simulation was repeated 10 times with a different PRNG seed, allowing us to determine the sensitivity of SRS to plasma fluctuations. This allowed us to calculate both the mean and standard deviation of the intensity of the light scattered through SRS.
SRS amplifies fluctuations in the plasma, and so is sensitive to number of particles per cell used in the simulation, as can be seen in Figure 1. In this figure, the intensity of SRS back-scattered light (denoted in this paper by ) is plotted against the incoming laser intensity ranging between for a homogeneous plasma with , for different numbers of particles per cell. At low incident intensity, is inversely proportional to the number of PPC used. This is as we would expect for the case of simple convective amplification [27] of the product of two quantities () which vary as background PIC noise, which is proportional to . The upper saturated level of is robust to the number of PPC for . The transition between these two levels represents the change from standard convective amplification of SRS to enhanced growth of SRS due to trapping (inflationary SRS), hence we call this the inflation threshold. The existence of an inflation threshold is also robust to the number of particles per cell for .
In the region containing the inflation threshold, the error associated with the intensity of SRS scattered light is largest. This suggests that inflationary SRS is very sensitive to the initial distribution of particles in the simulation domain, and that a statistical analysis of the mean and standard deviation of intensity across different random seeds will be important if we are to determine the iSRS threshold intensity accurately.
III Signatures of iSRS in inhomogeneous plasmas
Three signatures of inflationary SRS observed in the literature for homogeneous plasmas are: a threshold intensity past which scattering of laser light is enhanced above the level predicted by fluid theory [16]; electron-trapping in the SRS EPWs leading to local flattening of the distribution function at the EPW phase velocity [14]; and the growth of down-shifted SRS EPWs and a continuum of beam-acoustic modes (BAMs) [15]. In what follows we show that all of these signatures are also present for iSRS in an inhomogeneous plasma, despite the instability arising through an auto-resonance rather than a transition from convective to absolute growth.
We consider first the existence of a threshold intensity past which SRS growth is enhanced, by several orders of magnitude, above the predictions of fluid theory; this has been seen in experiments [38] and simulations [14, 15, 16, 13]. In order to identify kinetic inflation of the SRS scattered light intensity in our PIC simulations, we use a simple fluid model to calculate and compare the intensity of SRS scattered light in the absence of kinetic effects.
According to fluid theory, the growth of a parametrically unstable mode in an inhomogeneous plasma is limited by the loss of resonance between the waves as they propagate through the plasma and experience wave-number shift [27]. We can formulate this inhomogeneous growth in terms of the Rosenbluth gain exponent[27]
| (1) |
where is the growth rate of the equivalent mode in a homogeneous plasma, are the group speeds of the scattered EM wave/EPW and is the -derivative of the wave-number mismatch . The maximum intensity reached by a parametrically unstable wave which has grown from noise at point is then given by the expression . In order to calculate the intensity of scattered light due to SRS, we substitute for using the electromagnetic and Bohm-Gross dispersion relations in one dimension, to get:
| (2) |
Substituting this back into with the growth rate for backward SRS in a homogeneous plasma[39],
| (3) |
gives an appropriate Rosenbluth gain exponent for calculating convective amplification of back-scattered SRS light in our simulations.
We make several simplifying assumptions that allow us to estimate the maximal scattered light intensity at a point in our simulation domain. Firstly, we neglect the dependence of the scattered light velocity on space, and consider it to be fixed at . This means that we slightly over-estimate the amount of scattered light which is able to reach the point in time . We also assume that the laser achieves its maximum intensity starting at rather than ramping up, as it does in the simulations. We neglect collisional damping of the scattered EM waves and assume that the noise source is homogeneous in the domain. Finally, we assume that the amplification described by the Rosenbluth gain exponent occurs locally and instantaneously at the point of perfect matching , rather than across the resonance region defined by . For all the simulations presented in this paper . The scattered light intensity is then given by
| (4) |
The prefactor ensures that if , such that there is no growth, then the back-scattered signal remains at the the noise intensity. The steady-state intensity of SRS scattered light measured at the laser-entry boundary is then given by .
The red circular markers in Figure 2 show the results of applying this method to the case of a density scale-length plasma, with the density profile centred at , for incident laser intensities ranging from . The blue triangular markers show the intensity of SRS scattered light calculated from the equivalent kinetic EPOCH simulations. The relationship between the kinetic and fluid results changes as the incident laser intensity increases. At low intensities the fluid and kinetic models are well matched, but not identical, suggesting that there is always some kinetic element to the SRS behaviour in these simulations. Continuing this analysis to intensities (well below those relevant to shock-ignition) shows that the two methods converge for low intensities, where the behaviour is purely fluid. Once the incident laser intensity exceeds , the intensity of SRS scattered light measured in the kinetic simulations exceeds the fluid prediction by between one and three orders of magnitude, until the intensity reaches , where it appears to saturate. In the fluid model, is a smooth function of incident laser intensity and we cannot define such a threshold intensity. This implies that kinetic effects in our simulations are responsible for the increase in and that we have observed iSRS. The fluid estimate shows no sign of saturating at high intensities, since the Rosenbluth gain formula used is based on unbounded linear SRS growth over the resonance region and the model does not include pump depletion.
By constructing plots such as these, which show the fully kinetic PIC results alongside results from our simple fluid model, we are able to identify the iSRS threshold as the point past which the kinetic and fluid models differ by at least one order of magnitude.
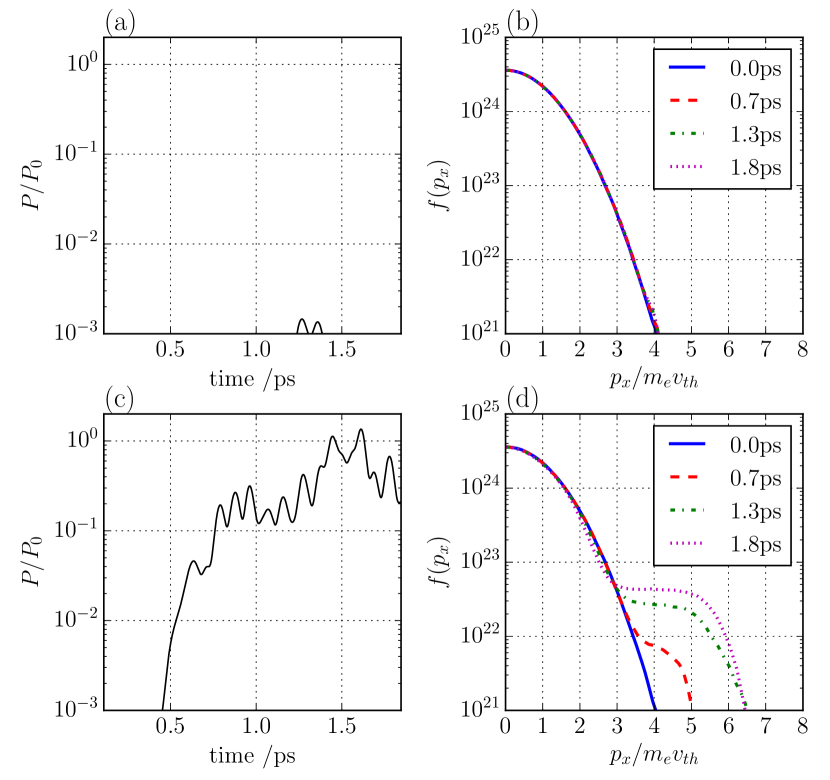
A second signature of iSRS, as reported in the literature for homogeneous plasmas, is electron-trapping in the SRS electron plasma waves, leading to a non-linear frequency shift and enhanced SRS-reflectivies at large [14]. A typical manifestation of this, for our inhomogeneous simulations, is shown in Figure 3. Figure 3 shows the instantaneous SRS-reflectivity measured at the left boundary of the simulation domain (a,c), alongside the box-averaged electron distribution function at four times (b,d), for two simulations with laser intensities above and below the iSRS threshold. Sub-figures 3 (a,b) show that, when driven below threshold, the distribution of electron momenta is Maxwellian throughout the simulation, and that the maximum instantaneous power in SRS-reflected light is consequently very low (). In sub-figures (c,d), where the incident laser intensity is well above the iSRS threshold, we see that the power in SRS-reflected light is correlated with the growth of a non-Maxwellian tail in the distribution function, corresponding to an electron population trapped in the SRS electron plasma waves. There is a general trend of increasing SRS-reflected light that correlates with the increasing trapped electron population.
Throughout the simulation presented in Figure 3, the SRS- reflectivity exhibits a ‘bursty’ behaviour on the sub-picosecond timescale, even though the distribution function appears to vary smoothly as a function of time. In Figure 3, the distribution functions have been averaged over the entire simulation domain, but upon inspection of Figure 4 (c) we can see that growth of iSRS EPWs has spatial dependence. Averaging the distribution over the whole domain potentially masks the localised effects responsible for the bursty behaviour, the period of which has been shown in Winjum et al. (2010) [40] to depend on the local trapping-induced non-linear frequency shift.
Electron-trapping in the SRS-driven EPW causes a time-dependent non-linear frequency shift of the EPWs [30, 38], and the growth of a sequence of beam-acoustic modes [15]; this is the third signature of iSRS.
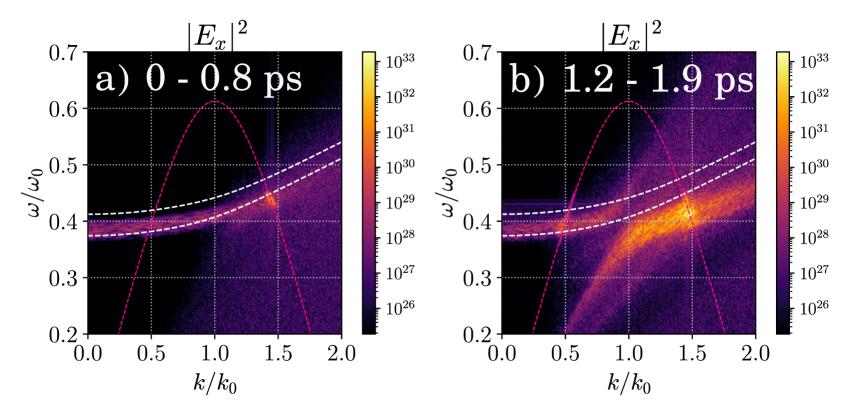
Figure 4 shows the spatially resolved frequency spectra of EPWs (a,c) and EMWs (b,d) at 0-0.7ps (a,b) and 1.5-1.9ps (c,d). In panels (a,b), the signal maxima sit very close to the white dashed line, which represents the frequencies predicted by the SRS matching-conditions for the original Maxwellian plasma. This means that, at early time, the SRS EPWs and their associated back-scattered light waves are excited at the frequencies matching those of the linear theory without trapping. They are slightly down-shifted from the analytical prediction, which suggests that the trapping becomes important almost immediately in our simulations. At later time, Figure 4 (c) shows that the EPW spectrum is down-shifted in frequency at every location in the simulation domain, including to frequencies below the plasma frequency for the original Maxwellian plasma (orange solid line). This is evidence of a large trapped particle population removing energy from the wave, causing the frequency of the wave to decrease such that energy is conserved [30]. We also note that in Figure 4 (d) the back-scattered light spectrum is up-shifted in frequency space, so as to maintain frequency matching. As well as obvious up-shift of the electromagnetic spectrum, we can also see more general broadening as we move from Figure 4 (b) to (d). This could be caused by waves from a higher density propagating to smaller , so that at a particular location the spectrum covers waves from a range of densities.
Further evidence for a large trapped particle population can be seen in the growth of a beam acoustic mode in the electrostatic spectrum. Figure 5 shows the electrostatic dispersion relation from a simulation; it is calculated by taking a 2D Fourier transform of the field over the entire spatial domain, and over two distinct time intervals. At early time, shown in Figure 5 (a), electron plasma waves are excited, from background noise, between the two white dashed curves. These represent the Bohm-Gross dispersion relations for the highest density in the domain (top line) and the lowest density (bottom line). According to fluid theory, SRS will grow where the Stokes branch, defined by , intersects with this dispersion curve. This fluid-SRS signal can be seen in Figure 5 (a).
The right hand panel of Figure 5 shows the EPW dispersion relation calculated from the simulation between . Inspection of the distribution function in Figure 3 shows that, at these times, the distribution function is modified from the initial Maxwellian and has a large flattened region, which acts as an effective beam population [15]. According to linear theory, this change in the distribution function changes the kinetic dispersion relation for the electrostatic waves in the system, defined by: . This change in the dielectric properties of the plasma is realised in the spectrum as a continuum of beam acoustic modes [15], this is the large spectral feature in the right hand panel of Figure 5 that sits strictly below the Bohm-Gross dispersion curves. These beam acoustic modes are frequency downshifted, recovering the result from Morales and O’Neil’s non-linear analysis[30]. The maximum of the BAM signal at is the intersection of the BAM with the Stokes branch, the new location of SRS growth.
We can also see in Figure 5 (b) a signal at which sits on the intersection of the Stokes branch with the range of EPWs satisfying the Bohm-Gross dispersion relations. This represents forward-scattered SRS EPWs, which have not undergone a significant frequency shift. For all the simulations presented in this paper, when driven above threshold, the power in forward SRS scattered light is of the order or lower, and is therefore energetically unimportant.
IV Intensity threshold and hot electron scaling
Using the method developed in Section III for locating the inflation threshold, and the analysis of electron trapping and downshifted EPWs to ensure that the SRS observed is inflationary in origin, we investigate how iSRS depends on various plasma parameters relevant to shock-ignition. Using the PIC simulation set-up as in Section II (with the same simulation domains, plasma densities, and temperatures), we varied the plasma density scale-length across the range of values predicted for shock-ignition [8]. As well as varying the density scale-length, we also centred the density profiles at different values of density. Figure 6 shows the result of this parameter scan.
From Figure 6 (a) we see that as the density scale-length of the SI coronal plasma decreases, the intensity threshold for iSRS increases. Vu et al. (2007) [16] derived a condition for the kinetic inflation threshold of SRS in a homogeneous plasma. They showed that the magnitude of the trapped electron potential energy in the EPW must be greater than or equal to the energy gained by a particle in one complete trapped orbit due to velocity diffusion in the background plasma fluctuations. This ensures that trapping remains for at least one bounce period.
No such analytic threshold has been derived for an inhomogeneous plasma. However, when is smaller the inhomogenous gain is smaller and the amplitude reached by convective amplification of the SRS EPW is lower for the same intensity. Hence SRS in a shorter density scale length plasma is less likely to generate EPWs with sufficient amplitude for electron trapping effects to trigger the transition to iSRS.
Figure 6 (b) shows the measured intensity of SRS scattered light in three sets of simulations with density profiles centred at , chosen so that the density ranges do not overlap (see Table 1). As the central density decreases, the intensity threshold for iSRS increases. As for the case of varying scale-lengths changing the threshold, this can be explained in terms of the Rosenbluth gain[27]. For a fixed density scale-length, as the density decreases, the Rosenbluth gain exponent also decreases. This means that the fluid gain through convective SRS is reduced. Hence SRS at a low density is less likely than that at higher density to generate EPWs with sufficient amplitude for electron trapping effects to trigger the transition to iSRS. For the parameters of Figure 7 (b) with , the Rosenbluth gain exponent increases from to as the densities increase.
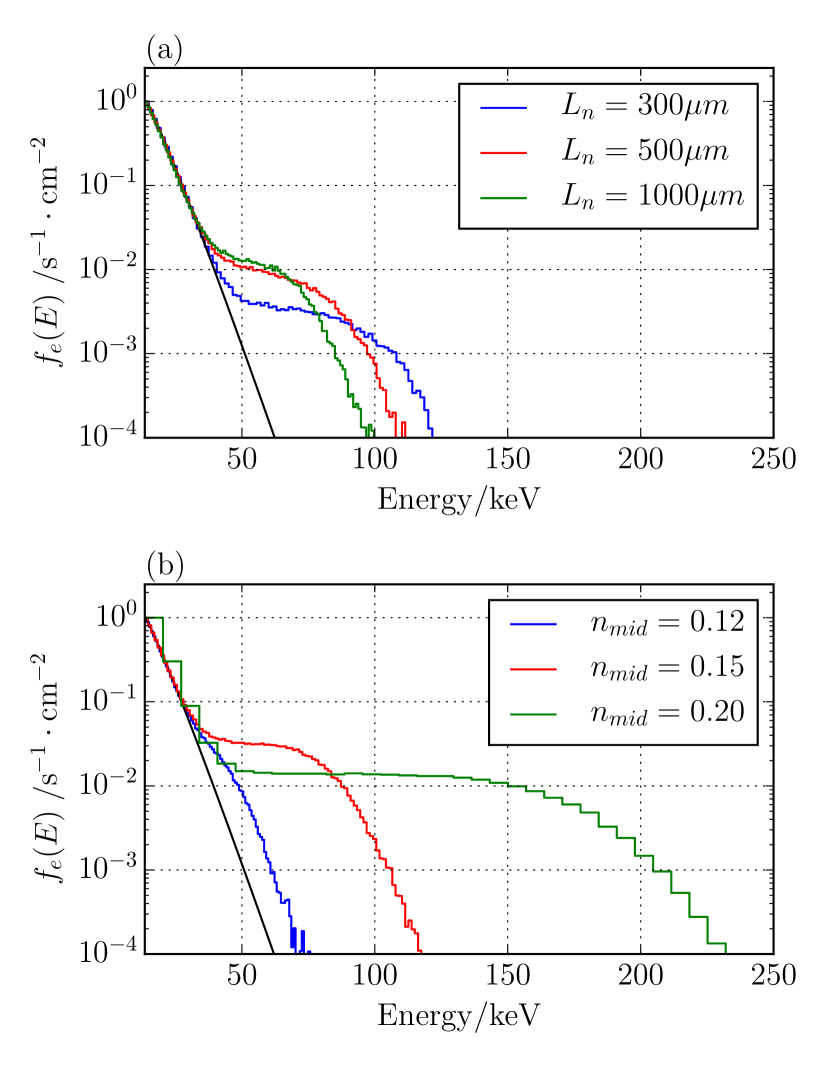
As well as understanding how the density scale-length of the plasma and the density at which iSRS is driven affects the iSRS threshold, we would like to understand how these factors affect the hot electron population. We consider three simulations from Figure 6 (a) with , and three from Figure 6 (b), with . Figures 7 (a,b) show the hot electron population in these simulations, in the form of histograms for the electron flux through the right boundary.
Figure 7 (a) shows the electron distribution function resulting from iSRS for three density scale-lengths. These are for a laser intensity above the onset threshold for iSRS but below an intensity which would lead to saturation. All results are for the same central density. The most prominant difference is that the peak electron energy increases with decreasing density scale-length. This results from the fact that the shorter density scale-length simulation access a higher peak density since the simulation domain size is the same for all three cases. The SRS matching conditions for these higher densities result in a higher phase speed of driven EPWs. Solving the SRS matching conditions for these densities, we find that the hot-electron energies calculated from the phase velocities are between for all three cases.
Figure 7 (b), however, shows a clear dependence of the hot electrons from iSRS on density. As the density increases the maximum hot- electron kinetic energy also increases in line with the increase in SRS EPW phase velocities. Over the 2ps of the simulations the fraction of incident laser energy converted into hot-electrons with are: 0, , and for the densities. For the density scale-lengths the fractions of incident laser energy converted into hot- electrons are: and respectively.
V Conclusion
Inflationary SRS has been detected in PIC simulations of a inhomogeneous plasmas with parameters relevant to the shock-ignition model of ICF. This study demonstrates an iSRS threshold across the whole range of parameters tested and that the location of this threshold depends on the density scale-length . For the case with and significant iSRS would occur at generating hot-electrons with mostly energies and depleting the laser drive available at higher densities. This is potentially beneficial to shock-ignition in that these electrons are likely to enhance the ignitor shock and prevent significant SRS at higher densities, potentially absolute at . SRS at higher densities is likely to generate electron distributions with a higher percentage of electrons than that from iSRS at lower densities. These results suggest that a potential route to use iSRS to the advantage of shock-ignition, assuming all SRS cannot be removed by other means, would be for the shock ignitor pulse to have the largest possible amplitude. This would ensure significant iSRS at lower densities and generate only hot-electrons with energies below . This in turn would pump deplete the laser reducing SRS at higher densities which could generate hot-electrons with energy above . These conclusions are however only valid for the restricted 1D, collisionless simulations presented in this paper and more detailed simulations, as outlined below, would be needed to fully assess the hot-electron distribution and its impact on SI schemes.
The simulations presented in this paper highlight the importance of a thorough investigation of iSRS for any shock-ignition plans. These results are however a first study of the plasmas parameters where iSRS may occur. A full theoretical investigation of the potential impact of iSRS on shock-ignition will require significantly larger scale simulations. Of particular importance are multi-dimensional effects and laser speckle profiles. These would allow the competition between SRS and TPD as sources of hot-electrons to be assessed in two and three dimensions. The transverse non-uniformity associated with multi-dimensional effects is likely to affect iSRS through trapped electron side losses and a broader spectrum of EPWs resulting from side-scatter and TPD. Furthermore, the auto-resonance responsible for iSRS in these simulations may not be possible when a full speckle profile is included; since the extension of the resonance region may take the resonant waves outside of an individual speckle. The use of broadband laser systems to mitigate LPI will also need to be assessed in the kinetic regime of iSRS. All of these refinements to iSRS simulations will require considerably more computing resources but are none-the-less needed for a comprehensive treatment of LPI relevant to shock-ignition.
Acknowledgements.
We are grateful to the EPOCH developer team (K. Bennett, C. S. Brady and H. Ratcliffe) for their adaptations to the code in preparation for this simulation campaign. The EPOCH code used in this work was in part funded by the UK EPSRC grants EP/G054950/1, EP/G056803/1, EP/G055165/1, EP/ M022463/1 and EP/P02212X/1. We also acknowledge the use of Athena at HPC Midlands+, which was funded by the EPSRC on grant EP/P020232/1, in this research, as part of the HPC Midlands+ consortium. This work has been carried out within the framework of the EUROfusion Enabling Research Project: ENR- IFE19.CEA-01 “Study of Direct Drive and Shock Ignition for IFE: Theory, Simulations, Experiments, Diagnostics development” and has received funding from the Euratom research and training programme. The views and opinions expressed herein do not necessarily reflect those of the European Commission.Data availability
Support in generating the data that support the findings of this study, using the EPOCH PIC code, are available from the corresponding author upon reasonable request.
References
- Betti et al. [2008] R. Betti, W. Theobald, C. D. Zhou, K. S. Anderson, P. W. McKenty, S. Skupsky, D. Shvarts, V. N. Goncharov, J. A. Delettrez, P. B. Radha, T. C. Sangster, C. Stoeckl, and D. D. Meyerhofer, Journal of Physics: Conference Series 112, 022024 (2008).
- Perkins et al. [2009] L. J. Perkins, R. Betti, K. N. Lafortune, and W. H. Williams, Physical Review Letters 045004, 1 (2009).
- Craxton et al. [2015] R. S. Craxton, K. S. Anderson, T. R. Boehly, V. N. Goncharov, D. R. Harding, J. P. Knauer, R. L. McCrory, P. W. McKenty, D. D. Meyerhofer, J. F. Myatt, A. J. Schmitt, J. D. Sethian, R. W. Short, S. Skupsky, W. Theobald, W. L. Kruer, K. Tanaka, R. Betti, T. J. B. Collins, J. A. Delettrez, S. X. Hu, J. A. Marozas, A. V. Maximov, D. T. Michel, P. B. Radha, S. P. Regan, T. C. Sangster, W. Seka, A. A. Solodov, J. M. Soures, C. Stoeckl, and J. D. Zuegel, Physics of Plasmas 22, 110501 (2015).
- Theobald et al. [2012] W. Theobald, R. Nora, M. Lafon, A. Casner, X. Ribeyre, K. S. Anderson, R. Betti, J. A. Delettrez, J. A. Frenje, V. Y. Glebov, O. V. Gotchev, M. Hohenberger, S. X. Hu, F. J. Marshall, D. D. Meyerhofer, T. C. Sangster, G. Schurtz, W. Seka, V. A. Smalyuk, C. Stoeckl, and B. Yaakobi, Physics of Plasmas 19, 102706 (2012).
- Liu et al. [1974] C. S. Liu, M. N. Rosenbluth, and R. B. White, The Physics of Fluids 17, 1211 (1974).
- Liu and Rosenbluth [1976] C. S. Liu and M. N. Rosenbluth, Physics of Fluids 19, 967 (1976).
- Rosenberg et al. [2018] M. J. Rosenberg, A. A. Solodov, J. F. Myatt, W. Seka, P. Michel, M. Hohenberger, R. W. Short, R. Epstein, S. P. Regan, E. M. Campbell, T. Chapman, C. Goyon, J. E. Ralph, M. A. Barrios, J. D. Moody, and J. W. Bates, Physical Review Letters 120, 10.1103/PhysRevLett.120.055001 (2018).
- Ribeyre et al. [2009] X. Ribeyre, G. Schurtz, M. Lafon, S. Galera, and S. Weber, Plasma Physics and Controlled Fusion 51, 015013 (2009).
- Batani et al. [2014] D. Batani, S. Baton, A. Casner, S. Depierreux, M. Hohenberger, O. Klimo, M. Koenig, C. Labaune, X. Ribeyre, C. Rousseaux, G. Schurtz, W. Theobald, and V. Tikhonchuk, Nuclear Fusion 54, 054009 (2014).
- Klimo et al. [2010] O. Klimo, S. Weber, V. T. Tikhonchuk, and J. Limpouch, Plasma Physics and Controlled Fusion 52, 10.1088/0741-3335/52/5/055013 (2010).
- Klimo et al. [2011] O. Klimo, V. T. Tikhonchuk, X. Ribeyre, G. Schurtz, C. Riconda, S. Weber, and J. Limpouch, Physics of Plasmas 18 (2011).
- Cristoforetti et al. [2017] G. Cristoforetti, A. Colaïtis, L. Antonelli, S. Atzeni, F. Baffigi, D. Batani, F. Barbato, G. Boutoux, R. Dudzak, P. Koester, E. Krousky, L. Labate, P. Nicolaï, O. Renner, M. Skoric, V. Tikhonchuk, and L. A. Gizzi, EPL 117 (2017).
- Riconda et al. [2011] C. Riconda, S. Weber, V. T. Tikhonchuk, and A. Héron, Physics of Plasmas 18, 10.1063/1.3630937 (2011).
- Vu et al. [2002] H. X. Vu, D. F. DuBois, and B. Bezzerides, Physics of Plasmas 9, 1745 (2002).
- Yin et al. [2006] L. Yin, W. Daughton, B. J. Albright, K. J. Bowers, D. S. Montgomery, J. L. Kline, J. C. Fernández, and Q. Roper, Physics of Plasmas 13 (2006).
- Vu et al. [2007] H. X. Vu, D. F. DuBois, and B. Bezzerides, Physics of Plasmas 10.1063/1.2426918 (2007).
- Strozzi et al. [2007] D. J. Strozzi, E. A. Williams, A. B. Langdon, and A. Bers, Physics of Plasmas 14, 013104 (2007).
- Yin et al. [2008] L. Yin, B. J. Albright, K. J. Bowers, W. Daughton, and H. A. Rose, Physics of Plasmas 15 (2008).
- Yin et al. [2012] L. Yin, B. J. Albright, H. A. Rose, K. J. Bowers, B. Bergen, R. K. Kirkwood, D. E. Hinkel, A. B. Langdon, P. Michel, D. S. Montgomery, and J. L. Kline, Physics of Plasmas 19, 10.1063/1.3694673 (2012).
- Ellis et al. [2012] I. N. Ellis, D. J. Strozzi, B. J. Winjum, F. S. Tsung, T. Grismayer, W. B. Mori, J. E. Fahlen, and E. A. Williams, Physics of Plasmas 19, 112704 (2012).
- Fernández et al. [2000] J. C. Fernández, J. A. Cobble, D. S. Montgomery, M. D. Wilke, and B. B. Afeyan, Physics of Plasmas 7, 3743 (2000).
- Montgomery et al. [2002] D. S. Montgomery, J. A. Cobble, J. C. Fernández, R. J. Focia, R. P. Johnson, N. Renard-Legalloudec, H. A. Rose, and D. A. Russell, Physics of Plasmas 9, 2311 (2002).
- Vu et al. [2001] H. X. Vu, D. F. Dubois, and B. Bezzerides, Physical Review Letters 10.1103/PhysRevLett.86.4306 (2001).
- O’Neil [1965] T. O’Neil, Physics of Fluids 12 (1965).
- Wang et al. [2018] Y. X. Wang, Q. Wang, C. Y. Zheng, Z. J. Liu, C. S. Liu, and X. T. He, Physics of Plasmas 25, 10.1063/1.5040095 (2018).
- Winjum et al. [2019] B. J. Winjum, A. Tableman, F. S. Tsung, and W. B. Mori, Physics of Plasmas 26, 112701 (2019).
- Rosenbluth [1972] M. N. Rosenbluth, Physical Review Letters 29, 565 (1972).
- Williams [1991] E. A. Williams, Physics of Fluids B 3, 1504 (1991).
- Liu and Tripathi [1994] C. S. Liu and V. K. Tripathi, Interaction of Electromagnetic Waves with Electron Beams and Plasmas (World Scientific, 1994) Chap. 9, pp. 142–147.
- Morales and O’Neil [1972] G. J. Morales and T. M. O’Neil, Physical Review Letters 28, 417 (1972).
- Chapman et al. [2010] T. Chapman, S. Hüller, P. E. Masson-Laborde, W. Rozmus, and D. Pesme, Physics of Plasmas 17, 10.1063/1.3529362 (2010).
- Chapman et al. [2012] T. Chapman, S. Hüller, P. E. Masson-Laborde, A. Heron, D. Pesme, and W. Rozmus, Phys. Rev. Lett. 108, 145003 (2012).
- Klimo et al. [2014] O. Klimo, J. Psikal, V. T. Tikhonchuk, and S. Weber, Plasma Physics and Controlled Fusion 56, 10.1088/0741-3335/56/5/055010 (2014).
- Rosenberg et al. [2020] M. J. Rosenberg, A. A. Solodov, W. Seka, R. K. Follett, J. F. Myatt, A. V. Maximov, C. Ren, S. Cao, P. Michel, M. Hohenberger, J. P. Palastro, C. Goyon, T. Chapman, J. E. Ralph, J. D. Moody, R. H. H. Scott, K. Glize, and S. P. Regan, Physics of Plasmas 27, 042705 (2020).
- Baton et al. [2020] S. D. Baton, A. Colaïtis, C. Rousseaux, G. Boutoux, S. Brygoo, L. Jacquet, M. Koenig, D. Batani, A. Casner, E. L. Bel, D. Raffestin, A. Tentori, V. Tikhonchuk, J. Trela, C. Reverdin, L. Le-Deroff, W. Theobald, G. Cristoforetti, L. A. Gizzi, P. Koester, L. Labate, and K. Shigemori, High Energy Density Physics 36, 100796 (2020).
- Arber et al. [2015] T. D. Arber, K. Bennet, C. S. Brady, A. Lawrence-Douglas, M. G. Ramsay, N. J. Sircombe, P. Gillies, R. G. Evans, H. Schmitz, A. R. Bell, and C. P. Ridgers, Plasma Physics and Controlled Fusion 57, 113001 (2015).
- Rousseaux et al. [2006] C. Rousseaux, L. Gremillet, M. Casanova, P. Loiseau, M. Rabec Le Gloahec, S. D. Baton, F. Amiranoff, J. C. Adam, and A. Héron, Physical Review Letters 97, 1 (2006).
- Kline et al. [2006] J. L. Kline, D. S. Montgomery, L. Yin, D. F. DuBois, B. J. Albright, B. Bezzerides, J. A. Cobble, E. S. Dodd, D. F. DuBois, J. C. Fernández, R. P. Johnson, J. M. Kindel, H. A. Rose, H. X. Vu, and W. Daughton, Physics of Plasmas 13 (2006).
- Kruer [2003] W. Kruer, The Physics of Laser Plasma Interactions, 1st ed. (CRC Press, 2003).
- Winjum et al. [2010] B. J. Winjum, J. E. Fahlen, F. S. Tsung, and W. B. Mori, Physical Review E - Statistical, Nonlinear, and Soft Matter Physics 81, 1 (2010).