HD 63021: Chromospheric Activity and Mass Transfer in a Close Binary
Abstract
Prompted by X-ray detections from multiple surveys, we investigated the A-type star HD 63021 and found that it is a double-lined spectroscopic binary with highly variable emission associated with the primary star. Analysis of our multi-epoch spectroscopic observations, the majority of which were carried out on small aperture telescopes, indicates a very short orbital period of just days, and a mass ratio M2/M1 of . The A1 V star is a slow rotator, with a rotational speed of km/s. Assuming its mass is M⊙, the present-day secondary is an evolved star of M⊙ that nearly fills its Roche lobe. This secondary star rotates comparatively rapidly at km/s, and we see evidence that it is chromospherically active. Analysis of a photometric lightcurve from TESS reveals two strong periods, one at the orbital period for the system and another at half the orbital period. These findings suggest that HD 63021 is a close binary system undergoing mass transfer from the secondary star onto the primary star – in all ways like an Algol eclipsing binary system, except without the eclipse. We discuss the system’s mass transfer, which is not steady but seems to run in fits and bursts, and infer the system’s basic physical properties from an orbital parameter study, the Roche lobe geometry, and its extant X-ray emission.
1 Introduction
Estimates of the binary fraction of intermediate-mass stars on the Main Sequence (spectral types B5 down to F2) are typically above % (Duchêne & Kraus, 2013, and references therein; Section 3.4); this fraction is lower for lower-mass stars, and higher for high-mass stars. Yet in a recent spectroscopic survey, only % of a target sample of 20,000 Main Sequence stars showed evidence of binarity, and most of these were double-lined spectroscopic binaries (SB2s; El-Badry et al., 2018). While many factors contribute to the low success rate of spectroscopically identifying binary stars, SB2s at intermediate- and high-mass are particularly difficult to identify because of the high luminosity of the primary companion, which obscures spectral features associated with the secondary.
The vast majority of emission-line B-type stars (abbreviated Be but including non-supergiant stars of spectral types O9 to A2) are rapidly rotating and exhibit characteristic emission in Hydrogen series and low-ionization metal lines that are formed in circumstellar disks made of gas ejected from the surface of the star. They account for roughly % of all stars within this spectral type range (Rivinius et al., 2013). This percentage is intrinsically variable due to the transient nature of Be disks, whereby the emission signatures may appear or disappear unexpectedly from spectra over timescales ranging from days to years (Chojnowski et al., 2017). Even so, studies have shown that the binary fraction of Be stars is the same as the binary fraction for regular B-type stars (Oudmaijer & Parr, 2010), so we should expect to find SB2 Be stars in the field sample.
Emission-line A-type (Ae) stars are far more rare than Be stars and are typically only found among the earlier subtypes A0-A2 (see, e.g., Jaschek & Jaschek, 1983; Zorec & Briot, 1997). They are also more difficult to detect because their disks are lower density, as recent investigations have shown (Vieira et al., 2017; Shokry et al., 2018). Ae and Be stars exhibiting X-ray fluxes are attributable to binary systems with either compact companions (Podsiadlowski et al., 2002; Reig, 2011; Wang et al., 2018) or stellar companions in either a detached or semidetached state (Singh et al., 1996). The X-ray emission among A-type stars generally is low or undetected (Schröder & Schmitt, 2007), and for this reason HD 63021 initially caught our attention.
X-ray detections are quite common among emission-line binaries. As noted above, emission-line sources with compact binary companions produce X-rays; the source is the circumstellar disk (Reig, 2011). Another class of X-ray emitting binaries are those with chromospherically active late-type companions. RS CVn stars consist of at least one late-type component, exhibit Ca ii H and K emission, star spots, ultraviolet and infrared excesses, and are oftentimes X-ray sources (Singh et al., 1996). The (typically) shorter period early-type Algol eclipsing binaries are also usually X-ray emitters. X-ray emission in both RS CVn- and Algol-type binaries comes from the late-type companions, which are chromospherically active and rotating quickly ( km/s; Hall, 1989).
We first observed HD 63021 in April 2018 as a sample member of intermediate-mass stars targeted to determine their spectral types. It was noted, however, that this A1 V star exhibited emission in the Balmer series and, what is unusual for most Be stars, the Fe ii (42) multiplet. Follow-up spectroscopic observations revealed that the photospheric absorption lines and Balmer emission were variable on a period of mere days, and a search through the available archives additionally revealed that the source had an appreciable X-ray flux (Whelan et al., 2018). Given the likelihood that HD 63021 would turn out to be a binary, we then set out on a multi-epoch, high-resolution spectroscopic survey to detect Doppler-shifted lines and, because of its type, check for Zeeman-split lines and chemical peculiarities that would suggest the presence of a magnetic field (e.g., Chojnowski et al., 2019). We also collected H spectra using small telescopes to study the circumstellar material in detail.
Here we report the findings of this detailed, multi-epoch and multi-wavelength study of HD 63021. In Section 2 we describe the data that we collected on HD 63021, both new observations and from various archives. In Section 3 we describe the observed properties of this binary system, and in Section 4 we interpret our results in light of stars with similar observed properties. We present our conclusions in Section 5.
2 Observations and Data Reduction
The Observation Log in Table 1 includes information on spectra secured at four different telescope facilities. Columns include the observing epoch, observatory code, number of spectra taken, spectral resolution, and wavelength range. All but one of our individual spectra were secured in the period of one year, from April of 2018 to March of 2019. (The additional spectrum is a low-resolution spectrum secured in April of 2020.) For the purposes of efficiency, we have not listed each of the individual spectra separately in this table, but have instead listed the number of spectra secured in each calendar month (epoch), where the label “Apr18” stands for April of 2018, “Nov18” stands for November of 2018, etc. The Observation Log is split into four parts. The first part lists low-resolution spectra taken at blue-violet wavelengths, and these observations are described in Section 2.1 below. The second part lists high-resolution echelle spectra; see Section 2.2. And the third and fourth parts list high-resolution long-slit spectra taken with small-aperture telescopes (Section 2.3).
This section also includes descriptions of our various photometric datasets. Section 2.4 describes the data from the Transiting Exoplanet Survey Satellite (TESS), and Section 2.5 describes the various archival datasets that we utilized in our analysis.
2.1 Low-resolution Spectra
Low-resolution optical spectra were obtained using an Lhires III long-slit spectrograph built by Shelyak, on the Adams Observatory -inch telescope at Austin College. We use the code “AO” to label observations from the Adams Observatory in Table 1.
The Lhires III spectrograph is in the Littrow configuration, so that there is no magnification of the slit in the focal plane. We utilize a slit to match the seeing conditions at the Adams Observatory; since the telescope is operating at /8, the slit width is on the sky. The charge-coupled device (CCD) is housed in a Finger Lakes Instrumentation Microline camera which can cool to K below the ambient temperature. The CCD chip is an e2v 42-10, with pixels in an array . Two different dispersion gratings were used, with grooves/mm and grooves/mm, which offer dispersions of /pixel and /pixel and wavelength ranges of and respectively. The 1200 grooves/mm grating was used most often, and considering the projected slit width, exhibits a spectral resolution of , or across the spectral range to .
Data reduction and analysis were performed in python using our own routines. Science images were bias- and dark-subtracted and flatfield corrected using an integrated flatfield lamp. Spectra were extracted for a width twice the (standard deviation) value determined by fitting a Gaussian curve to the dispersion profile, and sky emission was subtracted at each wavelength element based on average values of the sky on either side of the stellar spectrum. Wavelength calibration to rest velocity was performed on the science images using the wavelength positions of known photospheric absorption features, and was checked using a Neon-Argon discharge tube spectrum and the positions of two emission lines due to mercury in the sky spectrum (at and in air; Kramida et al., 2018). The signal-to-noise ratio was computed at every wavelength using the CCD equation (Howell, 2006). The final spectra were divided by the continuum, which was computed by fitting a cubic spline between hand-chosen continuum points.
2.2 High-Resolution Spectra
Additional spectra were obtained at high resolution with the Astrophysical Research Consortium Echelle Spectrograph (ARCES) on the ARC -meter telescope at Apache Point Observatory (label APO in Table 1).
The ARCES is permanently mounted at the NA1 port of the 3.5 m telescope. The ARCES spectra cover the wavelength range at a resolution of ( pixels), spread over 107 separate orders on a SITe CCD (Wang et al., 2003). Data were reduced and extracted using the IRAF echelle task, which includes bias subtraction, scattered light correction, cosmic ray removal, flatfield correction, and wavelength calibration using the available Thorium-Argon lamp.
| Epoch | Obs.aaObs.: The observatories where spectroscopy was secured. AO: Adams Observatory; APO: Apache Point Observatory; DO: Daglen Observatory; GTO: Grey Tree Observatory | No. of | Resolution | Range |
|---|---|---|---|---|
| Spectra | () | () | ||
| Low-Resolution Blue-Violet | ||||
| Apr18 | AO | 4 | 1.4 | 3817-4940 |
| Apr18 | AO | 2 | 2.9 | 3707-6007 |
| Nov18 | AO | 2 | 1.4 | 3821-4945 |
| Jan19 | AO | 18 | 1.4 | 3822-4946 |
| Feb19 | AO | 5 | 1.4 | 3825-4949 |
| Mar19 | AO | 1 | 1.4 | 3828-4952 |
| Apr20 | AO | 1 | 1.4 | 3804-4928 |
| High-Resolution Echelle | ||||
| Jan19 | APO | 1 | 0.091 | 3590-10500 |
| Feb19 | APO | 2 | 0.091 | 3590-10500 |
| Mar19 | APO | 9 | 0.091 | 3590-10500 |
| H Observations | ||||
| Apr18 | DO | 4 | 0.12 | 6487-6645 |
| Apr18 | GTO | 4 | 0.12 | 6494-6652 |
| Jan19 | DO | 10 | 0.12 | 6533-6686 |
| Feb19 | DO | 21 | 0.12 | 6532-6687 |
| Mar19 | DO | 26 | 0.12 | 6484-6639 |
| Apr19 | DO | 18 | 0.12 | 6484-6639 |
| Si ii Observations | ||||
| Mar19 | DO | 37 | 0.12 | 6283-6446 |
2.3 H alpha and Si ii Follow-Up Observations
Follow-up observations were a collaborative effort between professional and amateur astronomers, made to study the H emission profile () and to determine the orbital motion of the primary stellar companion using the Si ii lines at and . These data were secured at the Daglen and Grey Tree Observatories (DO and GTO in Table 1) using Lhires III spectrographs on -inch Schmidt telescopes by Celestron with focal ratio /11. Owned and operated by experienced amateur astronomers, the telescopes and spectrographs at Daglen and Grey Tree Observatories are capable of providing research-level science results, as we will show in Section 3.1.
Data were reduced using the Integrated Spectrographic Innovative Software (ISIS)111ISIS is designed specifically for use with Shelyak-built spectrographs, and is available at http://www.astrosurf.com/buil/isis-software.html, which includes a standard data reduction procedure, spectral extraction, and wavelength calibration using the integrated Neon lamp. These follow-up observations are also logged in Table 1.
2.4 TESS Satellite Photometry
The Transiting Exoplanet Survey Satellite (TESS) observes a large portion of the sky for the express purpose of finding exoplanet transits (Ricker et al., 2014). We utilize its multi-epoch photometry to study the orbital properties of HD 63021. HD 63021 was not pre-selected for two-minute cadence observations in the first year (cycle ) of TESS. We extracted the TESS light curve from the -minute cadence full frame images (FFIs) and performed a principal component analysis detrending method to remove systematic trends common to other nearby stars of similar brightness. Comparing the photometric data of -minute cadence curves extracted this way to the two-minute light curves delivered by the TESS office for stars of similar brightness to HD 63021 yields virtually identical results (Labadie-Bartz et al., submitted, ). The main differences are that longer term astrophysical trends remain intact when using the FFIs, and that the Nyquist frequency for 30-minute cadence data is c/d, compared to c/d for -minute cadence data. There is variability on a scale many times that of the orbital period that is of uncertain origin; we present the full light curve in Section 3.5.
2.5 Archival Data: Photometric Surveys and GCVS
Photometry from the Tycho-2 (Høg et al., 2000), 2MASS (Skrutskie et al., 2006), and WISE (Cutri & et al., 2013) surveys was collected to make a spectral energy distribution (SED). Flux conversions for the photometry were performed using the magnitude zero-points found in Bessell & Murphy (2012) for Tycho-2, Cohen et al. (2003) for 2MASS, and Wright et al. (2010) for WISE. Ultraviolet photometry was also collected from the Sky Survey Telescope (S2/68; Thompson et al., 1978). A full table of the observed fluxes in each band is provided in Table 2.
| Survey | Band | Magnitude | Fν | |
|---|---|---|---|---|
| () | (10-10 erg/s/cm2) | |||
| S2/68 | F1565 | 0.1565 | – | 844 |
| S2/68 | F1965 | 0.1965 | – | 1316 |
| S2/68 | F2365 | 0.2365 | – | 1211 |
| S2/68 | F2740 | 0.2740 | – | 1293 |
| Tycho-2 | BT | 0.4215 | 7.1510.016 | 3846 |
| Tycho-2 | VT | 0.5262 | 7.0420.012 | 3194 |
| 2MASS | J | 1.235 | 6.6210.020 | 86.51.6 |
| 2MASS | H | 1.662 | 6.4170.042 | 50.92.0 |
| 2MASS | Ks | 2.159 | 6.3000.021 | 27.90.5 |
| WISE | W1 | 3.3526 | 6.2050.087 | 9.040.72 |
| WISE | W2 | 4.6028 | 6.0880.031 | 4.080.12 |
| WISE | W3 | 11.5608 | 6.1420.015 | 0.2630.004 |
| WISE | W4 | 22.0883 | 5.9330.051 | 0.04760.0022 |
HD 63021 has been detected in numerous X-ray surveys, most notably the ROSAT All-Sky Bright Source Catalogue (RASS/BSC; Voges et al., 1999; Haakonsen & Rutledge, 2009), 2RXS (Boller et al., 2016), and the XMM-Newton Slew Survey (Freund et al., 2018). We used the GAIA distance of pc (Bailer-Jones et al., 2018), together with the observed source fluxes to determine X-ray luminosities in the X-ray bands from the 2RXS and XMM-Newton surveys. The results are presented in Table 3.
| Survey | Stellar FX | LX |
|---|---|---|
| (10-12 erg/s/cm2) | (1027 mW) | |
| 2RXSaa0.1-2.4 keV | 2.10.4bbThe flux derived using a power law fit is used, as it had the lowest reduced value. | 7.01.3 |
| XMM-NewtonccBand 6: 0.2-2 keV | 1.20.6 | 4.02.0 |
Lastly, the General Catalogue of Variable Stars (GCVS; Samus’ et al., 2017) was cross-matched222the CDS X-Match Service can be accessed at http://cdsxmatch.u-strasbg.fr/ with the stellar X-ray catalog of Salvato et al. (2018). This was used to create a sample of X-ray sources among variable stars with which to compare HD 63021’s X-ray properties.
3 Data Analysis
In this section we analyze our observations and archival data. This includes a full analysis of our spectroscopic data, starting with determining orbital parameters from our high-resolution spectroscopic observations (Section 3.1), identifying emission signatures of importance (Section 3.2), identifying variable absorption lines in the spectrum, then using absorption lines to measure projected rotational speed and inferring the equatorial rotation speed (Section 3.3), and finally describing the H line emission variability (Section 3.4). We then turn our attention to the photometric datasets, starting with a light curve analysis (Section 3.5), then fitting the spectral energy distribution with stellar photosphere models (Section 3.6), and lastly comparing HD 63021’s X-ray luminosity and orbital period with those of other stellar X-ray sources (Section 3.7). Interpretation of these results is reserved for Section 4.
3.1 Orbital Parameters
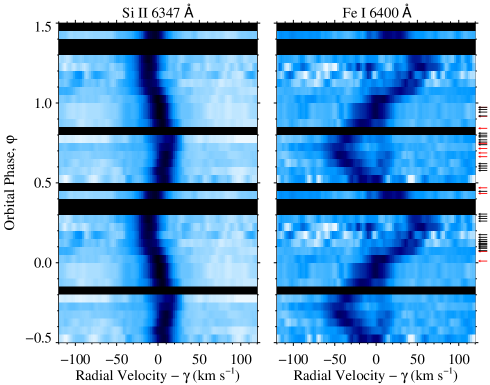
We see direct evidence of this source being a double-lined spectroscopic binary (SB2) in the ARCES and Daglen Observatory spectra. Orbital phase diagrams of the Si ii line at and the Fe i line at are shown in Figure 1. The phases at which each spectrum were secured are shown with small arrows on the right of the diagrams, with black arrows designating Daglen Observatory spectra and red arrows designating ARCES spectra. The color-coding of the actual diagram traces the brightness of the spectrum, where the contrast between light and dark for the Si ii line is at the % level, and for the Fe i line is at the % level. The Si ii line, originating with the primary, shows a relatively small Doppler shift throughout the orbital phase diagram ( km/s), whereas the Fe i line, from the secondary, shows a much more substantial Doppler shift ( km/s) and in the opposite direction to the shift in the Si ii line. In the Fe i phase diagram, a faint Fe i line from the primary can also be seen, particularly between phases .
We identified a number of well-separated lines originating from both the primary and the secondary stars that could be used to determine an orbital solution for the system. These include species of O i (, , and ), Mg i (, , and ) and Mg ii (), Si ii (, , and ), Ti ii (), and Fe ii ( and ) for the primary, and Ca i (, , and ) and Fe i (, , , , , and ) for the secondary. Lines were fit with Gaussian curves to determine their line centers, and the average value of the fit line centers for each star were compared to the rest wavelengths to determine Doppler speeds. The standard deviation of the mean was also computed, but likely underestimated the true uncertainties in the average Doppler speeds because we did not account for the signal-to-noise in the spectra or the airmass at which the spectra were taken. A qualitative look at the spectra suggested to us that we adjust the standard deviation values up by km/s for the primary and km/s for the secondary to compensate for these additional sources of uncertainty; the final uncertainty values are shown as error bars in Figure 2. The Doppler speeds with uncertainties found for each spectrum were then fit using the code (Iglesias-Marzoa et al., 2015) to determine the orbital parameters of HD 63021.
| Parameter | Value |
|---|---|
| [days] | 2.9060.002 |
| [MJD] | 58540.9950.010 |
| 0.00 | |
| (deg) | 90.0 |
| [km/s] | 8.9790.170 |
| [km/s] | 11.0100.509 |
| [km/s] | 48.1640.690 |
| 50.925 | |
| 1.561 | |
| 4.446 | |
| (primary) | 47 |
| (secondary) | 73 |
| Time span (days) | 54.759 |
| 0.229 0.011 | |
| () | 0.051 0.002 |
| () | 0.012 0.002 |
| () | 0.632 0.029 |
| () | 2.765 0.040 |
| () | 3.397 0.049 |
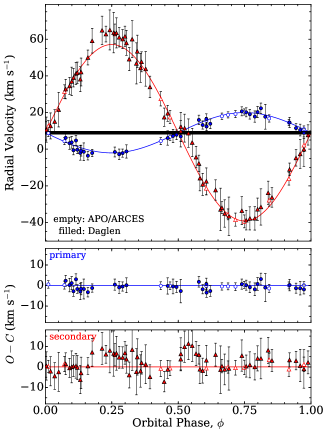
For double-lined spectroscopic binaries, solves for the orbital period (), epoch of periastron passage () which we present as a modified Julian Date (MJD), eccentricity (), argument of periastron (), radial component of the systemic velocity (), and semi-amplitudes of radial velocity for the primary () and secondary components (). Other derived quantities, such as the mass ratio () and projected semi-major axis distances are presented along with the fitted parameters in Table 4. Statistical values related to the fit include the value of the fit, the root-mean-square of the data minus the model fit for the primary and secondary ( and ), the number of observations used, and the time span over which the observations used in the fit were made.
The fit of the radial velocity as a function of phase for a period of days is shown in the top panel of Figure 2, with the circle symbols showing radial velocities for the primary component and the triangle symbols showing the radial velocities for the secondary component. Open symbols represent data points from ARCES spectra, whereas filled symbols are from Daglen Observatory spectra. In the two lower panels, the residuals are plotted separately for the primary and secondary on the same scale. The residuals for both components exhibit roughly the same percentage errors.
Given that the spectral type of the primary is A1 V (see below, Section 3.3), if we assume that its mass is M⊙ (Popper, 1980a), then the inclination angle is . This gives us a mass for the secondary of M⊙. We further determine the semi-major axis to be R⊙. Using the Roche lobe effective radius approximation from Eggleton (1983), we determine Roche lobe sizes of R⊙ for the A1 V star, and R⊙ for its dimmer and less massive companion. We use these Roche lobe sizes and the rotational speeds computed in Section 3.3 to compute Roche lobe filling fractions in Section 4 below.
3.2 Atomic Line Emission
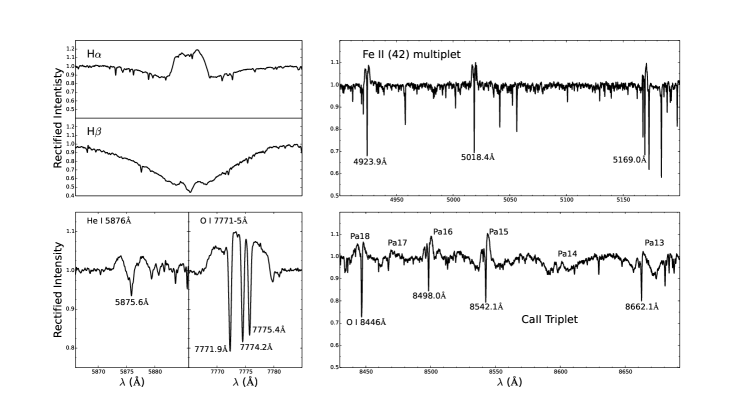
From the ARCES spectrum taken in January 2019, we show in Figure 3 the presence of emission lines from the Balmer series, He i , the O i triplet, the Ca ii triplet at , , and , and the Fe ii (42) multiplet. The line morphology is similar in every case: There is a photospheric absorption line that is broad for the Balmer lines but narrow for the He i and metal lines, with an emission feature superimposed from the circumstellar material and exhibiting a double-horned profile as one might expect from a rotating circumstellar disk. The Fe ii (42) multiplet and Ca ii triplet emission is noteworthy also in appearing asymmetric, with the red emission peak being significantly brighter than the blue. The O i and Ca ii triplets emission is becoming known as a tracer of binarity in Ae/Be stars; this was first studied in depth in Polidan (1976), and more recently Chojnowski et al. (2018) show them both in the spectrum of the Be+sdOB binary HD 55606, and Banerjee et al. (2020) confirmed the presence of the Ca ii triplet in a number of Be binaries. We also have a growing dataset of ARCES spectra of Be binaries that show the same emission features333These data are currently unpublished.
3.3 The Absorption Line Spectrum
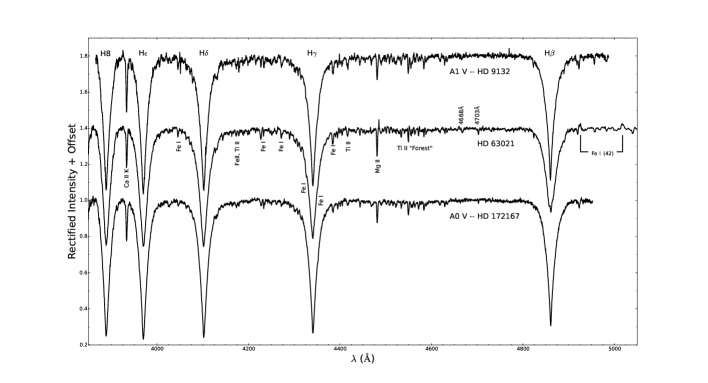
A violet-blue spectrum of HD 63021, taken at the Adams Observatory in April of 2018, is shown in Figure 4 along with A0 V and A1 V spectroscopic standards. The Balmer line wings are closely matched to the A1 V spectrum, and that is in fact our adopted spectral type. Filling in of the center of the H and H lines is clearly visible. The Fe ii (42) lines indicated at and are in emission, as discussed above in Section 3.2. The small upward spike near the Mg ii absorption line is the result of a hot pixel that was not corrected during the reduction process. In general the metallic absorption lines are quite narrow owing to the source’s low sin value, and this had to be taken into account when comparing to the standard spectra.
HD 63021 exhibits some spectral peculiarities. For instance, the Ca ii K absorption line in this spectrum more closely matches the A0 V standard than the A1 V. The various other Fe i, Fe ii, and Ti ii lines labeled are by and large at an intermediate strength between the two standards. Some other lines are visible at strengths that would normally suggest later spectral types of A3-5, such as those visible at and .
Variability observed in the optical spectra is particularly noteworthy. The emission line strength changed most visibly, and that altered to what extent the Balmer line centers were filled and how great the Fe ii (42) multiplet showed above the continuum. More surprising, however, was that the metal lines were all observed to change strength on a spectrum-by-spectrum basis. The Ca ii K line, for instance, varied in spectral type from kB9.5 to kA1. Most of the metal lines varied in strength from A0 to A1. The and lines were usually more closely matched with an A1 type. It became fairly clear after we performed the orbital parameters study that the absorption line variability seen in the low-resolution spectra was somehow tied to the orbital phase, although the low resolution of these spectra creates line blending that precluded any definitive analysis. The Balmer line wings, unlike the metal absorption line spectrum, were not observed to change spectral type.
We measured sin to study the rotational properties of the primary and secondary stars, using the Fourier transform and goodness-of-fit produced by the IACOB project (Simón-Díaz & Herrero, 2014). We chose well-separated lines in the highest signal-to-noise ARCES spectrum taken in March of for this purpose. The code simultaneously measures the projected rotational speed and the macroturbulent speed. This last parameter is likely a misnomer for hot stars, as it is not produced by large-scale turbulent motion (Simón-Díaz et al., 2012). The primary component of HD 63021 is an A1 star, and is considered a ‘hot’ star because it is beyond the granulation boundary (Chp. 17, Gray, 2005). For the primary, it is therefore not clear what the macroturbulent parameter is fitting, other than it is not fitting the rotational component to the line’s broadening. Table 5 summarizes the findings of our sin analysis. The first column lists the absorption lines for which measurements were made, and the table is split into two sections to differentiate between absorption lines associated with the primary and secondary components. The second column, sin FT, is the calculation of the sin by means of a Fourier transform, in which the macroturbulent velocity has been set to zero (). The third colum, sin GOF, is the calculation of the sin using the goodness-of-fit method developed by the authors, for which the macroturbulent velocities listed in column four of the table () were calculated. In general we note the closer agreement between the Fourier transform and goodness-of-fit results for the primary. But for both stars, there is quite a large spread in values. If we take an average and standard deviation, then the sin for the primary is km/s, and for the secondary it is km/s.
| Line ID | sin FT | sin GOF | |
|---|---|---|---|
| (km/s) | (km/s) | (km/s) | |
| Primary Star | |||
| Si ii 3862 | 7.8 | 8.3 | 12.5 |
| Fe ii 4508 | 8.3 | 9.0 | 9.9 |
| Ti ii 4564 | 9.9 | 9.7 | 8.4 |
| Fe ii 4629 | 7.7 | 9.7 | 9.0 |
| Mg i 4703 | 10.8 | 9.8 | 10.1 |
| Fe ii 5276 | 10.6 | 10.0 | 10.0 |
| Fe ii 5317 | 8.9 | 10.9 | 13.3 |
| Average sin: 9.41.0 | |||
| Secondary Star | |||
| Ca i 6122 | 14.2 | 15.2 | 16.6 |
| Ca i 6439 | 12.2 | 14.0 | 17.6 |
| Fe i 6593 | 12.0 | 14.2 | 16.3 |
| Fe i 6663 | 13.7 | 13.4 | 15.3 |
| Fe i 6678 | 9.7 | 11.7 | 12.9 |
| Fe i 6750 | 11.3 | 7.4 | 21.7 |
| Fe i 8824 | 12.3 | 12.2 | 13.4 |
| Average sin: 12.42.0 | |||
Given the inclination angle derived from our orbital parameter solution, this equates to equatorial velocities of km/s and km/s for the primary and secondary components respectively. The value for the primary’s rotational speed is a little on the low side compared to other A0/1-type stars (Royer et al., 2004), and in particular it is rotating below the km/s equatorial speed above which envelopes are chemically mixed due to meridional circulation (Charbonneau, 1993). It is therefore possible that the metal absorption line strength variability that we observed and discussed above is at least partly caused by chemical peculiarities in the photosphere of the primary star. However, the observed line strength peculiarities are mild at best, and so we do not label the star as being chemically peculiar.
3.4 H Variability
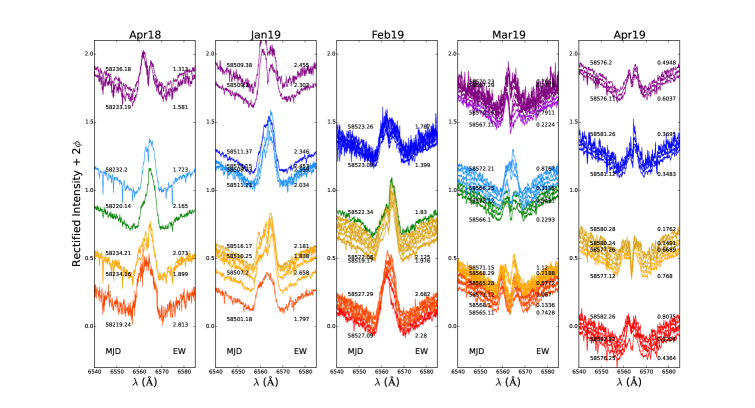
Figure 5 shows our H spectra offset by their phase for each of five months in which it was observed. We plot the modified Julian date (MJD) on the left-hand side of each spectrum, and the emission-line equivalent width (EW) measured between and after a local continuum subtraction on the right. When spectra overlap very tightly, only the MJDs and EWs for the first and last spectra in a group are shown for clarity.
In general terms, we note that the H emission is highly variable, but that emission morphologies do repeat roughly on the orbital period. The emission line strength does change period to period, and the emission profile morphology can change substantially after several periods; hence the line morphologies in Feb19 differ considerably from those in Jan19. During a single period, we see the line morphology change from asymmetric double-horned profiles, roughly consistent with a rotating disk plus some extra emission (most noticeable in the Mar19 and Apr19 epochs) to single-peaked emission, which is generally when the emission strength is greatest. In what follows, we present a detailed description of the line profile for each epoch.
The Apr18 epoch shows rapid variation in emission profile, from a broad single-peaked line (bottom spectrum), to asymmetric lines with stronger red components and very small peak separation (middle spectra), to a stronger blue component and slight wider peak separation (top spectra). The single-peak profile at the bottom (MJD) shows a steeper drop on the redward side than on the blueward, faintly reminiscent of an inverse P Cygni profile, which could suggest infalling material.
The Jan19 epoch shows roughly similar morphological variations to those seen in Apr18, with one difference. There is no discernible pattern in equivalent width measurements between the two epochs: the single-peak profile at MJD in Jan19 is weaker than the similar single-peak profile in Apr18, but many (not all) of the asymmetric profiles that follow have more similar strengths. In short, line morphology appears decoupled from line strength.
The Feb19 epoch is not as well filled-in as those that precede or follow it, but the morphological variability is consistent over the epoch for about eight days, or almost three periods. Line morphologies look similar to the previous epochs, but shifted in phase by about -0.25.
Starting in Mar19, the pattern of profile variability changes. The double-horned profile is a more regular feature, and the peak separation changes substantially during the orbital period. A similar pattern of profile variability is evident in the Apr19 epoch, though the lines are substantially weaker than during any previous epoch and there is a pronounced central depression between the horns of the emission profile in about the middle of the period.
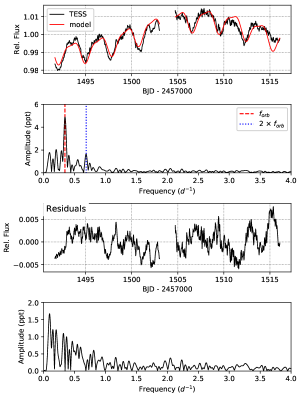
3.5 Photometric Lightcurve
The light curve and periodogram for HD 63021 using TESS data are shown in Figure 6. The light curve is overplotted with a best-fit model for a binary star system. The periodogram shows clearly that there are two strong periods associated with the light curve, at the orbital frequency and at twice the orbital frequency (half the orbital period). The amplitude of the orbital frequency is almost three times the amplitude of twice the orbital frequency. Underlying the brightness fluctuations caused by the orbital motion and rotational modulation of the system is a gradual brightening and dimming of the source at a level of % change in brightness. The residuals for the model-subtracted data show a great deal of structure at % the level due to the orbital/rotational signatures, but since no clear period is seen in the periodogram for these residuals (i.e., they appear stochastic in nature) they are not likely associated with the orbital motions of the HD 63021 system. The residual frequency spectrum offers no evidence of further harmonics of the orbital/rotational motion of the system.
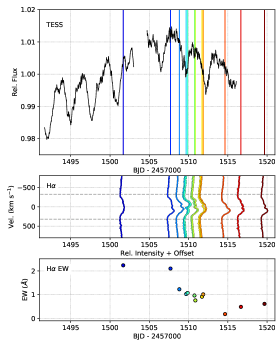
The fact that the strongest amplitude attributable to the orbital properties of HD 63021 is at the orbital period of the binary is unusual; generally speaking, the strongest period for binary star lightcurves is at half the period (Labadie-Bartz et al., 2017; Richards et al., 2012). The underlying brightening and then dimming on a % level for this source requires some explanation. Its brightening takes place over the course of about days, so that if this brightening is indeed periodic it would take place on a cycle roughly ten times that of the orbital period. It could be due to brightening of the star itself, or else changes to the emission associated with the star, since the TESS band includes the H emission line. We plot the TESS lightcurve versus H line profiles observed with ARCES in Figure 7. Note that the line strength for the H spectrum observed during the source brightening (dark blue spectrum) is as strong as the emission at peak brightness (second dark blue spectrum), and that the H emission line strength decreases during the gradual dimming of the source.
3.6 Spectral Energy Distribution
We took the collected archival optical and infrared photometry in order to construct a spectral energy distribution (SED) for HD 63021, with the express intention of confirming the infrared excess that has been previously noted by McDonald et al. (2012) and Cotten & Song (2016). The final SED is shown in Figure 8. Model spectra are shown as solid gray lines for the primary and secondary, and the black line is the combined spectrum. Photometry from the S2/68, Tycho-2, 2MASS, and AllWISE catalogues are plotted.
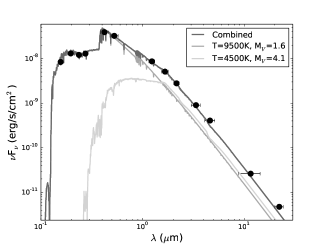
The model spectra are based on the stellar photosphere models of Castelli & Kurucz (2003)444The model spectra are available at this URL: https://archive.stsci.edu/hlsps/reference-atlases/cdbs/grid/ ck04models/. We fit the photometry with solar metallicity spectra at T K and log for the primary star (A1 V, M) and T K and log for the secondary star (K5 IV, M). The model choice for the primary comes from matching to the temperature and gravity recommended by Gray & Corbally (2009) and Gray (2005) respectively. As for the secondary, there are no model suggestions for this type. The masses of late-type K dwarfs are close to M⊙, which is why we chose the K5 spectral type. We also knew it had to be larger than a Main Sequence star because it likely fills its Roche lobe (see § 4 below); hence, the brighter magnitude and sub-giant luminosity class.
We assumed intrinsic colors for these two spectral types from Fitzgerald (1970) and absolute magnitudes from Gray & Corbally (2009). Using these numbers we determined that no correction was necessary for interstellar absorption. Given the uncorrected color of the optical photometry ((BT - VT)), we did not expect much interstellar reddening for this source, and our results are consistent with the maximum E(-) value of 0.013 calculated by Ruiz-Dern et al. (2018). Therefore we did not make a reddening correction to the photometry.
The UV photometry matches the model photospheric emission very well. The slight “knee” that breaks the Rayleigh-Jeans tail in the near-infrared data is well-fit by the secondary spectrum. We see a slight infrared excess above the combined stellar continuum starting at about that increases to longer wavelengths, confirming the infrared excess that has been previously noted. However, unlike Cotten & Song (2016), who attribute the excess to circumstellar dust, the excess observed here does not show the typical strong rise in the mid-infrared that is most often associated with circumstellar dust emission. Cotten et al. recorded a larger excess because they fit the photometry with only a single stellar model. The significantly smaller excess seen here by fitting models of both the primary and secondary stars is more consistent with free-free emission by gas, with a power-law slope that is slightly less steep than the Rayleigh-Jeans tail of the starlight. Excesses similar in shape have been observed in numerous Ae/Be systems (e.g., Gehrz et al., 1974).
3.7 X-ray Luminosity
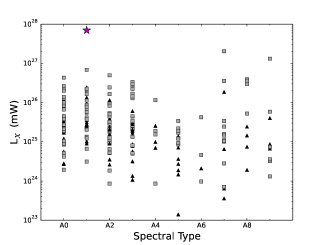
The X-ray luminosity for HD 63021 is high for an A1 star. Figure 9 compares the X-ray luminosity for HD 63021 to luminosities for A-type stars of luminosity classes IV and V from the Schröder & Schmitt (2007) sample. The stars are broken into known single stars (the black triangles) and known binaries (the gray squares). On average, binaries have greater X-ray luminosities than do single stars. Even so, HD 63021 stands out from the crowd.
Since we have computed an orbital period for HD 63021, we next plotted the X-ray luminosity versus the observed period for variable stars from the GCVS in Figure 10. This plot shows the X-ray luminosity and period for some of the most common variability types in the vicinity of HD 63021: EA stands for Algol-type eclipsing binaries; XM stands for variable X-ray emission and the presence of a strong magnetic field; EW stands for W Ursae Majoris eclipsing binaries; RS stands for RS Canum Venaticorum variables; and BY stands for BY Draconis variables. Other variable stars exist within this parameter space in smaller numbers, but are not shown. They include Lyrae-type eclipsing binaries, some types of cataclysmic variables, and some young T Tauri stars.
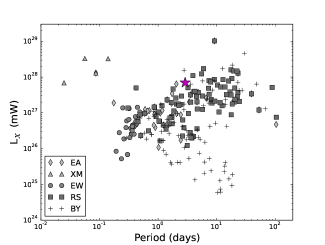
Several of these types are unlikely to correspond with HD 63021, based on the evidence already provided. For instance, HD 63021 is likely not a W Ursae Majoris-type binary because those are contact binaries with much shorter periods and mass ratios closer to unity. It is also not expected to be a cataclysmic variable because the secondary is not a compact object, or a T Tauri star because, given its evolved companion it is far too old. It is not likely a Lyrae-type binary because the rapid and steady mass transfer found in those objects would produce much stronger and steadier Balmer emission. And BY Draconis binaries are made up of late-type emission-line stars only.
The choices that are left in proximity to HD 63021 in Figure 10 are the Algol-type and RS Canum Venaticorum-type binaries. Algols are (usually) semi-detached binaries with early-type (B or early A) Main Sequence primaries and evolved, lower mass secondaries that are oftentimes losing mass to the primary. RS CVn types are also semi-detached binaries, but both components are usually no earlier than F-type and the evolved component is the primary. For both Algol and RS CVn types, the X-ray emission is due to magnetic activity of the evolved component (White & Marshall, 1983).
4 Discussion
HD 63021 is a binary star system exhibiting line emission likely from a circumstellar disk around one of the components, and X-ray emission that is consistent with semi-detached systems like Algol-type and RS CVn-type binaries. Given the evidence, we wish to determine: (1) the Roche lobe filling fractions for the primary and secondary stars, and therefore (2) the location of the emission in the system, as well as (3) the likely nature of the X-ray emission.
Abt et al. (2002) showed that for A-type binaries, the primary star generally has a rotational speed that is synchronized with the orbit, so long as the orbital period is less than days. HD 63021’s orbital period is days, so it is reasonable to assume that at least the primary star is in a synchronized orbit. We now use that information to determine the size of the A1 V star in HD 63021.
Given the primary’s rotation speed of km/s and assuming a synchronized orbit, we can compute its radius as where is the orbital period derived in Section 3.1. We determine a radius for the primary of R⊙. This is spot on when we compare to A1 V star sizes computed from eclipsing binaries, which inhabit the range 1.8-2.2 R⊙ (Popper, 1980a). We can perform the same analysis on the secondary, and assuming that it too is fully synchronized we determine its radius to be R⊙. This is slightly smaller than the secondary’s computed Roche lobe size of R⊙, which may indicate that the secondary star is rotating at slightly less than the synchronous period. Alternatively, there exists a small systematic uncertainty in our measurements of sin for the secondary (presented in Section 3.3), whose lines were very shallow.
In terms of the Roche lobe filling fractions, it is clear that the secondary star nearly fills its Roche lobe (%), while the primary has a filling fraction of . This value is not unusual for close binaries with early-type emission-line primary stars: such a sample studied in Harmanec et al. (2015) is composed of binaries with Roche lobe filling fractions between .
The geometry inferred here is consistent with an Algol-type binary, in which the more massive primary is the more compact star and is receiving mass from the secondary (Richards & Albright, 1999), which in this case appears to be close to but not filling its Roche lobe. As we have seen, the observed orbital period and X-ray luminosity of HD 63021 is also consistent with this interpretation (see Figure 10 above). And now we can also say with confidence that the (oftentimes complex) double-horned profiles seen in many of the emission lines, including periodically in the H line (see Figures 3 and 5), is due to a circumstellar disk of material around the primary that has been accreted from the secondary. The line asymmetries suggest that we are not seeing just a disk, and may be due to emission from the stream of material that connects the primary’s circumstellar disk to L1 (Lubow & Shu, 1975) or else shock waves created by the interaction between the stream and disk (e.g., Bisikalo et al., 1998; Richards et al., 2014). As for the X-ray emission, Hall (1989) has shown that all late-type evolved stars that are chromospherically active are also rapid rotators, with rotation speeds in excess of km/s. The secondary component of HD 63021 is no exception: its rotational speed of km/s is much faster than most late-type stars. This fast rotation speed means that the corona is denser and hotter than the Sun’s, and therefore is a source for soft X-ray emission (Pallavicini et al., 1981).
Having determined the basic properties of the HD 63021 system, we wish to discuss a few as-yet unanswered features of our data and suggest resolutions. These include the H emission variations, the longer-period brightening and dimming of the source, the presence of the He i emission line in the spectrum, and the large residuals exhibited in the model-subtracted light curve.
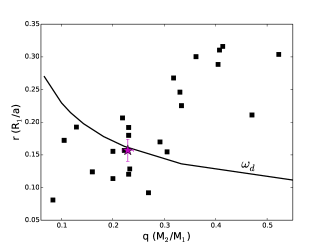
The H emission variations, which are considerable in both strength and line shape, suggest that the geometry of the line-emitting regions of the disk and stream are changing over time. This lead us to wonder whether the accretion disk itself is dynamically unstable, as is sometimes the case for Algol binaries (Richards et al., 2014). To answer that question, we have plotted in Figure 11 HD 63021’s system properties compared to other known Algol-type binary star systems. Data are taken from Richards & Albright (1999) and Popper (1980b), and the parameters plotted are the radius of the primary as a fraction of the binary separation () and the mass ratio (). Also plotted is the theoretical minimum size of a stable accretion disk as a function of mass ratio (; Lubow & Shu, 1975). HD 63021 lies on the line, suggesting that any accretion disk created will be outside this minimum radius and therefore dynamically stable. This would seem to suggest that the disk geometry is not dynamically unstable, and left to its own devices would be found in a steady state. Instead, the amount of material available is changing, i.e. a changing rate of flow from the secondary is the ultimate cause of the H emission variations.
This raises the question: Why does the flow from the secondary star vary? The photometric light curve (Figure 7) shows a % rise and fall in source brightness beneath the -day orbital signature. We have additionally noted that the H line strength is roughly correlated with the brightness of the system (Section 3.5). These observed features are similar to those of AU Mon, for which Peters (1994) suggested that the M⊙ secondary undergoes pulsations that create a cyclic variation of the mass transfer. Considering the other observed similarities between AU Mon and HD 63021 (period-to-period variations of the H emission as described in Section 3.4 and an underlying brightness change on a timescale that is about ten times the orbital period, as our data suggests; Desmet et al., 2010), a cyclic variation in the mass transfer, by whatever means, is a plausible answer to the observed H emission variations.
Taking the residuals in the light curve (Figure 6) at face value, it seems that there is also a certain amount of stochastic photospheric activity on either or both of HD 63021’s stars. Since magnetic fields are likely present within the evolved secondary component, then flares due to the presence of starspots are entirely possible (e.g., Hall, 1992). These starspots may not be physically large, however, otherwise the periodogram would exhibit a stronger peak at half the orbital period since the distended shape of the secondary in its Roche lobe and its synchronous orbit would likely create starspots on opposite sides of the star (Hall & Henry, 1992).
There is still one other possible source of photmetric variation that is worth briefly noting for completeness, even though we do not see evidence for it in our light curve. To date, virtually all of the oscillating Algol-type eclipsing binaries (or oEA; Mkrtichian et al., 2007) have A-type primaries, placing them on the lower-mass end of the EA group where HD 63021 lies. The pulsational modes for oEA stars are typically in the minutes range, and so would appear as a strong period at relatively high frequency. TESS would certainly have picked up on such a period if it were at least mins long (since the observing cadence is mins; see Section 3.5), but no such frequency was observed down to a noise level of .
We turn now to the most unnerving observational trait of HD 63021: the presence of He i emission in the ARCES spectra. This discovery was unexpected, because the primary star is not hot enough to produce He i absorption lines in the blue-violet portion of the spectrum (See Figure 4). The shape of the emission line is roughly double-horned but with considerable structure, which suggests that at least some of its emission originates in the accretion disk around the primary star. If the line cannot be produced by heating from the photosphere, then the only other reasonable supposition is heating by shocks. The gas would be heated by a shock that the stream produces as it interacts with the disk. Since the accretion flow is unsteady, then the system lacks a steady-state configuration for its disk and stream, and therefore shocks are likely at the interface between the stream and disk, as described in Lubow & Shu (1975).
5 Conclusions
HD 63021 is a double-lined spectroscopic binary in which the lower-mass secondary is accreting mass onto the A1 V primary – best classified as an Algol-type binary, except that it is not eclipsing. We find an orbital period of days and a mass ratio of , and assuming a primary star mass of M⊙ we compute a secondary mass of about M⊙. The primary star is very likely in synchronous rotation with the orbit, and we used that to determine the Roche lobe filling fraction of the primary (). The secondary star, being the source of the variable circumstellar disk around the primary, nearly fills its own Roche lobe, and has found some way (perhaps by means of magnetic activity) to lose mass to the primary. This mass leaves the secondary’s surface and is funneled to the primary through L1. The photometric lightcurve reveals two strong periods, at the orbital period and half that value, typical of such stars, and the orbital period is much the stronger of the two. The infrared SED exhibits a slight excess, most likely due to free-free emission from the circumstellar matter, and the X-ray luminosity is consistent with other binaries containing fast-rotating chromospherically active late-type stars.
References
- Abt et al. (2002) Abt, H. A., Levato, H., & Grosso, M. 2002, ApJ, 573, 359
- Bailer-Jones et al. (2018) Bailer-Jones, C. A. L., Rybizki, J., Fouesneau, M., et al. 2018, AJ, 156, 58
- Banerjee et al. (2020) Banerjee, G., Mathew, B., Paul, K. T., et al. 2020, MNRAS. doi:10.1093/mnras/staa3469
- Bessell & Murphy (2012) Bessell, M. & Murphy, S. 2012, PASP, 124, 140
- Bisikalo et al. (1998) Bisikalo, D. V., Boyarchuk, A. A., Chechetkin, V. M., et al. 1998, MNRAS, 300, 39
- Boller et al. (2016) Boller, T., Freyberg, M. J., Trümper, J., et al. 2016, A&A, 588, A103
- Castelli & Kurucz (2003) Castelli, F. & Kurucz, R. L. 2003, Modelling of Stellar Atmospheres, 210, A20
- Charbonneau (1993) Charbonneau, P. 1993, IAU Colloq. 138: Peculiar versus Normal Phenomena in A-type and Related Stars, 44, 474
- Chojnowski et al. (2017) Chojnowski, S. D., Wisniewski, J. P., Whelan, D. G., et al. 2017, AJ, 153, 174
- Chojnowski et al. (2018) Chojnowski, S. D., Labadie-Bartz, J., Rivinius, T., et al. 2018, ApJ, 865, 76
- Chojnowski et al. (2019) Chojnowski, S. D., Hubrig, S., Hasselquist, S., et al. 2019, ApJ, 873, L5
- Cohen et al. (2003) Cohen, M., Wheaton, W. A., & Megeath, S. T. 2003, AJ, 126, 1090
- Cotten & Song (2016) Cotten, T. H. & Song, I. 2016, ApJS, 225, 15
- Cutri & et al. (2013) Cutri, R. M. & et al. 2013, VizieR Online Data Catalog, II/328
- Desmet et al. (2010) Desmet, M., Frémat, Y., Baudin, F., et al. 2010, MNRAS, 401, 418
- Duchêne & Kraus (2013) Duchêne, G. & Kraus, A. 2013, ARA&A, 51, 269
- Eggleton (1983) Eggleton, P. P. 1983, ApJ, 268, 368
- El-Badry et al. (2018) El-Badry, K., Ting, Y.-S., Rix, H.-W., et al. 2018, MNRAS, 476, 528
- Fitzgerald (1970) Fitzgerald, M. P. 1970, A&A, 4, 234
- Freund et al. (2018) Freund, S., Robrade, J., Schneider, P. C., et al. 2018, A&A, 614, A125
- Gehrz et al. (1974) Gehrz, R. D., Hackwell, J. A., & Jones, T. W. 1974, ApJ, 191, 675
- Gray (2005) Gray, D. F. 2005, “The Observation and Analysis of Stellar Photospheres, 3rd Edition”. UK: Cambridge University Press, 2005. ISBN: 0521851866
- Gray & Corbally (2009) Gray, R. O. & Corbally, C. 2009, “Stellar Spectral Classification.” Princeton University Press, 2009. ISBN: 978-0-691-12511-4
- Haakonsen & Rutledge (2009) Haakonsen, C. B. & Rutledge, R. E. 2009, ApJS, 184, 138
- Hall (1989) Hall, D. S. 1989, Space Sci. Rev., 50, 219
- Hall (1992) Hall, D. S. 1992, Robotic Telescopes in the 1990s, 103, 27
- Hall & Henry (1992) Hall, D. S. & Henry, G. W. 1992, AJ, 104, 1936
- Harmanec et al. (2015) Harmanec, P., Koubský, P., Nemravová, J. A., et al. 2015, A&A, 573, A107
- Høg et al. (2000) Høg, E., Fabricius, C., Makarov, V. V., et al. 2000, A&A, 355, L27
- Howell (2006) Howell, S. B. 2006, “Handbook of CCD astronomy, 2nd ed.” UK: Cambridge University Press, 2006. ISBN: 0521852153
- Iglesias-Marzoa et al. (2015) Iglesias-Marzoa, R., López-Morales, M., & Jesús Arévalo Morales, M. 2015, PASP, 127, 567
- Jaschek & Jaschek (1983) Jaschek, C. & Jaschek, M. 1983, A&A, 117, 357
- Kramida et al. (2018) Kramida, A., Ralchenko, Yu., Reader, J., and NIST ASD Team (2018). NIST Atomic Spectra Database (ver. 5.6.1), [Online]. Available: https://physics.nist.gov/asd [2019, June 26]. National Institute of Standards and Technology, Gaithersburg, MD. DOI: https://doi.org/10.18434/T4W30F
- Labadie-Bartz et al. (2017) Labadie-Bartz, J., Pepper, J., McSwain, M. V., et al. 2017, AJ, 153, 252
- (35) Labadie-Bartz, J., Carciofi, A. C., de Amorim, T. H., et al. 2020, AAS Journals, submitted. arXiv:2010.13905
- Lubow & Shu (1975) Lubow, S. H. & Shu, F. H. 1975, ApJ, 198, 383
- McDonald et al. (2012) McDonald, I., Zijlstra, A. A., & Boyer, M. L. 2012, MNRAS, 427, 343
- Mkrtichian et al. (2007) Mkrtichian, D. E., Kim, S.-L., Rodríguez, E., et al. 2007, Solar and Stellar Physics Through Eclipses, 370, 194
- Oudmaijer & Parr (2010) Oudmaijer, R. D. & Parr, A. M. 2010, MNRAS, 405, 2439
- Pallavicini et al. (1981) Pallavicini, R., Golub, L., Rosner, R., et al. 1981, ApJ, 248, 279
- Peters (1994) Peters, G. J. 1994, Interacting Binary Stars, 56, 384
- Podsiadlowski et al. (2002) Podsiadlowski, P., Rappaport, S., & Pfahl, E. D. 2002, ApJ, 565, 1107
- Polidan (1976) Polidan, R. S. 1976, Be and Shell Stars, 70, 401
- Popper (1980a) Popper, D. M. 1980, ARA&A, 18, 115
- Popper (1980b) Popper, D. M. 1980, Close Binary Stars: Observations and Interpretation, 88, 203
- Reig (2011) Reig, P. 2011, Ap&SS, 332, 1
- Richards et al. (2012) Richards, J. W., Starr, D. L., Miller, A. A., et al. 2012, ApJS, 203, 32
- Richards & Albright (1999) Richards, M. T. & Albright, G. E. 1999, ApJS, 123, 537
- Richards et al. (2014) Richards, M. T., Cocking, A. S., Fisher, J. G., et al. 2014, ApJ, 795, 160
- Ricker et al. (2014) Ricker, G. R., Winn, J. N., Vanderspek, R., et al. 2014, Proc. SPIE, 9143, 914320
- Rivinius et al. (2013) Rivinius, Th., Carciofi, A. C., & Martayan, C. 2013, A&A Rev., 21, 69
- Royer et al. (2004) Royer, F., Zorec, J., & Gómez, A. E. 2004, The A-Star Puzzle, 224, 109
- Ruiz-Dern et al. (2018) Ruiz-Dern, L., Babusiaux, C., Arenou, F., et al. 2018, A&A, 609, A116
- Salvato et al. (2018) Salvato, M., Buchner, J., Budavári, T., et al. 2018, MNRAS, 473, 4937
- Samus’ et al. (2017) Samus’, N. N., Kazarovets, E. V., Durlevich, O. V., et al. 2017, Astronomy Reports, 61, 80
- Schröder & Schmitt (2007) Schröder, C. & Schmitt, J. H. M. M. 2007, A&A, 475, 677
- Shokry et al. (2018) Shokry, A, Rivinius, Th., Mehner, A., et al. 2018, A&A, 609, 108
- Simón-Díaz et al. (2012) Simón-Díaz, S., Castro, N., Herrero, A., et al. 2012, Proceedings of a Scientific Meeting in Honor of Anthony F. J. Moffat, 465, 19
- Simón-Díaz & Herrero (2014) Simón-Díaz, S. & Herrero, A. 2014, A&A, 562, A135
- Singh et al. (1996) Singh, K. P., Drake, S. A., & White, N. E. 1996, AJ, 111, 2415
- Skrutskie et al. (2006) Skrutskie, M. F., Cutri, R. M., Stiening, R., et al. 2006, AJ, 131, 1163
- Thompson et al. (1978) Thompson, G. I., Nandy, K., Jamar, C., Monfils, A., Houziaux, L., Carnochan, D. J., & Wilson, R. 1978, LCCN: 79-310488. VizieR Online Data Catalog, II/59B
- Vieira et al. (2017) Vieira, R. G., Carciofi, A. C., Bjorkman, J. E., et al. 2017, MNRAS, 464, 3071
- Voges et al. (1999) Voges, W., Aschenbach, B., Boller, T., et al. 1999, A&A, 349, 389
- Wang et al. (2003) Wang, S.-. i ., Hildebrand, R. H., Hobbs, L. M., et al. 2003, Proc. SPIE, 4841, 1145
- Wang et al. (2018) Wang, L., Gies, D. R., & Peters, G. J. 2018, ApJ, 853, 156
- Whelan et al. (2018) Whelan, D. G., Labadie-Bartz, J., Chojnowski, S. D., et al. 2018, Research Notes of the American Astronomical Society, 2, 33
- White & Marshall (1983) White, N. E. & Marshall, F. E. 1983, ApJ, 268, L117
- Wright et al. (2010) Wright, E. L., Eisenhardt, P. R. M., Mainzer, A. K., et al. 2010, AJ, 140, 1868
- Zorec & Briot (1997) Zorec, J. & Briot, D. 1997, A&A, 318, 443