Using Machine Learning and Natural Language Processing Techniques to Analyze and Support Moderation of Student Book Discussions
Abstract
The increasing adoption of technology to augment or even replace traditional face-to-face learning has led to the development of a myriad of tools and platforms aimed at engaging the students and facilitating the teacher’s ability to present new information. The IMapBook project aims at improving the literacy and reading comprehension skills of elementary school-aged children by presenting them with interactive e-books and letting them take part in moderated book discussions. This study aims to develop and illustrate a machine learning-based approach to message classification that could be used to automatically notify the discussion moderator of a possible need for an intervention and also to collect other useful information about the ongoing discussion. We aim to predict whether a message posted in the discussion is relevant to the discussed book, whether the message is a statement, a question, or an answer, and in which broad category it can be classified. We incrementally enrich our used feature subsets and compare them using standard classification algorithms as well as the novel Feature stacking method. We use standard classification performance metrics as well as the Bayesian correlated t-test to show that the use of described methods in discussion moderation is feasible. Moving forward, we seek to attain better performance by focusing on extracting more of the significant information found in the strong temporal interdependence of the messages.
1 Introduction
Recent decades have brought about an increase in the use of computer-based tools in practically every field of human endeavor. The field of education is no exception. Such tools can be used to augment or even completely replace traditional face-to-face teaching methods. The emergence of online learning platforms has necessitated the development of means to enable learning activities, such as group discussions, to be performed through the use of technology. One such example of a learning platform is the IMapBook software suite aimed at increasing the literacy and reading comprehension skills of elementary school-aged children through the use of web-based eBooks, embedded games related to their contents, as well as moderated group discussions. Keeping these discussions constructive and relevant can be difficult and usually requires a discussion moderator to be present at all times. This can limit the opportunities for such discussions to take place. Leveraging the methods and insights from the fields of artificial intelligence and machine learning, we can attempt to develop systems to automatically classify messages into different categories and detect when the discussion has veered off course and necessitates intervention. Our research tackles this problem using a compilation of discussions obtained during pilot studies testing the effectiveness of using the IMapBook software suite in 4th-grade classrooms. The studies were performed in 8 different Slovene primary schools and, in total, included 342 students. The discussions consist of 3541 messages along with annotations specifying their relevance to the book discussion, type, category, and broad category. The ID of the book being discussed and the time of posting are also included, as are the poster’s school, cohort, user ID, and username. Each message was also manually translated into English to aid non-Slovene-speaking researchers. The use of the Slovene language presents unique challenges in applying standard language processing methods, many of which are not as readily available as for other, more widely spoken languages.
Given a sequence of one or more newly observed messages, we want to estimate the relevance of each message to the actual topic of discussion. Namely, we want to assign messages into two categories — relevant to the book being discussed or not. Additionally, we want to predict whether the message is a question, an answer, or a statement which we call the type of the message. Finally, we want to assign a category label to each message where the possible labels can be either ’chatting’, ’switching’, ’discussion’, ’moderating’, or ’identity’. Building a predictive model capable of performing such predictions with acceptable performance would allow us to experiment with including this new level of automation in the IMapBook software suite as well as in any related products. The research insights are also applicable to areas such as online user comments and content moderation.
2 Related Work
The objective of our research is closely related to tasks concerning online content moderation which has been the subject of much research in recent years. Perhaps one of the earliest studies done on this subject is the 2009 study by Yin et al. Yin et al. (2009) in which the authors used sentiment/contextual features in tandem with the TF-IDF approach to detect online harassment. An earlier study by Mclaren et al. specifically focuses on the use of machine learning techniques to support the mediation of student online discussions in a uniquely constrained network-like environment that differs significantly from ours Mclaren et al. (2007). A 2016 study by Kadunc focuses on using machine learning methods to analyze the sentiment of Slovene online comments and provides an important contribution in the form of an opinion lexicon Kadunc (2016). However, the specifics and unique challenges presented by the problem of classifying short Slovene text produced by this age group remains an area with little to no research currently done.
3 Methods
Achieving the goal of creating a working predictive model for the task of message classification requires careful processing of the raw data in such a way as to expose as much useful information as possible. This process of feature extraction and feature engineering often results in very high dimensional descriptions of our data that can be prone to problems arising as part of the so-called curse of dimensionality Domingos (2012). This can be mitigated by using classification models well-suited for such data as well as performing feature ranking and feature selection.
3.1 Extracting and Engineering Features
Building a quality predictive model requires a good characterization of each message in terms of discriminative and non-redundant features. Extracting such features from raw text data is a non-trivial task that is subject to much research in the field of natural language processing. Here, we describe the feature extraction process used in our study. A detailed evaluation of the features is presented in the Results section.
3.1.1 General Message Features
Looking at the messages in our dataset, we can immediately notice simple but potentially important differences between the messages in terms of word count, punctuation use, and other attributes that can be easily deduced by merely inspecting the raw data without any need for context.
We extract the number of words in the message, the maximal, minimal, and average word lengths, the number of digits in the message, the number of punctuation marks in the text, the number of capital letters in the text, the number of consecutive repeated characters and check whether the message starts with a capital letter and if it ends with a period.
3.1.2 Important Words
We can gain valuable insight by observing the presence of members from important word groups. We compiled lists of chat usernames used in the discussions, common given names in Slovenia, common curse words used in Slovenia as well as any proper names found in the discussed books. We also created a list of nouns, verbs and adjectives which we observed to be highly discriminative such as misliti (to think), knjiga (book), najljubše (favorite) among others. We noted any presence or absence of words from these lists as features describing the pertaining message.
3.1.3 Multiset-Based Features
The Bag-of-words model and its variations characterize documents by counting the occurrences of each word from a pre-defined set. It is based on the simple assumption that similar documents share a similar vocabulary. We can augment the basic Bag-of-words model by weighing each word in the vocabulary proportional to its rarity in the corpus, using the assumption that rarity implies discriminativity.
We constructed a simple bag-of-words model using unigrams and bigrams. We required both the unigrams and bigrams to appear in at least two messages. All words were converted to lower case, any punctuation and emojis were disregarded and the words were lemmatized before the construction of the model. We also converted any consecutive repeated letters in the words to single occurrences. The resulting model consisted of 2009 unique unigrams and bigrams. We used a similar method to include part-of-speech tagging into our set of considered features. We describe this process in detail in the following subsection.
3.1.4 Part-of-Speech Tagging-Based Features
Part-of-speech tagging is the process of labeling the words in a text based on their corresponding part of speech. Describing each message in terms of its associated part-of-speech labels allows us to use another perspective from which we can view and analyze the corpus. The use of non-standard Slovene and misspellings make part-of-speech tagging a non-trivial task. We attempted to solve the issue by constructing a simple dictionary mapping known non-standard and colloquial versions of Slovene words into their standard equivalents. We constructed the dictionary using the corpus available as part of the JANES project Fišer (2020). Again, we removed any punctuation, repeated characters, and converted the text to lower-case before applying the dictionary. We used a part-of-speech tagger trained on the IJS JOS-1M corpus to perform the tagging Virag (2014). We simplified the results by considering only the part of speech and its type. We characterized each message by the number of occurrences of each label which can be viewed as applying a bag-of-words model with ’words’ being the part-of-speech tags.
3.1.5 Time-Based Features and Models
The features described so far consider each message as an independent unit and do not take into consideration the inherent time dependency. By observing the temporal distribution of labels, we can observe that the labels are not uniformly distributed. Messages relevant to the book seem to appear in clusters and observing a message marked as a question naturally leads us to expect an answer in the subsequent messages. We can use the sequence of labels in the dataset to compute a label transition probability matrix defining a Markov model. We can also compute the conditional probabilities of each label based on the labels of the previous messages. We implemented both models with conditional probabilities computed given the previous 4 labels. We also assigned to each message the number of times the poster has posted in a row and the number of messages authored by the posters in the last 20 messages.
3.2 Class Label Distribution and Resampling
It is important to inspect the distribution of class labels in any dataset and note any severe imbalances that can cause problems in the model construction phase as there may not be enough data to accurately represent the general nature of the underrepresented group. Such imbalances also warrant care in result interpretation.
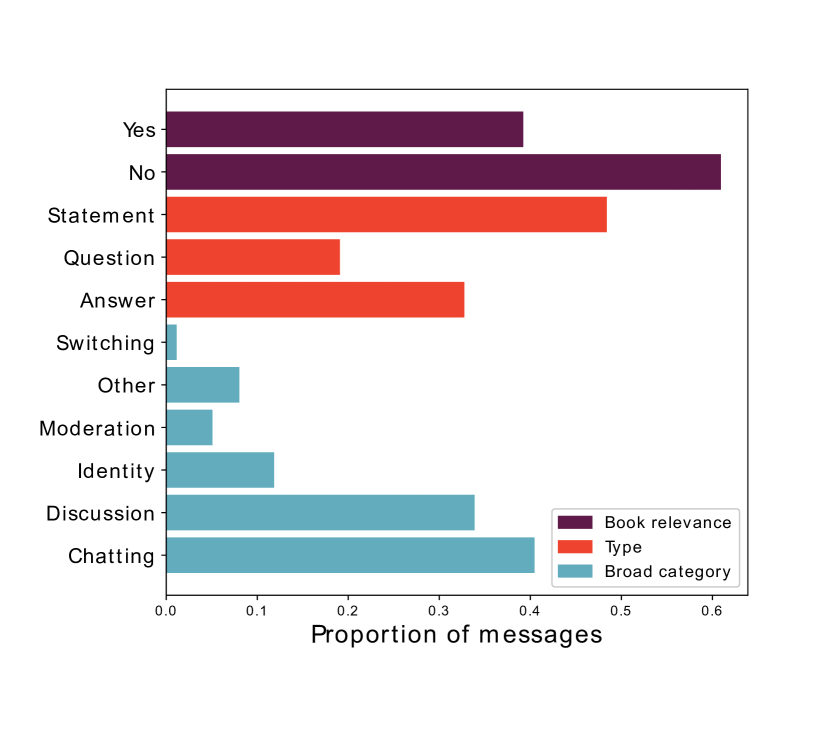
Figure 1 shows the distribution of class labels for each of the prediction objectives. We can see that the distribution of broad category labels is notably imbalanced with 40.3% of messages assigned to the broad category of ’chatting’, but only 1%, 4.5% and 8% to ’switching’, ’moderation’ and ’other’ respectively.
Several methods have been developed to handle such imbalances, the most notable being resampling and the use of cost-sensitive classification methods. Resampling techniques aim to balance the dataset by removing data from the overrepresented classes, generating synthetic data for the minority classes, or both. We evaluate the use of SMOTE resampling in tandem with cleaning unwanted overlap between classes using TOMEK links Batista et al. (2003).
3.3 Feature Ranking and Feature Selection
The relative values of features for building a quality predictive model often vary significantly. Determining the importance of features is a non-trivial task for which many metrics and methods have been proposed. The subset of features used to build the model can have an important effect on its performance and overall usefulness. A model induced on a well-chosen feature subset will be more general and easier to interpret. A notable group of algorithms well-suited for the task of ranking features is the family of Relief-like algorithms which offer performance acceptable for use with large datasets as well as the notable capability of detecting feature-feature interactions. These algorithms work by sampling training data instances and scoring the attributes based on how well they separate the sampled instances from closest instances corresponding to a different class as well as on the similarity to closest instances from the same class by this attribute Kononenko et al. (1997). We use the SWRF* (Sigmoid Weighted ReliefF Star) algorithm to perform the feature ranking Stokes and Visweswaran (2012). We also estimate the importance of features by observing the coefficients of a fitted logistic regression model and analyzing the Gradient boosting model fitted to the training data.
3.4 Prediction Models
The rapidly advancing field of machine learning has produced a myriad of methods that can be used to make predictions in a supervised learning setting. We evaluate the use of well-known classification algorithms such as Random forests, Support vector machines, Gradient boosting, and logistic regression. We also implement and evaluate an ensemble method called Feature stacking that was specially developed for such tasks. It is important to critically compare any results obtained by such sophisticated methods to the outputs of baseline models such as the so-called majority classifier, which always predicts the most common label found in training data with maximal certainty as well as the random-guess or uniform classifier which, predicts the labels uniformly at random. To be useful, any implemented method should be statistically proven to outperform these trivial baselines.
3.4.1 The Feature Stacking Method
A notable algorithm developed for the task of sentence classification that is especially suited for high-dimensional data is the so-called Feature stacking approach Lui (2012) which combines several classifiers each trained on a feature subset and a final classifier that takes as its input the output of these classifiers. The authors of the paper describing the Feature stacking approach suggest using logistic regression as the feature classification method since it makes the method resemble a neural network structure. We use an SVM as the final classifier.
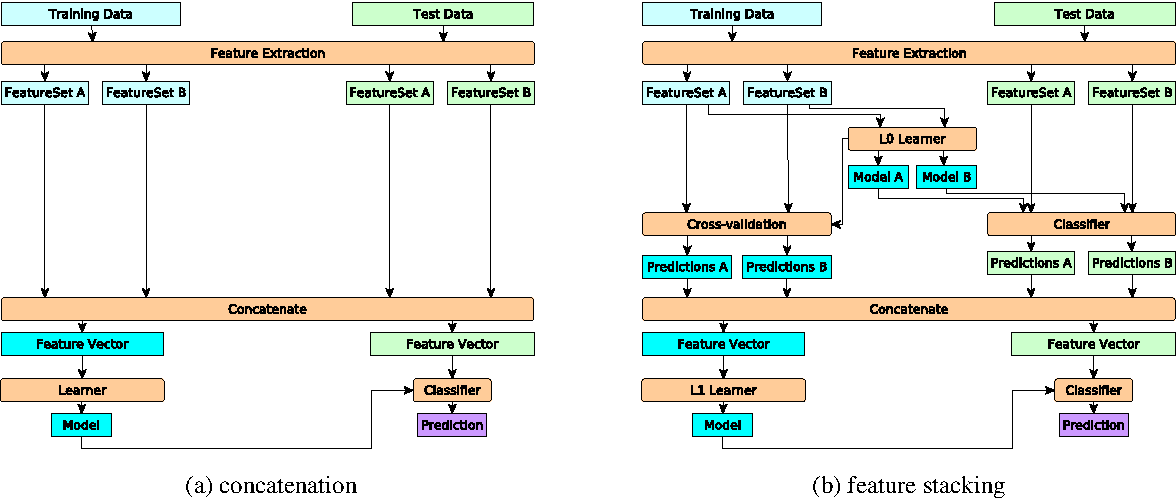
During training, the training data is converted to new features consisting of logistic regression outputs for each feature subset. This is achieved using k-fold cross-validation. Next, logistic regression is fitted to the entire training data feature subsets and is used to encode the test data. A final meta-classifier is fitted to the training data encoded using logistic regression. Test data is first encoded using a trained logistic regression model and finally classified with the meta-classifier. The features stacking method is contrasted with the more typical feature concatenation method on the diagram shown in figure 2.
3.4.2 Utilizing Predictions of Temporal Models
We combined the predictions of the classification model with the probabilities computed using the Markov model and the conditional probabilities by weighing the class probabilities obtained by each method as shown below.
Here, and represents the probability obtained by the classification model and the Markov model respectively. We performed an exhaustive cross-validated grid-search to tune the and parameters of the combined ensemble model.
4 Experiments
4.1 Experimental Setup
We began by building classification models using only general features obtained by observing the word counts, word lengths, and character properties in individual messages. We compared the use of different models and performed feature scoring to rank the perceived usefulness of each feature. All model evaluations were performed using 10 repetitions of 10-fold cross-validation. Explicit comparisons between different methods were made using the Bayesian correlated t-test which can be used to compute probabilities of one method being better than the other and avoids some common pitfalls associated with the more typical frequentist approaches Benavoli et al. (2016). Subsequently, the next batch of features was added to the feature extraction/engineering process and the evaluation process repeated. for the initial feature subset evaluations, we focused exclusively on the book relevance prediction objective. Using the full feature set, we evaluate the best scoring models on all prediction objectives.
4.2 Experimental Results
4.2.1 The Initial Feature Subset
Table 1 shows the results obtained by evaluating the support vector machine model built using the starting set of features. Using the Bayesian correlated t-test, we estimated the support vector machine model to be better than the random forest model with a probability equal to . The probability of the models performing equally was estimated to be . The support vector machine was also estimated to be marginally better than the gradient boosting model with a probability of 0.48 and a probability of 0.47 of them being equal. We did not use the feature stacking method as it is not well defined for data with few features. The model outperformed the baseline random and majority models with an estimated probability of 1.0.
| not relevant | relevant | |
|---|---|---|
| precision | 0.801 | 0.696 |
| recall | 0.807 | 0.691 |
| f1-score | 0.798 | 0.702 |
| support | 215.5 | 138.6 |
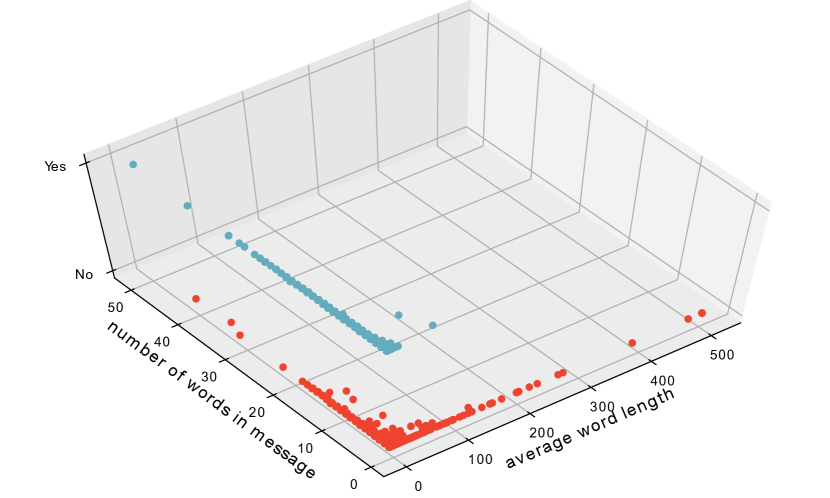
We used the gradient boosting algorithm, logistic regression coefficients, and the SWRF* algorithm to estimate the discriminativity of features in the initial subset. Averaging the estimations, the average word length and the word count of the message were deemed most important, followed by the maximal word length and the amount of punctuation in the message.
Figure 3 shows the separability of relevant and non-relevant messages by the two top-rated features. We can see that a notable portion of non-relevant messages has a considerably higher average word length. This can be explained by observing that many non-relevant messages contain long gibberish words as well as words with consecutively repeated letters.
4.2.2 Including Important Words and User’s Post History
We augmented the initial feature subset with counts of curse words, repeated letters, counts of special verbs and nouns deemed important, such as ’misliti’ (to think), ’knjiga’ (book), counts of common Slovene given names, counts of chat usernames, the number of times the poster posted in a row and the portion of poster’s posts in the last 20 messages. We repeated the evaluation process for the book relevance prediction objective. Using the Bayesian correlated t-test, the SVM classifier was again evaluated to be better by a small margin.
Table 2 shows the results obtained by evaluating the support vector machine model build using the augmented set of features.
| not relevant | relevant | |
|---|---|---|
| precision | 0.825 | 0.731 |
| recall | 0.828 | 0.727 |
| f1-score | 0.826 | 0.728 |
| support | 215.5 | 138.6 |
Using the Bayesian correlated t-test, the support vector machine model built using the augmented feature set was estimated to be better than the one built using the initial feature set with a probability of 0.97. The probability of them being equal was estimated to be 0.02.
4.2.3 Including Bag-of-Words Features
We proceeded by adding the unigram and bigram counts to the feature set. This increased the dimensionality of the dataset substantially by adding 2009 additional features. Using the Bayesian correlated t-test, the feature stacking method was determined as the most probable best classification model.
Table 3 shows the results obtained by evaluating the feature stacking method model build using the enriched set of features.
| not relevant | relevant | |
|---|---|---|
| precision | 0.872 | 0.851 |
| recall | 0.918 | 0.706 |
| f1-score | 0.894 | 0.772 |
| support | 215.5 | 138.6 |
The estimated probability that the new feature set produces a better model is equal to 1.0.
4.2.4 Including Part-Of-Speech Tagging Features
Next, we included the Part-of-Speech tagging based features consisting of the part of speech and its type pair counts. This added 30 additional features. Again, the most probable best model was evaluated to be the feature stacking method.
The comparison between feature stacking method models either using POS tagging-based features or not indicates that the new features do not improve the model for this prediction objective. The probability of the model built using the previous feature set being better is estimated to be 0.25 while the probability of the models being equal is estimated to be 0.67.
4.2.5 Including the Temporal Models
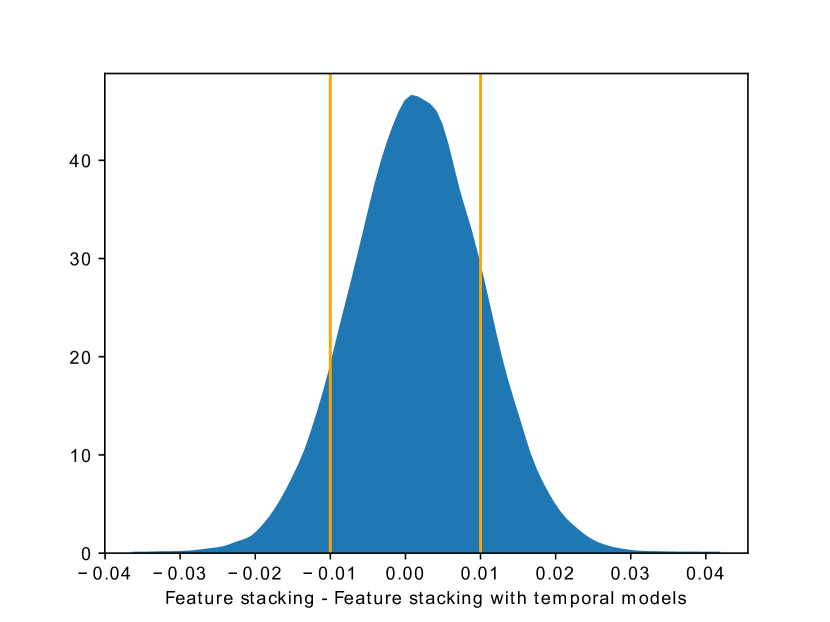
We used an exhaustive, cross-validated grid search to determine the optimal weights of the Markov chain model and the conditional probability-based model, which were estimated to be 0.06 and 0.07 respectively. We compared the feature stacking model with and without the combined use of temporal models using the Bayesian correlated t-test for the book relevance prediction objective. The ensemble model combining the predictions of temporal models was evaluated to be better with a probability of 0.16 while the probability of the models being equal was estimated to be 0.74. The posterior distribution used to compute the probabilities is shown in figure 4.
4.2.6 Evaluating the Models using All Prediction Objectives
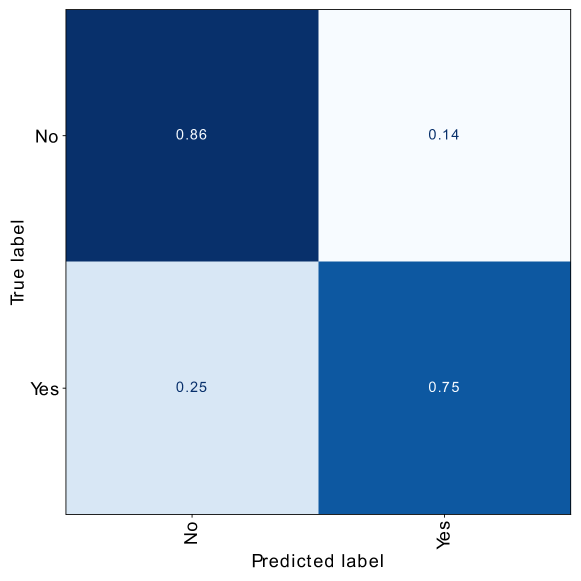
Figure 5 shows the confusion matrix for the book relevance prediction objective using an 80/20 train-test split and the feature stacking method model. It is useful to inspect the messages corresponding to false negatives or false positives and compare them to correctly classified messages to try to determine ways the feature set could be improved. Table 4 lists a subset of false negatives and false positives. We can see that the actual label can be extremely dependent on the context of the conversation which makes it very difficult for a model with limited ability to process such context to correctly classify messages shown in the table.
| Message | Predicted | True |
|---|---|---|
| zakaj | no | yes |
| aja | no | yes |
| prestrašeno | no | yes |
| itak | no | yes |
| MMMMMMMMMMMMMMMMM NE VEM | no | yes |
| Jakob, kaj pomeni razdal? Nadaljuj z branjem, prosim. | yes | no |
| AMPAK POTEM SI UMAZAN | yes | no |
| Odlična ideja, Smartno B19, prosim nadaljuj z branjem. | yes | no |
| SmartnoB23, kaj pa ti meniš o odgovoru na vprašanje? | yes | no |
| jaz se tudi strinjam z smartno 11 | yes | no |
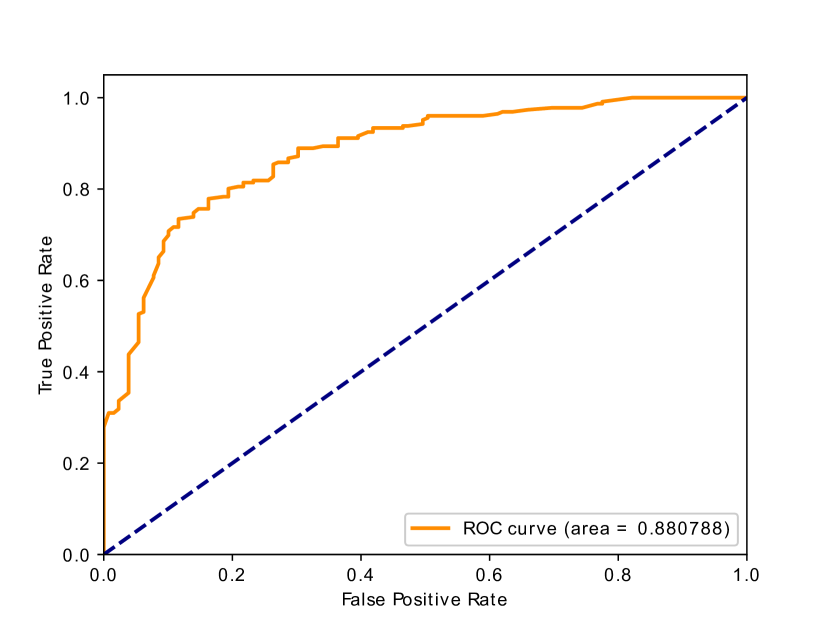
Figure 6 shows the ROC curve and the AUROC value obtained using the same train-test split and model.
We proceeded by evaluating the models using the type and broad category prediction objectives using the full feature set. We report the results for the feature stacking method which was estimated by the Bayesian correlated t-test to have the highest probability of being the best model in the evaluated set of models.
Table 5 shows the results obtained by evaluating the feature stacking method for the message type prediction objective.
| A | Q | S | |
|---|---|---|---|
| precision | 0.708 | 0.773 | 0.784 |
| recall | 0.734 | 0.706 | 0.788 |
| f1-score | 0.718 | 0.737 | 0.785 |
| support | 115.7 | 67.3 | 171.1 |
Figure 7 shows the confusion matrix obtained using a train-test split for this classification objective.
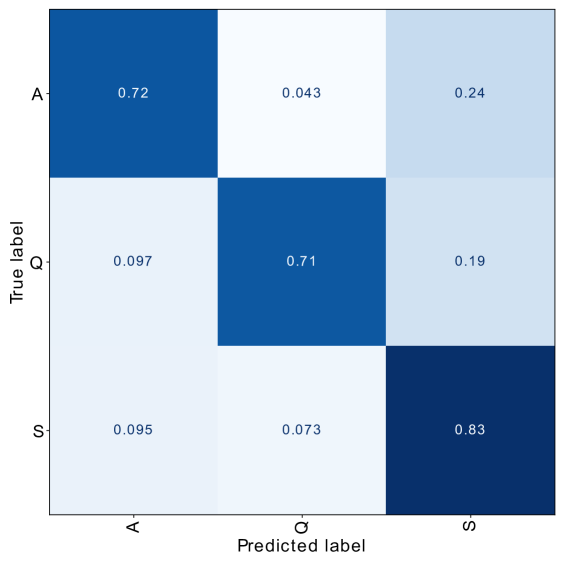
Table 6 shows the results obtained by evaluating the feature stacking method for the broad category prediction objective.
| C | D | I | M | O | S | |
|---|---|---|---|---|---|---|
| precision | 0.632 | 0.683 | 0.895 | 0.878 | 0.859 | 0.0 |
| recall | 0.766 | 0.796 | 0.496 | 0.360 | 0.321 | 0.0 |
| f1-score | 0.691 | 0.735 | 0.635 | 0.503 | 0.460 | 0.0 |
| support | 143.0 | 119.7 | 41.7 | 17.7 | 28.2 | 3.8 |
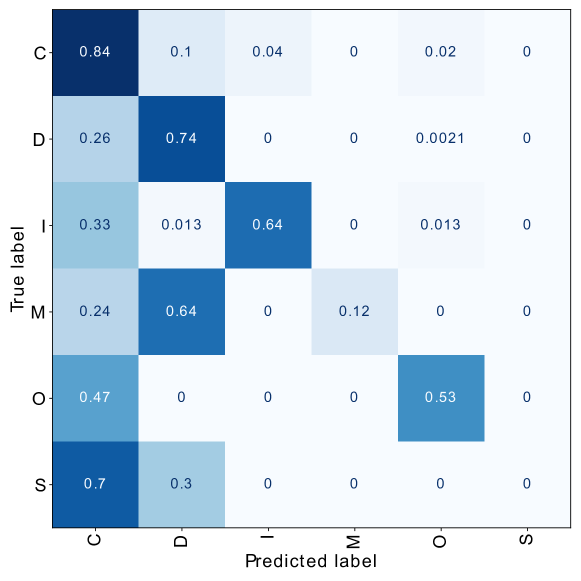
Figure 8 shows the confusion matrix obtained using a train-test split for this classification objective. As stated earlier, it should be noted that the label distribution for this prediction objective is notably imbalanced. Consequently the proportion of samples labeled ’moderation’, ’other’, and ’switching’ in the test set was 6.3%, 4.7%, and 3.2% respectively.
All models outperformed the baselines with the estimated probability of 1.0.
5 Conclusion and Future Work
The best results were achieved by using the Feature stacking method model built on the complete feature subset. The results indicate the performance to be sufficient for the methods to be used in real-world tools and platforms. A significant portion of the information needed for correct classifications is hidden in the strong temporal interdependence of the messages which our developed methods exploited only marginally.
References
- Batista et al. (2003) Gustavo Batista, Ana Bazzan, and Maria-Carolina Monard. 2003. Balancing training data for automated annotation of keywords: a case study. pages 10–18.
- Benavoli et al. (2016) Alessio Benavoli, Giorgio Corani, Janez Demsar, and Marco Zaffalon. 2016. Time for a change: a tutorial for comparing multiple classifiers through bayesian analysis.
- Domingos (2012) Pedro Domingos. 2012. A few useful things to know about machine learning. Commun. ACM, 55(10):78–87.
- Fišer (2020) Darja Fišer. 2020. The janes project. http://nl.ijs.si/janes/. Accessed: 2020-05-1.
- Kadunc (2016) Klemen Kadunc. 2016. Določanje sentimenta slovenskim spletnim komentarjem s pomočjo strojnega učenja.
- Kononenko et al. (1997) Igor Kononenko, Edvard Šimec, and Marko Robnik-Šikonja. 1997. Overcoming the myopia of inductive learning algorithms with relieff. Applied Intelligence, 7(1):39–55.
- Lui (2012) Marco Lui. 2012. Feature stacking for sentence classification in evidence-based medicine. In Proceedings of the Australasian Language Technology Association Workshop 2012, pages 134–138, Dunedin, New Zealand.
- Mclaren et al. (2007) Bruce Mclaren, Oliver Scheuer, Maarten Laat, Rakheli Hever, Reuma Groot, and Carolyn Rosé. 2007. Using machine learning techniques to analyze and support mediation of student e-discussions. pages 331–338.
- Stokes and Visweswaran (2012) Matthew E. Stokes and Shyam Visweswaran. 2012. Application of a spatially-weighted Relief algorithm for ranking genetic predictors of disease. BioData mining, 5(1):20–20.
- Virag (2014) Jernej Virag. 2014. slo_pos. https://github.com/izacus/SlovenianLemmatizer. Accessed on 2019/05/21.
- Yin et al. (2009) Dawei Yin, Zhenzhen Xue, Liangjie Hong, Brian D. Davison, and Lynne Edwards. 2009. Detection of harassment on web 2.0. In Proceedings of the Content Analysis in the WEB 2.