-Machine Learning for Potential Energy Surfaces: A PIP approach to bring a DFT-based PES to CCSD(T) Level of Theory.
Abstract
“-machine learning” refers to a machine learning approach to bring a property such as a potential energy surface (PES) based on low-level (LL) density functional theory (DFT) energies and gradients to close to a coupled cluster (CC) level of accuracy. Here we present such an approach that uses the permutationally invariant polynomial (PIP) method to fit high-dimensional PESs. The approach is represented by a simple equation, in obvious notation , and demonstrated for \ceCH4, \ceH3O+, and and --methyl acetamide (NMA), \ceCH3CONHCH3. For these molecules the LL PES, , is a PIP fit to DFT/B3LYP/6-31+G(d) energies and gradients and is a precise PIP fit obtained using a low-order PIP basis set and based on a relatively small number of CCSD(T) energies. For \ceCH4 these are new calculations adopting an aug-cc-pVDZ basis, for \ceH3O+ previous CCSD(T)-F12/aug-cc-pVQZ energies are used, while for NMA new CCSD(T)-F12/aug-cc-pVDZ calculations are performed. With as few as 200 CCSD(T) energies the new PESs are in excellent agreement with benchmark CCSD(T) results for the small molecules, and for 12-atom NMA training is done with 4696 CCSD(T) energies.
I Introduction
Correcting ab initio-based potential energy surfaces (PESs) has been a long-standing goal of computational chemistry. Several approaches dating from 30 years ago have been suggested. In one, a correction potential is added to an existing PES and parameters of the correction potential are optimized by matching ro-vibrational energies to experiment.Hamilton, Light, and Whaley (1986); Wu and Zhang (1996); Skokov, Peterson, and Bowman (1999) This approach relies on being able to calculate exact ro-vibrational energies to make the comparison with experiment robust. Thus, it has only been applied to triatomic molecules and it is limited to these and possibly tetratomics. Another approach is to modify an existing potential using scaling methods that go under the heading of “morphing”.Gazdy and Bowman (1991); Bowman and Gazdy (1991); Meuwly and Hutson (1999) An impressive example is a PES for HCN/HNC reported by Tennyson and co-workers van Mourik et al. (2001) who morphed a CCSD(T)-based PES.Bowman et al. (1993)
More recent approaches using machine learning (ML) aim to bring a PES based on a low-level of electronic theory to a higher level. As the field moves to consideration of larger molecules and clusters, where high-level methods are prohibitively expensive, the motivation for doing this is obvious. There are two classes of such approaches, one is “-machine learning” (-ML) and the other is “transfer learning”.Pan and Yang (2010) -ML, which is of direct relevance to the present paper, seeks to add a correction to a property obtained using an efficient and thus perforce low-level ab initio theory.Ramakrishnan et al. (2015); Zaspel et al. (2019); Sauceda et al. (2019); Chmiela et al. (2018); Stöhr, Medrano Sandonas, and Tkatchenko (2020); Käser, Unke, and Meuwly (2020) This approach includes an interesting, recent variant based on a “Pople” style composite approach.Zaspel et al. (2019) In this sense the approach is related, in spirit at least, to the correction potential approach mentioned above, when the property is the PES. However, it is applicable to much larger molecules.
The transfer learning approach has been developed extensively in the context of neural networks Pan and Yang (2010) and so much of the work in that field has been brought into chemistry.Smith et al. (2019); Chmiela et al. (2018); Sauceda et al. (2019); Stöhr, Medrano Sandonas, and Tkatchenko (2020); Käser, Unke, and Meuwly (2020) The idea of transfer learning comes from the fact that knowledge gained from solving one problem can often be used to solve another related problem. Therefore, a model learned for one task, e.g., a ML-PES fit to low-level electronic energies/gradients, can be reused as the starting point of the model for a different task, e.g., an ML-PES with the accuracy of a high-level electronic structure theory.
Most work using transfer learning or -ML has been on developing general transferable force fields with application mainly in the area of thermochemistry and molecular dynamics simulations at room temperature and somewhat higher. Meuwly and co-workers have used transfer learning to improve neural network PESs for malonaldehyde, acetoacetaldehyde and acetylacetone.Käser, Unke, and Meuwly (2020)
Here we report a -ML approach for PESs, using the permutationally invariant polynomial (PIP) approach. The PIP approach has been applied to many PESs for molecules, including chemical reactions, dating back roughly 15 years. For reviews see Refs. 17; 18; 19. Recent extensions of the PIP software to incorporate electronic gradientsNandi, Qu, and Bowman (2019a); Conte et al. (2020a) have extended the PIP approach to amino acids (glycine)Conte et al. (2020b) and molecules with 12 and 15 atoms, e.g., -methyl acetamide,Qu and Bowman (2019); Nandi, Qu, and Bowman (2019b); Conte et al. (2020a) tropolone,Houston et al. (2020) and acetylacetone,Qu et al. (2020) respectively. As is widely appreciated in the field, incorporating gradients into fitting requires efficient, low-level electronic structure methods, such as density functional theory or MP2, as these provide analytical gradients.Dral et al. (2020) These levels of theory were used for the PES fits of the three molecules mentioned above.
Our approach is given by the simple equation
| (1) |
where is the corrected PES, is a PES fit to low-level DFT electronic data, and is the correction PES based on high-level coupled cluster energies. The assumption underlying the hoped-for small number of high-level energies is that the difference is not as strongly varying as with respect to nuclear configuration.
We demonstrate the efficacy and high-fidelity of this approach for two small molecules, \ceH3O+ and \ceCH4, and for 12-atom -methyl acetamide (NMA). In all cases is a PIP fit to DFT energies and gradients and is a PIP fit to a much smaller data base of differences between CCSD(T) and DFT energies.
Unlike \ceH3O+ and \ceCH4, for NMA there is no previous CCSD(T)-based PES and so the present CCSD(T)-corrected one is, we believe, the most accurate one available.
II Computational Details
In order to develop a corrected PES we need to generate a data set of high and low-level energies for training and testing. In this study we need both DFT and CCSD(T) data sets. Training is done for the correction PES and testing is done for the corrected . Do note that this two-step “training and testing” is on different data sets. Our objective is to see the impact of the training data set size on the fidelity of the corrected PES for \ceCH4 and \ceH3O+.
For \ceH3O+ CCSD(T) energies are available from our previously reported PES, which is a fit to 32 142 CCSD(T)/aug-cc-pVQZ energies.Yu and Bowman (2016) From this large data set we select 1000 configurations with energies in the range 0 to 24 000 cm-1 for new DFT calculations of energies and gradients. These are done at the efficient B3LYP/6-311+G(d,p) level of theory, using the Molpro quantum chemistry package.Werner et al. (2015) Histograms of the distributions of DFT energies are given in Supplementary Material (SM). Note, these DFT configurations span the same large range of configurations as the much larger CCSD(T) ones, but have less dense sampling.
For \ceCH4 we take the DFT data sets from our recently reported work where the total of 9000 energies and their corresponding gradients were generated from ab initio molecular dynamics (AIMD) simulations, using the B3LYP/6-31+G(d) level of theory.Nandi, Qu, and Bowman (2019a) In that work we reported PES fits using a number of subsets of the DFT data which span the energy 0–15000 cm-1. Here we generate a data set that contains CCSD(T)/aug-cc-pVDZ energies at 3000 configurations, taken from the previous DFT data. A number of training data sets and one test data set, which are subsets of this 3000 data, are employed to examine the -ML procedure. Histogram plots of the distribution of DFT and new CCSD(T)/aVDZ electronic energies are given in SM.
For NMA we make use of previous DFT/B3LYP/cc-pVDZ energies and the corresponding PES that spans both the and isomers and barriers separating them.Nandi, Qu, and Bowman (2019b) New CCSD(T)-F12/aug-cc-pVDZ calculations are done at a sparse set (5430) of configurations that span the full range of configurations used in the previous work. These are used to obtain the PES.
The PIP fits of are done using our recent monomial symmeterization software.Nandi, Qu, and Bowman (2019a); msa (2019) Some details of the PIP bases are given in the next section. We note that they are all small relative to typical PIP bases needed for precise fitting of the full PES for these molecules.
For all molecules the data sets are partitioned into several training and testing subsets to examine how few data are needed for training to get satisfactory results.
III Results
We present root mean square (RMS) errors for relative to direct CCSD(T) energies for a variety of fits. In addition, comparisons are made with direct CCSD(T) results for the geometry and harmonic frequencies of relevant stationary points. To assess the performance of the present approach these results are placed alongside the corresponding DFT ones.
We begin with results for \ceH3O+ which offers a test of the current -ML approach to improve the properties of the minimum and saddle-point barrier separating the two minima.
III.1 \ceH3O+ and \ceCH4
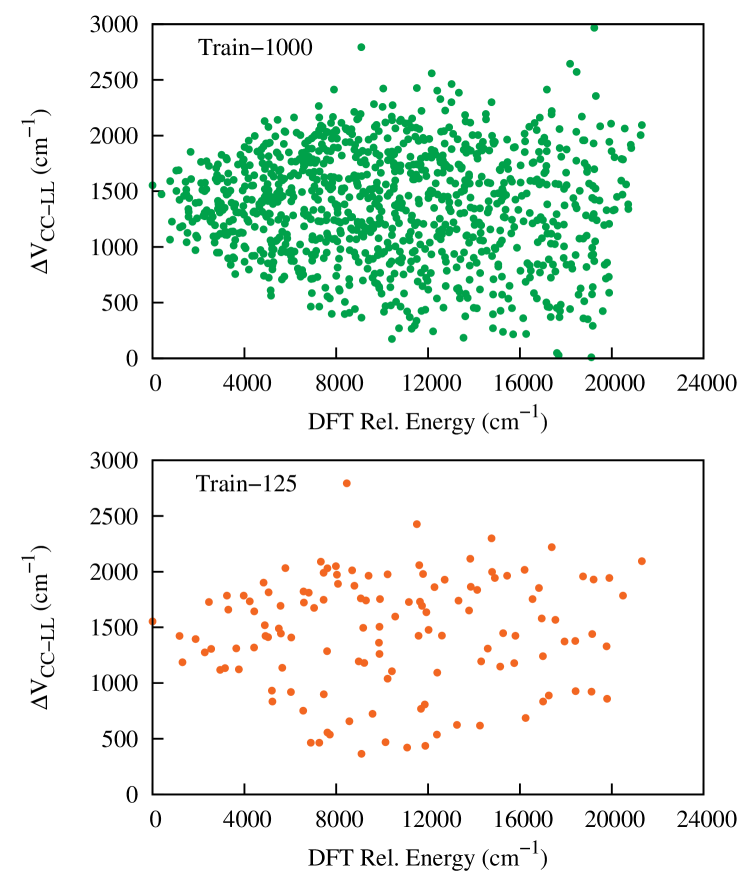
For \ceH3O+ we trained on several sets of the difference of CCSD(T) and DFT absolute energies and then tested on the remaining data from the total of 32 142 configurations. In Fig. 1 we plot versus the DFT energies, relative to the DFT minimum for two training sets. We reference to the minimum of the difference between the CCSD(T) and DFT energies (which is roughly -12 110 cm-1). As seen, the energy range of is about 3000 cm-1, which is much smaller than the DFT energy range relative to the minimum value (which is roughly 23 000 cm-1).
The performance of the fits is evaluated using the training data sets of 1000, 500, 250 and 125 configurations and the corresponding test data sets consist of the remaining data from the total of 32 142 configurations. The corresponding RMS differences between the and CCSD(T) energies are given in Table III in the SM. As seen, the RMS errors are similar for all the training data sets. Results for the training set of only 125 energy differences are particularly encouraging, where the RMS error is just 32 cm-1 for test energies up to 23 000 cm-1. In this case the PIP basis for contains only 51 terms.
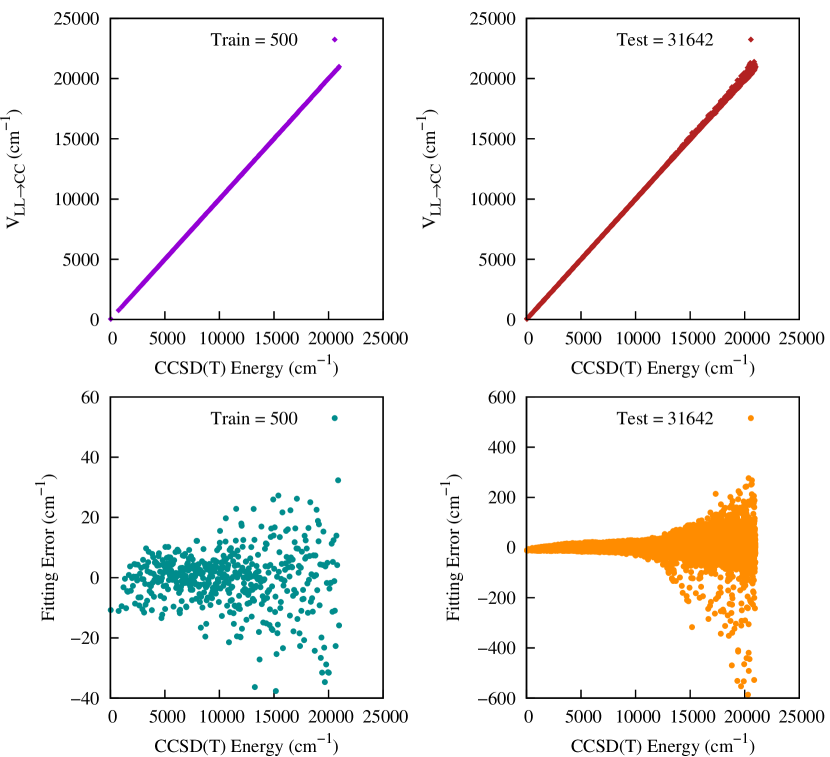
A plot of vs direct CCSD(T) energies for the training set of 500 points and its corresponding test data is shown in Fig. 2. As seen, there is excellent precision; however, we see some large errors for the test data set. These come from high energy configurations which are irrelevant in this study. If needed, one can always improve these errors by adding the high energy data points into the training data set.
An examination of the fidelity of for various properties is given in Tables 1 and 2, for the indicated training sets for . As seen, produces results in excellent agreement with direct CCSD(T) ones and also a large improvement compared to the DFT PES. Most impressive is the high accuracy achieved even with the smallest training data set of 125 energies.
| Geom. Param. | Harmonic Freq. | |||||
|---|---|---|---|---|---|---|
| (O-H) | (H-H) | |||||
| 1000a | -3.0(-5) | -1.8(-4) | 4.8 | 1.8 | -4.4 | 3.3 |
| 500b | -5.0(-5) | -4.4(-4) | 6.2 | 4.7 | 0.02 | 3.5 |
| 250c | -3.0(-5) | -7.8(-4) | 2.6 | 4.8 | 6.3 | 0.02 |
| 125d | 1.0(-5) | 13.3(-4) | -9.1 | -12.1 | -8.6 | 3.02 |
| DFT | -47.8(-4) | -24.1(-3) | 125.9 | 26.5 | 26.5 | 33.7 |
-
a
Maximum polynomial order of 7, basis size of 348.
-
b
Maximum polynomial order of 6, basis size of 196.
-
c
Maximum polynomial order of 5, basis size of 103.
-
d
Maximum polynomial order of 4, basis size of 51.
| Geom. Param. | Harmonic Freq. | ||||||
|---|---|---|---|---|---|---|---|
| (O-H) | (H-H) | (Barrier) | |||||
| 1000a | -5.0(-5) | -9.0(-5) | -3.1i | 3.3 | -6.1 | 1.3 | 2 |
| 500b | -1.0(-5) | -2.0(-5) | -2.6i | 2.0 | -2.2 | -0.7 | 10 |
| 250c | -2.2(-4) | -3.8(-4) | -1.2i | 1.2 | 7.7 | -4.3 | 7 |
| 125d | -1.0(-5) | -1.0(-5) | -0.7i | -3.7 | -3.0 | -4.8 | -9 |
| DFT | -70.6(-4) | -12.2(-3) | 111.3i | 17.6 | 45.5 | 58.7 | 297 |
-
a
Maximum polynomial order of 7, basis size of 348.
-
b
Maximum polynomial order of 6, basis size of 196.
-
c
Maximum polynomial order of 5, basis size of 103.
-
d
Maximum polynomial order of 4, basis size of 51.
Detailed results analogous to those shown for \ceH3O+ above are given for \ceCH4 in the SM. We note here simply that using just 100 CCSD(T)/aVDZ energies for the corrected \ceCH4 PES closes the difference between the DFT PES and direct CCSD(T) results dramatically for both the geometry of the minimum and the harmonic frequencies. For example, the RMS deviation for the harmonic frequencies with respect to the CCSD(T) values is reduced from 31 cm-1 in the DFT PES to about 1 cm-1 for the corrected PES.
Next we present results for the more challenging 12-atom -methyl acetamide PES.
III.2 -methyl acetamide, \ceCH3CONHCH3
We recently reported DFT-based PESs for 12-atom -methyl acetamide (NMA) using full and fragmented PIP basis sets.Qu and Bowman (2019); Nandi, Qu, and Bowman (2019b) The idea of using a fragmented basis to extend the PIP approach to molecules with more than 10 atoms was illustrated for NMA. The data set for the more recent PES, which describes the and minima as well as saddle points separating them, consisted of energies and gradients. The full basis of maximum polynomial order of 3 has 8040 linear coefficients. The fragmented PIP basis, also with a maximum polynomial order of 3, contains 6121 coefficients.
The fits were done using 6607 energies and corresponding 237 852 gradient components for a total data size of 244 459. These data were obtained from direct dynamics, using the B3LYP/cc-pVDZ level. Clearly a data set of this size from CCSD(T) calculations is not feasible and so the present approach is needed in order to bring this DFT-based PES close to CCSD(T) quality.
For the training and testing we calculated a total of 5430 CCSD(T)-F12/aug-cc-pVDZ energies. Training of was done on 4696 data points of the difference of direct CCSD(T) and DFT-PES absolute energies. Testing of was done on 734 energies. The distribution of the electronic energies (shown in SM) for both the training and test data sets spans the large range of configurations used for the DFT-based PES, i.e., and isomers and their isomerization TSs.
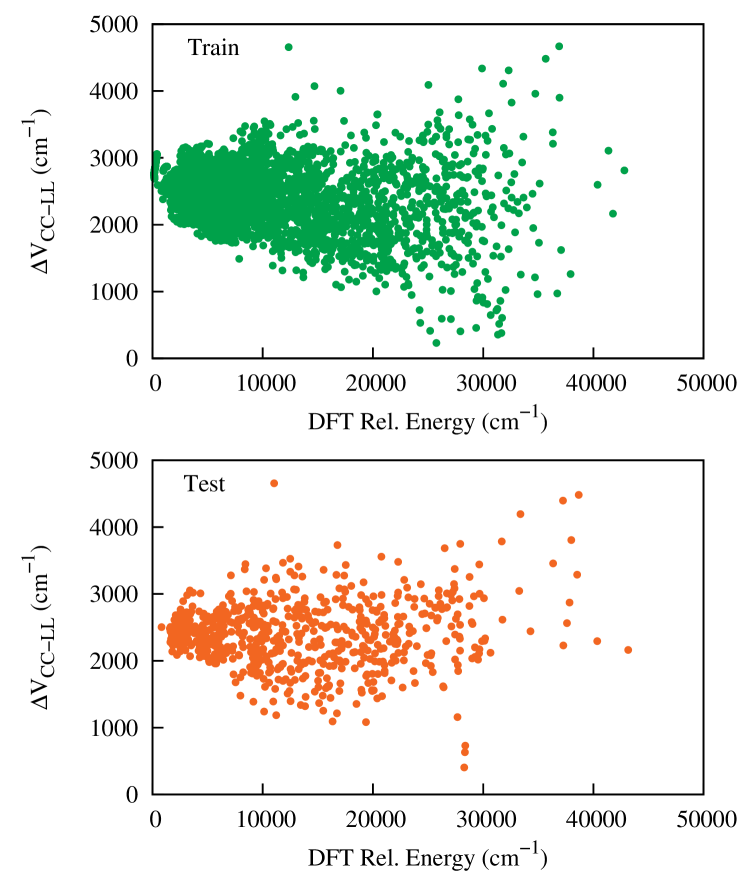
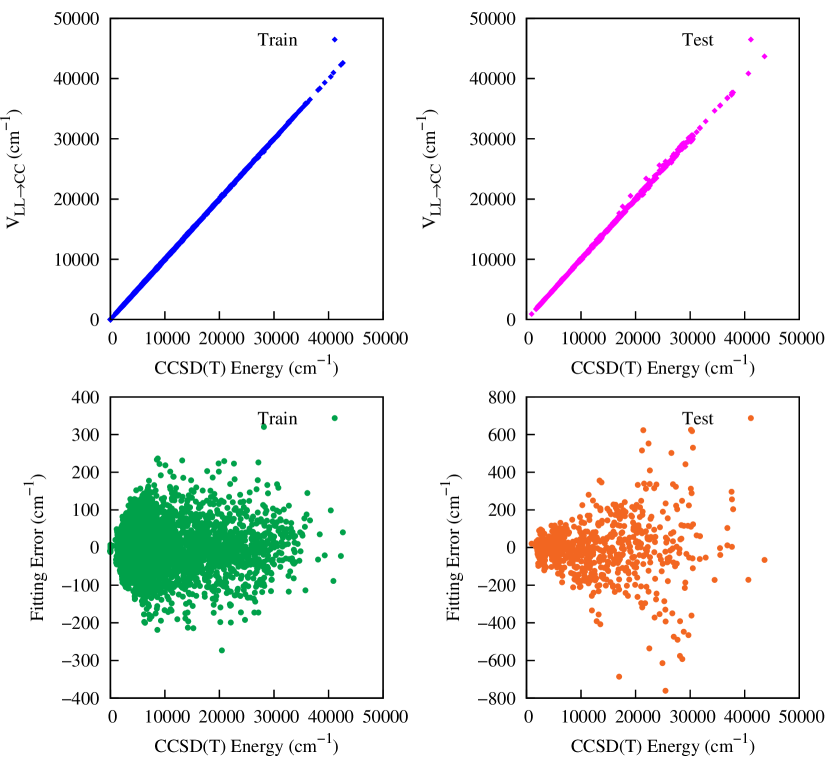
In Fig. 3 we show the range of versus the DFT energies, relative to the DFT minimum for the training and test data sets. We reference to the minimum of the difference of the CCSD(T) and DFT energies (which is roughly -50 580 cm-1). As seen, the energy range of is about 4500 cm-1, which is much smaller than the DFT energy range relative to the minimum value (which is roughly 50 000 cm-1). The PIP basis to fit the is generated using MSA software with the same reduced permutational symmetry of 31111113 (this describes the identity of the hydrogen atoms within a methyl group which is essential to get the three fold torsional barrier) used previously but and a maximum polynomial order of 2. This leads to 569 linear coefficients (PIP basis). The fitting RMS error of this is 57 cm-1. A plot of vs direct CCSD(T) energies for the training and test data is shown in Fig. 4. The RMS differences between the and direct CCSD(T) energies for the training and test data sets are 57 and 147 cm-1, respectively. A slight increment of the test RMS error is comparable with the DFT PES RMS error of 126 cm-1.
We perform geometry optimization and normal mode analyses for both and isomers using this -ML PES and we get significant improvement from the DFT PES, which predicts an incorrect minimum for the -isomer. Specifically, the torsion angle of one methyl rotor is shifted by 60 deg relative to the CCSD(T) structure. These differences in structure are shown in the SM, while more discussion of the torsional barriers is given below.
The - energy difference on the corrected PES is 782 cm-1, which is 41 cm-1 below the direct CCSD(T) one. The RMS errors of harmonic frequencies between direct CCSD(T) one and the -ML one are 15 and 13 cm-1, respectively, for and isomers, whereas, these are 26 and 17 cm-1 for the DFT PES (the complete list of harmonic frequencies for - and -NMA with corresponding ab initio ones are given in Tables IV and V of the SM). The geometry differences are comparably small for the -isomer but large for the DFT PES for the -isomer, owing mainly to the error in the methyl rotor minimum on the DFT PES, noted already.
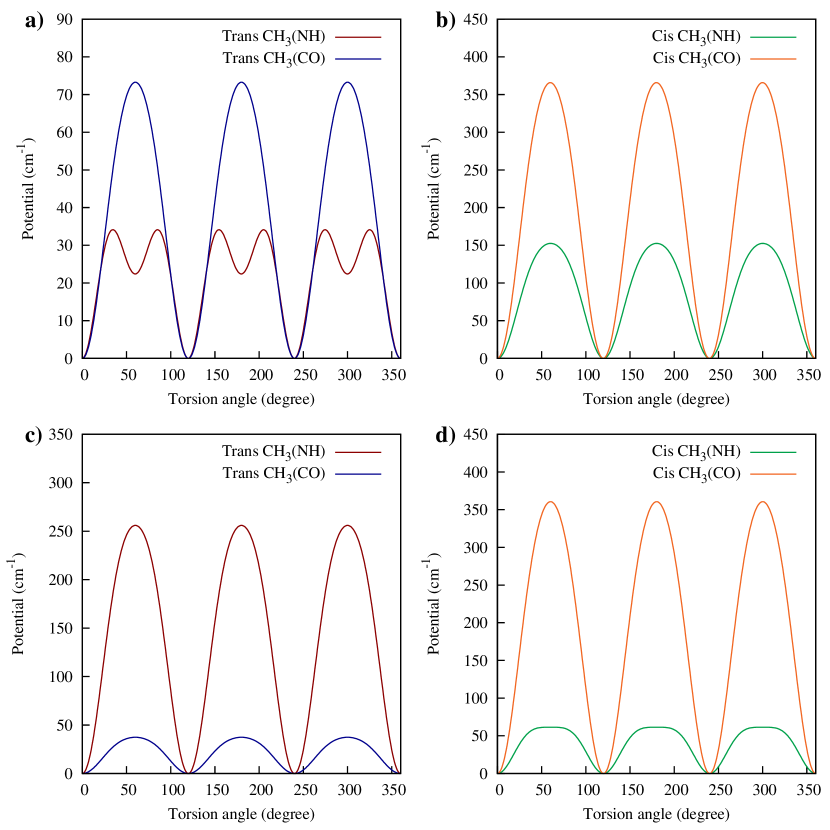
Detailed comparisons of the partially relaxed torsional barriers are given in Table 3. As seen, there are large differences between the DFT PES and CCSD(T) results for the \ceCH3-NH rotors for both and isomers. Overall, the -ML PES barriers are significantly closer to the CCSD(T) ones than the DFT-PES ones.
| -NMA | \ceCH3-NH | \ceCH3-CO |
|---|---|---|
| DFT PES | 256 | 37 |
| -ML PES | 34 | 74 |
| CCSD(T) | 42 | 103 |
| -NMA | \ceCH3-NH | \ceCH3-CO |
| DFT PES | 61 | 361 |
| -ML PES | 153 | 366 |
| CCSD(T) | 148 | 303 |
Given the error in these DFT PES barriers, a detailed examination of the torsional potentials is warranted. These are shown in Fig. 5. These appear as would be expected, with the exception of panel a), where the -ML potential has a small dip at 60 deg, instead of a barrier there. The barrier of 34 cm-1 given in Table 3 is thus at slightly the wrong location. The source of this offset is the large error in the DFT PES, which has a minimum 60 deg in error compared to the benchmark CCSD(T) result. The small artifact in the -ML torsional potential is of minor consequence given that the CCSD(T) barrier is only 42 cm-1.
To the best of our knowledge there is no experimental determination of these torsional barriers for either isomer of NMA. However, there is a report of the torsional barrier for acetamide of 24 cm-1.Suenram et al. (2001) This barrier is consistent with the small barriers of 34 cm-1 (-ML PES) and 74 cm-1 (-ML PES) for -NMA. Also, it appears that the larger barriers for -NMA may be due to the closer proximity of these methyl rotors.
Next we make some comments about computation times on our cluster with Intel Xeon 2.40 GHz processors. First, to calculate the 5430 CCSD(T) energies required about 900 cpu-hours. (This was done using multiple nodes.) The time for 100 000 calculations of the corrected PES, , is the sum of 2.056 seconds for the DFT PES, , plus 0.126 seconds for the PES. Thus, the PES takes only 6 of the total cpu time.
To conclude this section, we note that preliminary work indicates that using about half the number of CCSD(T) energies, i.e., 2200 energies, produces a PES that is close to the quality of the one reported here. We plan to report the details of this along with even smaller data sets later.
IV Summary and Conclusions
We reported an efficient and easy-to-implement correction to a low-level DFT PES based on a low-order PIP fit to the difference in a sparse set of high-level CCSD(T) and DFT energies. The correction was shown to produce a final PES with properties that are close to the corresponding CCSD(T) benchmark values for \ceCH4 and \ceH3O+. Similar results were shown for -methyl acetamide and this demonstrates that the approach should be widely applicable to large molecules. We plan to do this in the future for acetylacetone and tropolone, for which low-level PESs have recently been reported.Conte et al. (2020a); Houston et al. (2020); Qu et al. (2020) However, it would be difficult to present the rigorous tests against high-level coupled cluster results for say harmonic frequencies as these require a very large computational effort.
Finally, we note that the low-level PES can be based on any fitting method as can the correction PES. However, both should be consistent with respect to the same level of permutational invariance. We believe the PIP approach has advantages for the correction PES. One is that the fit is permutationally invariant and another, and perhaps more significant one, is that a low-order PIP fit can be both precise and efficient to evaluate.
Supplementary Material
The supplementary material contains details of training and testing for \ceCH4, \ceH3O+ and N-methyl acetamide as well as harmonic frequencies.
Acknowledgment
JMB thanks NASA (80NSSC20K0360) for financial support
Data Availability
The data that support the findings of this study are available from the corresponding author upon reasonable request. The new -ML PES for NMA is provided as supplementary material.
References
- Hamilton, Light, and Whaley (1986) I. P. Hamilton, J. C. Light, and K. B. Whaley, J. Chem. Phys. 85, 5151 (1986).
- Wu and Zhang (1996) Q. Wu and J. Z. Zhang, Chem. Phys. Letts 252, 195 (1996).
- Skokov, Peterson, and Bowman (1999) S. Skokov, K. A. Peterson, and J. M. Bowman, Chem. Phys. Letts 312, 494 (1999).
- Gazdy and Bowman (1991) B. Gazdy and J. M. Bowman, J. Chem. Phys. 95, 6309 (1991).
- Bowman and Gazdy (1991) J. M. Bowman and B. Gazdy, J. Chem. Phys. 94, 816 (1991).
- Meuwly and Hutson (1999) M. Meuwly and J. M. Hutson, J. Chem. Phys. 110, 8338 (1999).
- van Mourik et al. (2001) T. van Mourik, G. J. Harris, O. L. Polyansky, J. Tennyson, A. G. Császár, and P. J. Knowles, J. Chem. Phys. 115, 3706 (2001).
- Bowman et al. (1993) J. M. Bowman, B. Gazdy, J. A. Bentley, T. J. Lee, and C. E. Dateo, J. Chem. Phys. 99, 308 (1993).
- Pan and Yang (2010) S. J. Pan and Q. Yang, IEEE Trans. Knowl. Data Eng. 22, 1345 (2010).
- Ramakrishnan et al. (2015) R. Ramakrishnan, P. O. Dral, M. Rupp, and O. A. von Lilienfeld, J. Chem. Theory Comput. 11, 2087 (2015).
- Zaspel et al. (2019) P. Zaspel, B. Huang, H. Harbrecht, and O. A. von Lilienfeld, J. Chem. Theory and Comput. 15, 1546 (2019).
- Sauceda et al. (2019) H. E. Sauceda, S. Chmiela, I. Poltavsky, K.-R. Müller, and A. Tkatchenko, J. Chem. Phys. 150, 114102 (2019).
- Chmiela et al. (2018) S. Chmiela, H. E. Sauceda, K.-R. Müller, and A. Tkatchenko, Nat. Commun. 9, 3887 (2018).
- Stöhr, Medrano Sandonas, and Tkatchenko (2020) M. Stöhr, L. Medrano Sandonas, and A. Tkatchenko, J. Phys. Chem. Letts. 11, 6835 (2020).
- Käser, Unke, and Meuwly (2020) S. Käser, O. Unke, and M. Meuwly, New Journal of Physics 22, 055002 (2020).
- Smith et al. (2019) J. S. Smith, B. T. Nebgen, R. Zubatyuk, N. Lubbers, C. Devereux, K. Barros, S. Tretiak, O. Isayev, and A. E. Roitberg, Nat. Commun. 10, 2903 (2019).
- Braams and Bowman (2009) B. J. Braams and J. M. Bowman, Int. Rev. Phys. Chem. 28, 577 (2009).
- Bowman, Czaḱo, and Fu (2011) J. M. Bowman, G. Czaḱo, and B. Fu, Phys. Chem. Chem. Phys. 13, 8094 (2011).
- Qu, Yu, and Bowman (2018) C. Qu, Q. Yu, and J. M. Bowman, Annu. Rev. Phys. Chem. 69, 6.1 (2018).
- Nandi, Qu, and Bowman (2019a) A. Nandi, C. Qu, and J. M. Bowman, J. Chem. Theor. Comp. 15 (2019a).
- Conte et al. (2020a) R. Conte, C. Qu, P. L. Houston, and J. M. Bowman, J. Chem. Theory Comput. 16, 3264 (2020a).
- Conte et al. (2020b) R. Conte, P. L. Houston, C. Qu, J. Li, and J. M. Bowman, J. Chem. Phys. 153, 244301 (2020b).
- Qu and Bowman (2019) C. Qu and J. M. Bowman, J. Chem. Phys. 150, 141101 (2019).
- Nandi, Qu, and Bowman (2019b) A. Nandi, C. Qu, and J. M. Bowman, J. Chem. Phys. 151, 084306 (2019b).
- Houston et al. (2020) P. L. Houston, R. Conte, C. Qu, and J. M. Bowman, J. Chem. Phys. 153, 024107:1 (2020).
- Qu et al. (2020) C. Qu, R. Conte, P. L. Houston, and J. M. Bowman, Phys. Chem. Chem. Phys. , (2020).
- Dral et al. (2020) P. O. Dral, A. Owens, A. Dral, and G. Csányi, J. Chem. Phys. 152, 204110 (2020).
- Yu and Bowman (2016) Q. Yu and J. M. Bowman, J. Chem. Theory Comput. 12, 1549 (2016).
- Werner et al. (2015) H.-J. Werner, P. J. Knowles, G. Knizia, F. R. Manby, and M. Schütz, “Molpro, version 2015.1, a package of ab initio programs,” (2015), see http://www.molpro.net.
- msa (2019) “Msa software with gradients,” https://github.com/szquchen/MSA-2.0 (2019), accessed: 2019-01-20.
- Suenram et al. (2001) R. Suenram, G. Golubiatnikov, I. Leonov, J. Hougen, J. Ortigoso, I. Kleiner, and G. Fraser, J. Molec. Spec. 208, 188 (2001).