Ab initio hydrogen dynamics and the morphology of voids in amorphous silicon
Abstract
This paper presents an ab initio study of hydrogen dynamics inside nanometer-size voids in a-Si within the framework of the density-functional theory for a varying hydrogen load of 10 to 30 H atoms/void at the low and high temperature of 400 K and 700 K, respectively. Using the local density approximation and its generalized-gradient counterpart, the dynamics of hydrogen atoms inside the voids are examined with an emphasis on the diffusion of H atoms/molecules, and the resulting nanostructural changes of the void surfaces. The results from simulations suggest that the microstructure of the hydrogen distribution on the void surfaces and the morphology of the voids are characterized by the presence of a significant number of monohydride Si–H bonds, along with a few dihydride Si–H2 configurations. The study also reveals that a considerable number (about 10–45 at. %) of total H atoms inside voids can appear as H2 molecules for a hydrogen load of 10–30 H atoms/void. The approximate shape of the voids is addressed from a knowledge of the positions of the void-surface atoms using the convex-hull approximation and the Gaussian broadening of the pseudo-atomic surfaces of Si and H atoms.
I Introduction
Hydrogen plays an important role in the electronic and optical properties of amorphous silicon (a-Si) [1]. While the addition of a small amount (about 6–12 at. %) of hydrogen in a-Si is particularly beneficial for producing device-grade samples of a-Si:H, via passivation of coordinating defects (e.g., 3-fold-coordinated Si atoms or dangling bonds), the presence of too much hydrogen in a-Si can be detrimental to the electronic and optical properties of a-Si:H-based devices. Thin films of a-Si:H are often employed for surface passivation of crystalline silicon, which is useful for the generation of high open-circuit voltages in silicon-heterojunction solar cells [2]. A relatively high hydrogen content, in void-rich environment of a-Si:H, is preferred for this purpose to achieve high-quality a-Si:H/c-Si interfaces [3], indicating the benevolent role of H in a-Si. By contrast, the structure of a-Si:H is altered by the light-induced creation of metastable defect states, known as the Staebler-Wronski effect (SWE) [4], which adversely affects the performance of a-Si:H-based solar cells. Nuclear magnetic resonance (NMR) studies [5] on a-Si:H samples have indicated that the motion of H atoms, which are produced by the light-induced breaking of Si-H bonds, plays an important part in recovering the photovoltaic stability of the affected a-Si:H samples upon annealing at 350∘–400∘ C [6]. Thus, an understanding of the motion of H atoms in a-Si in the presence of inhomogeneities is of crucial importance to address the photovoltaic stability of a-Si:H upon light irradiation.
While a number of earlier theoretical/computational studies on the microstructure of hydrogen distributions in a-Si:H [7, 8, 9, 10, 11, 12] have focused on the silicon-hydrogen bonding configurations in the bulk network environment of a-Si and their effects on structural, electronic, and optical properties of the material, there exist only a few computational studies that directly address the role of non-bonded hydrogen (NBH) and voids on the network structure of a-Si:H [10, 13, 14]. Sekimoto et al. [15] have recently shown experimentally that the presence of large amount of non-bonded hydrogen (e.g., H2 molecules inside voids) can broaden the vacancy-size distribution and enhance the size of the optical gap [16] in a-Si. The density of a-Si:H has been also found to be somewhat dependent on the number of NBH, and hence on the distribution of hydrogen inside nanometer-size voids. Following our recent studies on the temperature-induced nanostructural evolution of voids in a-Si [11], and its effect on the intensity of small-angle X-ray scattering (SAXS) [17], the present study focuses on accurate calculations of the atomistic dynamics of hydrogen inside voids obtained from the density-functional theory. The emphasis here is on the dynamical aspects of hydrogen motion inside voids on the time scale of several picoseconds at low and high temperature in the environment of a varying concentration of H atoms. The formation and dissociation of Si–H bonds on the surface of voids are discussed from a kinetic point of view. The movement of H atoms inside nanometer-size voids and its resulting effects on the hydrogen microstructure and the reconstruction of the void surfaces are also addressed in this study.
The presence of voids in the amorphous matrix suggests that, for an accurate determination of the motion of H atoms within a void, one must take into account the inhomogeneities in the electronic charge distribution in the vicinity of void surfaces. The standard protocol in density-functional calculations advises us to address the problem by computing the self-consistent-field (SCF) solution of the Kohn-Sham (KS) equation, and the presence of voids suggests that the generalized-gradient approximation (GGA) should be employed in order to deal with the atomic density fluctuations near the void surfaces. We shall therefore address the problem using the GGA and compare the results with those from the local density approximation (LDA). The presence of weak dispersion forces, which are often included via the Van der Waals corrections, are not taken into account in this study owing to the computational complexity of the problem and the somewhat limited accuracy of local basis functions that we have used in this study.
The rest of the paper is organized as follows. Section II provides a short description of the method for generating a-Si models with hydrogenated voids, using the Wooten-Winer-Weaire (WWW) method and ab initio molecular dynamics simulations (AIMD). The results are discussed in sec. III, with an emphasis on the dynamics of H atoms inside voids in IIIA, kinetics of Si–H bond formation and dissociation in IIIB, and the microstructure of the hydrogen distribution for a varying number of hydrogen atoms in IIIC. A brief discussion on the shape of the voids is also provided in IIIC. This is followed by the conclusions of the study in sec. IV.
II Method
For AIMD simulations of hydrogen dynamics inside voids in a-Si, we started with four independent 1000-atom models of a-Si, obtained from the WWW method [18, 19]. A spherical void of radius 5 Å was created at the center of each model and the geometry of the resulting structure was thoroughly relaxed, using the first-principles density-functional code Siesta [20]. A number of models with a hydrogenated void were then produced by adding 10, 20, and 30 H atoms inside the central cavity so that the mass density of the final models is about 2.22 g.cm-3. A single void of radius 5 Å corresponds to a number density of voids.cm-3 and a void-volume fraction of 2.52 at. %, which are close to the values reported in experiments [21, 22]. The H atoms were initially distributed in such a way that they were at a distance of at least 2 Å from Si atoms and 1 Å from each other. The silicon atoms within the spherical region of radius between 5 Å and 8 Å from the center of the voids are labeled as the void-surface atoms for the analysis of the void surface upon annealing and total-energy optimization of the systems [23].
To study hydrogen diffusion and the microstructure of hydrogen distribution on the void surfaces, AIMD simulations were performed at 400 K and 700 K to examine the temperature dependence of H dynamics and the resulting effects on the morphological structure of the void surfaces, using the density-functional code Siesta. Siesta employs local basis functions, based on numerical pseudoatomic orbitals [24], and the norm-conserving Troullier-Martins pseudopotentials [25] in order to obtain the self-consistent-field (SCF) solution of the Kohn-Sham equation in the density-functional theory. Electronic and exchange correlations between electrons were taken into account via the LDA and the GGA, by using the Perdew-Zunger [26] and the PBE [27] parameterizations for the LDA and the GGA, respectively. Owing to the computational complexity of the problem involving a large number of atoms and the necessity for simulating a reasonably long-time dynamics for studying the equilibrium distribution of H atoms, using the SCF solution of the KS equation, the AIMD simulations were conducted using the single-zeta (SZ) basis functions for Si atoms and the double-zeta-polarized (DZP) basis functions for H atoms. The high computational cost associated with the calculation of total energy and forces restricts us to use SZ basis functions for Si atoms during the course of AIMD simulations. The subsequent total-energy optimizations, however, were conducted using the double-zeta (DZ) basis functions for Si atoms until the total force on each atom was less than or equal to eV.Å-1. During AIMD simulations, the temperature of the system was controlled in NVT ensembles by using the Nosé thermostat [28], and a time step of 0.8 fs was used to ensure that the movement of light H atoms can be described accurately at the high temperature of 700 K. The evolution of the system was monitored and recorded for a total time of 20 ps. The simulation procedure was repeated for each of the four independent models with a void at the center, indicated by M1 to M4 hereafter, for a hydrogen load of 10, 20, and 30 H atoms/void. In each case, we have used a different random distribution of H atoms within the void in order to gather as much as statistics as possible. The final results were obtained by averaging over four independent configurations.
III Results and Discussion
III.1 Hydrogen dynamics inside voids in a-Si
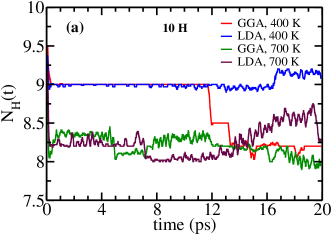
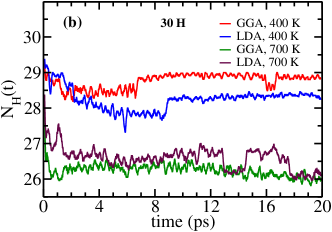
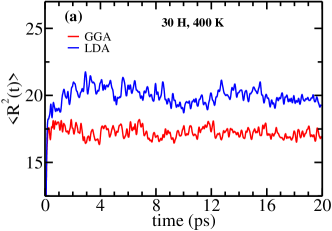
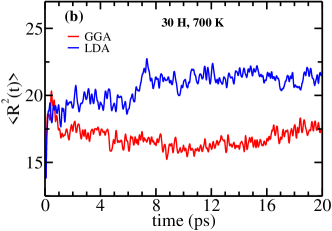
In this section, we discuss the results from the density-functional calculations for studying the dynamics of H atoms/molecules inside voids in a-Si. To this end, we mostly focus on those H atoms/molecules which are within the cavity during the entire course of simulations at a low and high temperature of 400 K and 700 K, respectively. Figure 1 shows the time evolution of the average number of H atoms (molecules included) within a void-surface region of radius 8 Å at 400 K and 700 K. The results correspond to two different values of the hydrogen load, 10 and 30 H atoms/void, and are obtained by averaging over 4 independent voids/models using the LDA and GGA. At 400 K, the great majority of H atoms stayed within the void, with the exception of one or two H atoms that left the void-surface region of radius 8 Å. The LDA and GGA dynamics exhibit a more or less similar behavior at a given temperature, although the GGA tends to knock out one or two more H atoms outside the cavity for high H loads at 700 K (see Fig. 1b). Despite limited statistics, it would not be inappropriate to conclude that, on average, the LDA and GGA do not differentiate much as far as the (average) number of H atoms leaving the voids at 400 K is concerned.
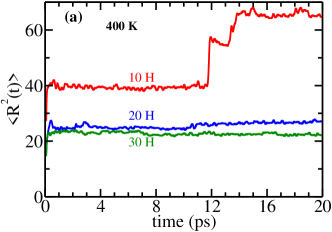
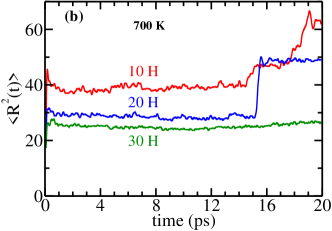
To study the effect of the hydrogen load on the mean-square displacement (MSD) of H atoms at the low and high temperature of 400 K and 700 K, respectively, we have examined the variation of the MSD with time for 10, 20, and 30 H atoms/void using the GGA. Once again, the results were obtained by averaging over 4 independent voids and are presented in Fig. 2. The results (in Fig. 2) lead to the following observations. Firstly, the MSD of H atoms decreases with an increasing presence H atoms within the voids. This is particularly so as the hydrogen load increases from 10 H atoms/void to 30 H atoms/void. This reduction in the MSD is due to the decrease of the average distance between any two H atoms within the cavity for an increasing presence of hydrogen within the same volume. Secondly, the sharp rise of the MSD for a hydrogen load of 10 H atoms/void near 12 ps at 400 K can be attributed to a hydrogen atom leaving the void. For a hydrogen load of 10 H atoms/void, H atoms can move somewhat more freely than those with a load of 20 or 30 H atoms/void. This makes it possible for few H atoms to diffuse rapidly in the vicinity of the void surface, and eventually to escape the void region – and the simulation cell in one or two cases – depending upon the temperature of the system. In contrast, the presence of too many H atoms for a high value of H load can impede the diffusion process and thus reduces the MSD at a given temperature. Thirdly, the motion of H atoms are affected by the temperature of the system as well. This is evident in Fig. 2(b), where the MSD for a load of 20 H atoms/void was observed to increase at 700 K during 15 to 16 ps and it continued to remain so until the end of the simulation at 20 ps. This observation contrasts with the case of 30 H atoms/void at the same temperature, where none of the H atoms was found to leave the void but remained within a root-mean-square (RMS) distance of 5 Å from the center of the void. Finally, one may note that the available statistics do not permit us to comment on the dynamical behavior of few H atoms that diffuse out of the cavity at an earlier time (e.g., the H atom in Fig. 2(a) for a hydrogen load of 10 atoms/void), based on the results from 4 configurations. The movement of H atoms is driven by a combination of factors, such as the concentration of H atoms in a void, temperature, and the disorder in the atomic distribution on the void surfaces. Since we are not particularly interested in the dynamical behavior of few H atoms that escape the void-surface region of 8 Å, we will not discuss this further.
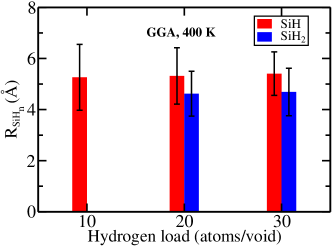
Having discussed the variation of the MSD with respect to the hydrogen load, we now address to what extent the exchange-correlation (XC) approximation may affect the motion of H atoms inside the voids as far as the MSD is concerned. Figure 3 shows the evolution of the MSD with time for a hydrogen load of 30 H atoms/void at 400 K and 700 K. Since we are interested in the dynamics of H atoms inside the void, and the resulting hydrogen microstructure of the void surface, the MSD was computed using only those H atoms that were inside the void region of radius 8 Å for the entire duration of simulation. The plots in Fig. 3 suggest that the LDA slightly overestimates the MSD (of H atoms) compared to the value obtained from the generalized-gradient approximation (GGA). The RMS values of the displacement of H atoms inside the voids in the LDA and the GGA at 400 K have been found to be about 4.5 Å and 4.15 Å, respectively. A more or less similar observation applies to the high-temperature dynamics at 700 K, as shown in Fig. 3(b). It thus appears that the MSD of the H atoms within the void is not particularly strongly affected by the XC approximation at 400 K and 700 K. This is due to the fact that the majority of H atoms within a void reside as bonded hydrogen (to Si atoms) on the void surface, mostly in the form of Si–H configurations, and few Si–H2 configurations, along with a few H2 molecules within the cavity. Since the calculation of the MSD excludes a few mobile H atoms that have already left the void region, the remaining bonded H atoms (on the void-surface) show a more or less converged value of the MSD during the course of simulations. Thus, in a sense, a more or less converged value of the MSD (in Fig. 3) is reflective of the distribution of bonded H atoms on the walls of the void. We shall see later that a slightly larger value of the MSD of H atoms that we observe here for the LDA case (see Fig. 3) results from a minor expansion of the void surface in the LDA calculations. Following Sekimoto et al. [15], one may conclude that the expansion originates from the stress on the void surface due to the presence of a significant number of Si–H bonds in the LDA calculations. Finally, it may be mentioned that the dihydride Si–H2 configurations are found on the void surface at a distance, which is closer to the center of the void than their monohydride (Si–H) counterpart. Figure 4 shows the average distances of the Si–H2 and Si–H bonding configurations, which are located on the walls of the voids, from the center of the voids for the GGA at 400 K. This observation is consistent with the results reported by Kageyama et al. [29] from dielectric measurements.
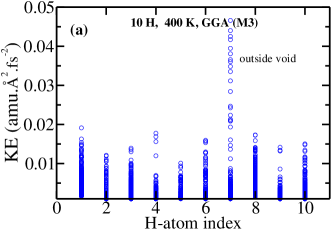
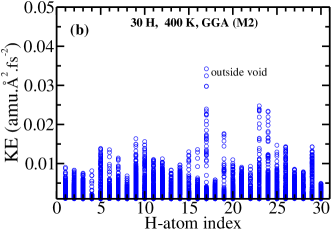
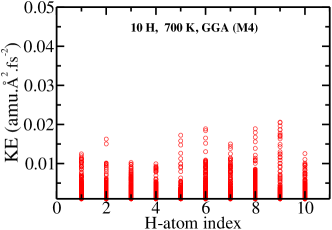
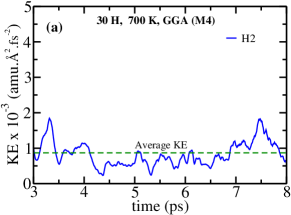
We now briefly discuss the diffusion of a few highly mobile H atoms. Earlier in this section, we have seen that the MSD of H atoms can increase occasionally very rapidly for a hydrogen load of 10 and 20 H atoms/void. This behavior of the MSD has been attributed to the movement of few H atoms out of the void region, defined by a sphere of radius 8 Å. It has been observed that such a steep rise of the MSD (e.g., see Fig. 2(a) at 12 ps) originates from the high mobility of few H atoms inside the hydrogenated voids. Figure 5 shows the plot of the instantaneous kinetic energy (KE) of H atoms at 400 K, obtained from using the GGA for a period 20 ps. The distribution of the KE values along the axis for a given H atom indicates the range and the frequency of the kinetic energy of the atom during the course of AIMD simulations. An analysis of the real-space trajectory of the H atoms in the vicinity of the void region in models M2 and M3, and the results from Fig. 5 revealed that a few highly mobile H atoms, such as H7 in Fig. 5(a) and H17 in Fig. 5(b), left the void region sometime during the course of simulations. This observation was found to be true for other voids as well, where H atoms were observed to leave the void region due to their high kinetic energies. Conversely, we have noticed that all the H atoms in model M4 remained inside the void throughout the course of simulation even at the high temperature of 700 K. The results obtained from M4 are shown in Fig. 6, where the KE values of the H atoms are found to be considerably lower than those presented in Fig. 5.
III.2 Kinetics of Si–H bond formation and dissociation on the surface of voids in a-Si
We now address a question of considerable importance concerning the kinetics of Si–H bond formation and dissociation on the surface of voids in a-Si. While a complete understanding of these events requires the computation of bond formation and dissociation energies, and the knowledge of the potential-energy surface associated with Si–H bonding configurations, the problem can be addressed approximately by considering the kinetic energy of H atoms in AIMD simulations.
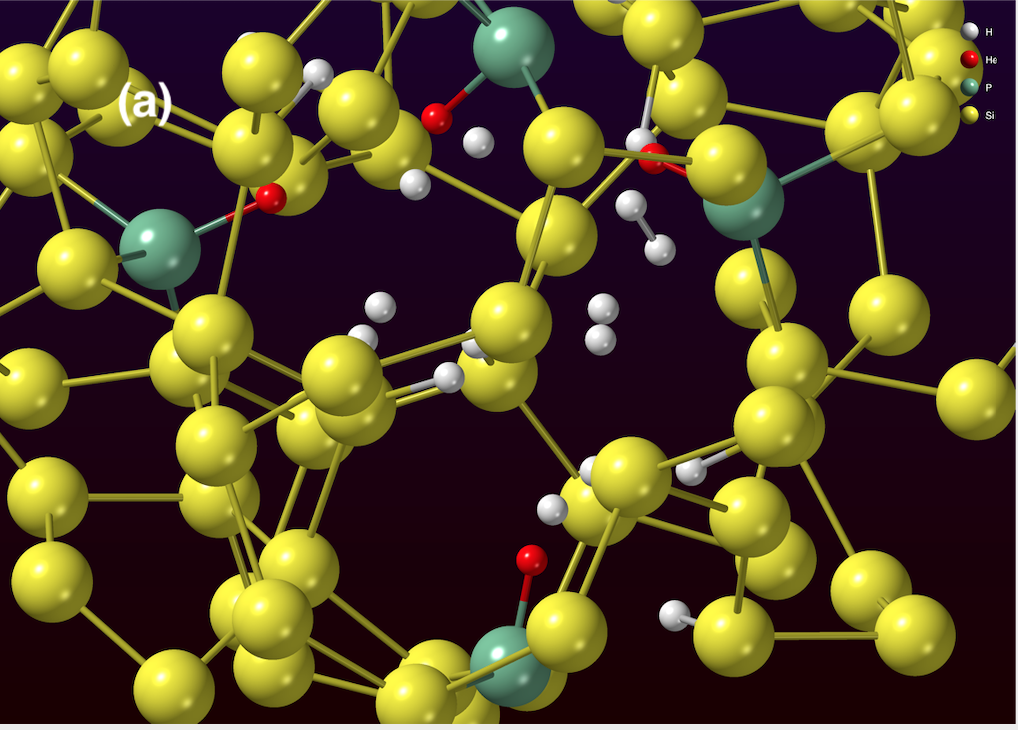
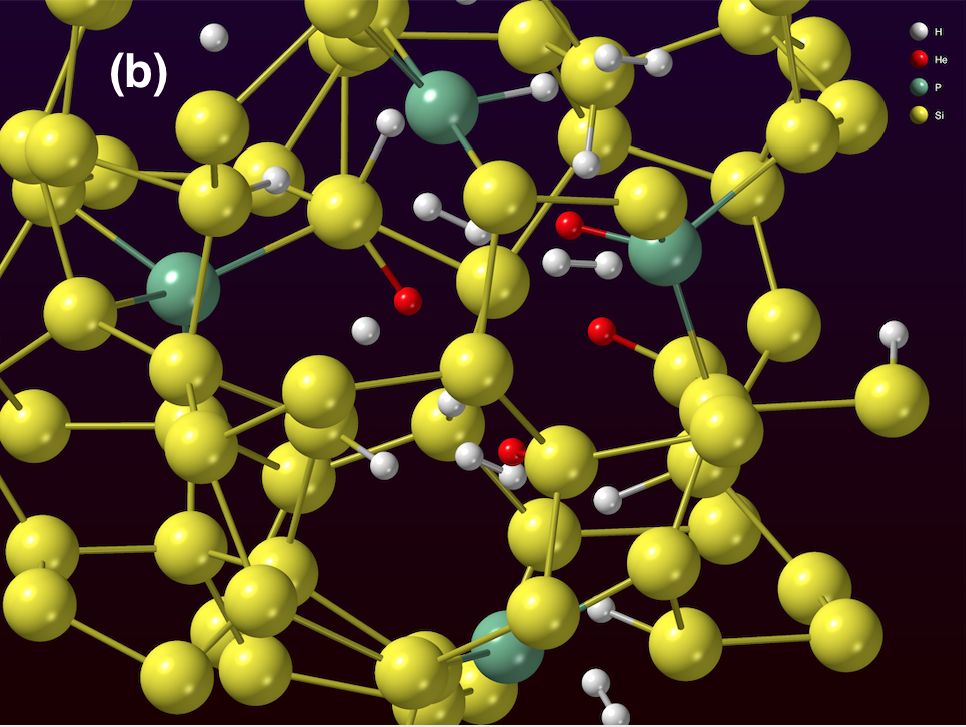
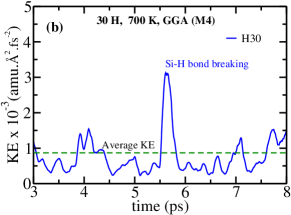
Earlier, in Fig. 3, we have seen that the mean-square displacement (MSD) of H atoms inside the voids fluctuates within the range of 17–22 Å2, depending upon the LDA or GGA. The MSD values are indicative of the fact that the great majority of H atoms stay bonded to Si atoms on the void surface as the time evolution of the system continues. However, it has been observed that a few H atoms in Si–H bonds can break free of the surface and move through the cavity to form new Si–H bonds at nearby active Si sites. This behavior is particularly pronounced at 700 K for a hydrogen load of 30 H atoms/void, where the presence of few H atoms with high kinetic energy makes it possible to dissociate an existing Si–H bond and form a new Si–H bond in the vicinity of the void surface. This is illustrated in Fig. 7, which shows the snapshots of two silicon-hydrogen bonding configurations in the vicinity of the void in M4, obtained from the GGA at 3 ps and 18 ps. Figure 7(a) shows a set of four Si–H bonds, involving H12, H16, H24, and H30, indicated as green-red pairs, at 3 ps, which are found to dissociate later during simulation. The breaking of Si–H bonds is reflected in Fig. 7(b), which shows that the H atoms (red) resulted from the dissociation of four Si–H bonds moved through the void and formed new Si–H bonds. The latter are shown as yellow-red pairs, with the exception of one where a dissociated H atom (red) is found to be bonded with an active Si site (green).
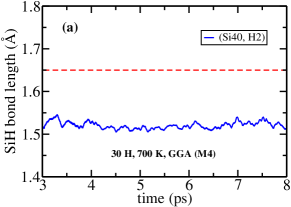

The dissociation of Si–H bonds at 700 K can be understood from a kinetic point of view. Figure 8 shows the time evolution of the kinetic energy (KE) of two H atoms, H2 and H30, bonded to silicon atoms, Si40 and Si48, respectively, as monohydride Si–H bonds. As the simulation proceeds, the KE values fluctuate around the average translational KE value of 3T/2 at temperature , where is the Boltzmann constant. However, the large kinetic energy of H30 atom at around 5.5 ps, which is about three times larger than the average KE at 700 K, leads to a rupture of the Si–H bond and subsequent formation of a new Si–H bond with a silicon atom in the vicinity of the void. By contrast, H2 forms a stable Si–H bond due its low kinetic energy during time evolution of the system. We have verified that the remaining three H atoms – H12, H16, and H24 – exhibit a similar behavior as H30 as far as the KE values are concerned.
The dissociation of Si–H bonds due to high KE values of H atoms can be observed by tracking the Si–H bond length of a dissociated pair with time. Figure 9 shows the evolution of Si–H bond lengths associated with the pairs (Si40, H2) and (Si48, H30). The pair (Si48, H30) breaks at 5.35 ps, which is followed by the formation of a new pair (Si65, H30) at 5.56 ps, but the low-energy pair (Si40, H2) continues to stay bonded during its evolution. The variation of the bond length of the (dissociated) pair before and after dissociation are shown in Fig. 9(b). The transient isolated state of H30, between 5.35 ps and 5.56 ps, is shown as red squares, where the ‘bond length’ corresponds to the distance between H30 and the nearest Si atom in the void region. It goes without saying that the dissociation and subsequent formation of Si–H bonds on the void surface do not affect the MSD values of the H atoms as long as the H atoms stay within the cavity through the formation of new bonding configurations.
| H load | XC | H | H2 | SiH | SiH2 | ExH |
|---|---|---|---|---|---|---|
| 400 K | ||||||
| 10 | GGA | 0 | 15.0 | 67.50 | 0 | 17.50 |
| LDA | 0 | 10.0 | 82.50 | 0 | 7.50 | |
| 20 | GGA | 0 | 32.50 | 47.50 | 10.0 | 10.0 |
| LDA | 0 | 25.0 | 62.75 | 5.0 | 7.50 | |
| 30 | GGA | 0 | 45.0 | 40.0 | 11.67 | 3.33 |
| LDA | 0 | 28.33 | 47.50 | 18.33 | 5.83 | |
| 700 K | ||||||
| 10 | GGA | 0 | 25.0 | 55.0 | 0 | 20.0 |
| LDA | 0 | 0 | 77.50 | 5.0 | 17.50 | |
| 20 | GGA | 0 | 27.50 | 45.0 | 12.50 | 15.0 |
| LDA | 0 | 17.50 | 66.25 | 2.50 | 13.75 | |
| 30 | GGA | 0.83 (1∗) | 35.56 | 41.11 | 8.89 | 13.33 |
| LDA | 1.65 (2∗) | 16.67 | 56.67 | 11.67 | 13.33 | |
III.3 Hydrogen microstructure and morphology of voids in a-Si
The discussion in the preceding sections so far is mostly confined to the dynamics of H atoms inside the voids and to what extent the motion of H atoms is affected by the exchange-correlation approximation and the hydrogen load inside the voids, as far as the MSD of H atoms is concerned. We now examine the microstructure of hydrogen distributions on void surfaces and the morphological character of the voids, which result from the movement of hydrogen and silicon atoms in the vicinity of the voids for a varying hydrogen load. In particular, we discuss the formation of various bonded hydrogens (BH) and non-bonded hydrogens (NBH), as well as the restructuring of the void surfaces during annealing at 400 K and 700 K, with an increasing concentration of H atoms within voids, and the dependence of hydrogen microstructure on the LDA and GGA. The BH and NBH play an important role in characterizing the structural and optical properties of a-Si:H [9, 15, 16]. These properties can be studied experimentally using an array of experiments, such as positron-annihilation lifetime (PAL) spectroscopy [15], Rutherford backscattering spectrometry (RBS) [16], hydrogen-effusion measurements [30, 31], and Fourier-transform infrared spectroscopy-attenuated total reflections (FTIR-ATR) [32].
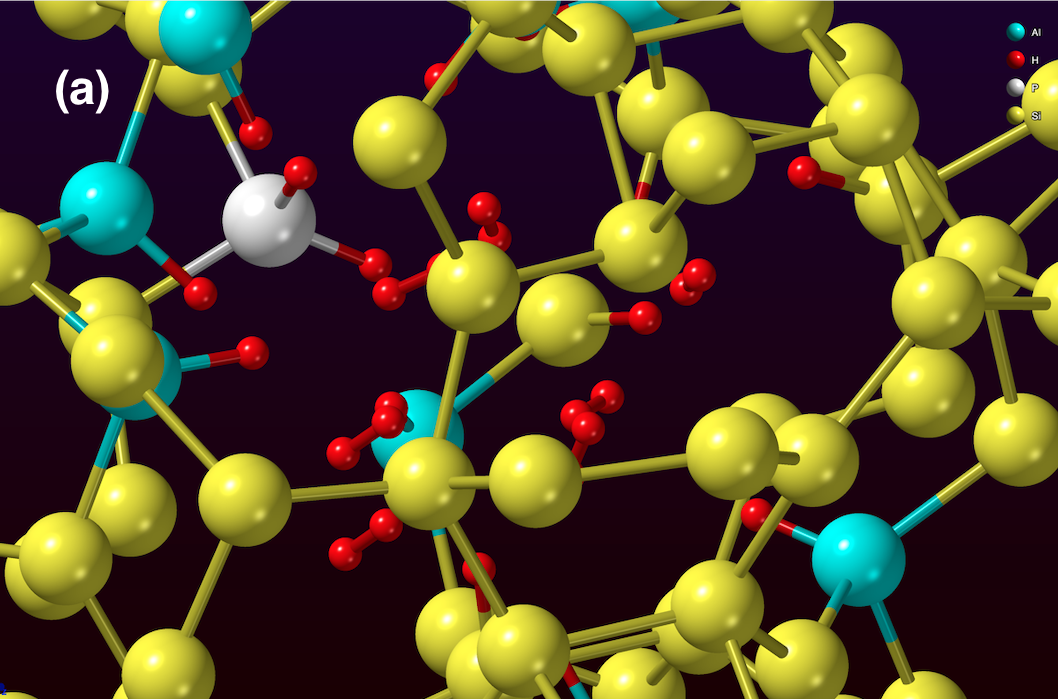
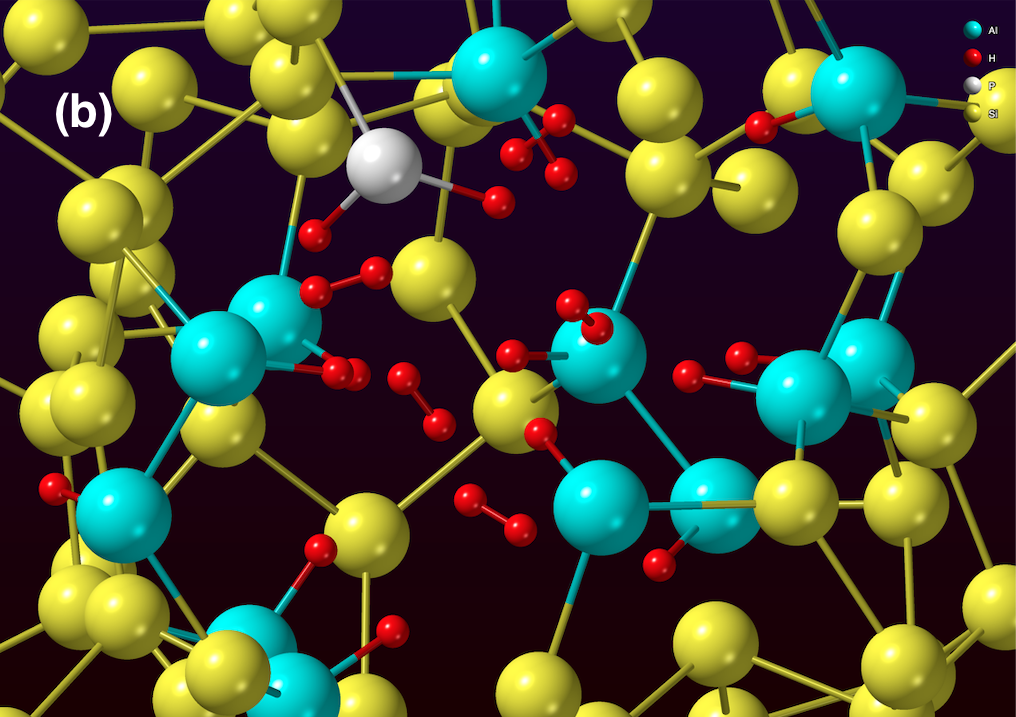
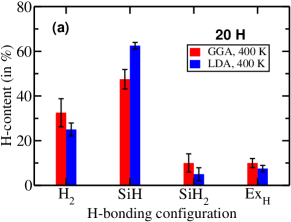
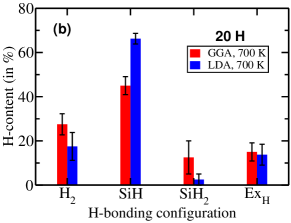
Table 1 lists the statistics of various silicon-hydrogen bonding configurations and non-bonded hydrogens, e.g., H2 molecules and one or two isolated H atoms, near the void, defined by a spherical region of radius 8 Å. The presence of isolated H atoms in the network is an artifact (of simulations), which arises from our choice of the cutoff value of 1.65 Å for Si–H bonds. It has been observed that the isolated H atoms at 700 K, listed in Table 1, are at a distance of 1.66 Å from the nearest Si atom (for the GGA) and at distances of 1.67 Å and 1.7 Å from the neighboring Si atoms (for the LDA). The results from Table 1 and an analysis of the void surfaces for the hydrogen load of 10, 20, and 30 H atoms/void show that the surface of the voids is mostly decorated with monohydride Si–H bonds. A few dihydride Si–H2 bonds are also spotted for a hydrogen load of 20 and 30 H atoms/void, and a notable amount of hydrogen can be seen to appear inside the voids as H2 molecules, especially for hydrogen loads of 20 and 30 H atoms/voids. It is also evident from Table 1 that, in comparison with the GGA, the LDA overestimates the number of SiH bonds but underestimates the count of H2 molecules. The presence of few SiH2 bonding configurations makes it difficult to comment on the dependence of SiH2 configurations on the XC approximation from the available data. Figure 10 shows a three-dimensional rendering of Si–H and Si–H2 bonds in the vicinity of the void surface in M4, along with a few H2 molecules for a hydrogen load of 30 H atoms/voids at 400 K and 700 K.
Experimental studies using infrared measurements by Chabal and Patel [33] suggest that the number density of H2 molecules in nanometer-size voids in a-Si is of the order of 1021 cm-3. This observation is found to be consistent with the values listed in Table 1, which can be roughly translated into 3–13 1021 cm-3 for the GGA and 2–8 1021 cm-3 for the LDA at 400 K, assuming a spherical void of radius 5–8 Å and a hydrogen load of 30 H atoms/void. None of the AIMD runs in this study showed any isolated H atoms within the voids, except one or two at 700 K, which are statistically insignificant. As discussed earlier, a few highly mobile H atoms are found to diffuse out of the void region due to high KE values of these atoms. The number of such atoms are listed as ExH in Table 1. Figure 11 summarizes the results from Table 1, by showing the number of Si–H, Si–H2, and H2 molecules for a hydrogen load of 20 H atoms/void at 400 K and 700 K.
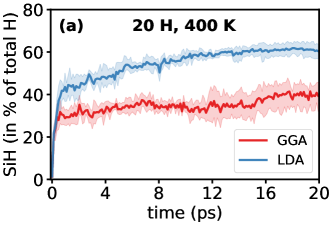
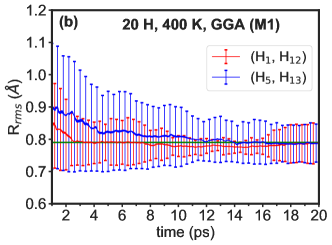
Since the restructuring of void surfaces is largely characterized by Si–H bonds on the walls of the voids, it is instructive to examine the formation of these bonds during the course of simulation. Figure 12(a) shows the time evolution of the hydrogen content of SiH bonds (in per cent of total H) for a hydrogen load of 20 H atoms/voids in the GGA and the LDA at 400 K. The formation of Si–H bonds begins very rapidly within the first few picoseconds and then it gradually converges by 18 ps. The LDA seems to overestimate the number of SiH bonds by about 32%, compared with the same from the GGA (cf. Table 1). This notable difference between the LDA and the GGA results indicates the need for choosing an accurate XC functional and a long simulation time for studying the microstructure of SiH and SiH2 on the walls of the voids. Likewise, the formation of H–H pairs, or H2 molecules, during annealing is illustrated in Fig. 12(b), by plotting the evolution of the RMS distance between two pairs of H atoms at 400 K in the GGA for a hydrogen load of 20 H atoms/voids in M1. The first H2 molecule, consists of (H1, H12), was formed within the first 3 ps, whereas the second one, (H5, H13), was formed at around 14 ps. The RMS distance between the pair of H atoms and the corresponding standard deviation are obtained by averaging over a moving time window of width 200 fs.
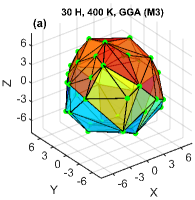
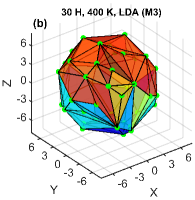
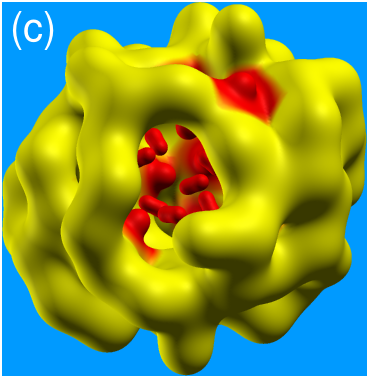
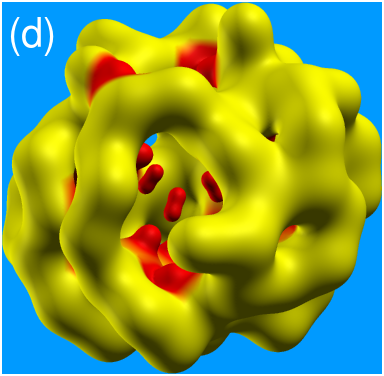
We conclude this section by making the following observation on the linear size and the shape of the voids obtained from annealing and total-energy relaxations in the presence of H atoms. While the linear size of a void can be estimated from the radius of gyration of a set of atoms, which define the void surface, the reconstruction of a three-dimensional shape of a void from a finite set of atomic positions is a nontrivial problem. A somewhat crude but simple and useful approach is to approximate the void shape by constructing the minimal convex polyhedron, or a convex hull, formed by the set of void-surface atoms. The approach assumes that any restructuring of the void surface – caused by the movement of the void-surface atoms – would be reflected in the shape of the convex hull, which is associated with the void region. However, it has been observed [34] that the actual shape of voids can be rather complex and non-convex in nature, and it may not be represented accurately by a convex polyhedron. An approximate non-convex surface can be constructed via convolution of the position of the void-surface atoms using three-dimensional Gaussian basis functions and choosing a suitable value of the isosurface parameter for the atomic pseudo-surface of Si and H atoms. The Xcrysden [35] package can generate such pseudo-surfaces. A more general discussion on the reconstruction of such non-convex void shapes can be found in Refs. [11, 34].
| H load | XC | RG | RH | VH | ||
| 400 K | ||||||
| 10 | GGA | 6.392 | 7.162 | 1275.04 | 0.884 | 41 |
| LDA | 6.517 | 7.205 | 1305.45 | 0.888 | 41 | |
| 20 | GGA | 6.416 | 7.204 | 1295.95 | 0.883 | 41 |
| LDA | 6.566 | 7.218 | 1316.80 | 0.890 | 42 | |
| 30 | GGA | 6.489 | 7.231 | 1318.42 | 0.885 | 42 |
| LDA | 6.541 | 7.263 | 1332.45 | 0.887 | 42 | |
| 700 K | ||||||
| 10 | GGA | 6.192 | 7.102 | 1242.36 | 0.883 | 40 |
| LDA | 6.347 | 7.175 | 1287.78 | 0.887 | 41 | |
| 20 | GGA | 6.365 | 7.242 | 1299.63 | 0.880 | 39 |
| LDA | 6.461 | 7.274 | 1323.15 | 0.879 | 39 | |
| 30 | GGA | 6.430 | 7.202 | 1319.43 | 0.892 | 42 |
| LDA | 6.475 | 7.238 | 1317.39 | 0.882 | 41 | |
Figure 13 shows the approximate shape of a void with a hydrogen load of 30 H atoms/void (in model M3) obtained from annealing at 400 K, followed by total-energy optimization. The convex polyhedra shown in Figs. 13(a) and 13(b) correspond to the set of void-surface atoms obtained from the GGA and the LDA, respectively. The respective non-convex shapes of the void, obtained via the convolution of the same set of void-surface atoms using the Gaussian functions centered at the atomic sites, are shown in Figs. 13(c) and 13(d). Although the polyhedra in Figs. 13(a)-(b) appear different, the difference is not particularly noteworthy as far as the hull radius, the convex-hull volume, and the sphericity of the polyhedra are concerned. These values are listed in Table 2. The sphericity, , of an object is defined as the ratio of the surface area of a sphere, , to that of the object, , both having an identical volume . This definition leads to [36],
Here, we have used the volume and the corresponding surface area of the convex hull of a void surface to estimate and , respectively. A review of and other values in Table 2 suggests that the LDA marginally overestimates the volume of the void, which is evident from the gyrational and hull radii, and the hull volume of the voids for all hydrogen loads and temperatures. This observation is also consistent with the somewhat smaller values of the MSD of H atoms (within voids) that we have observed for the GGA calculations in Figs. 3(a)-(b).
IV Conclusions
In this paper, we have studied ab initio dynamics of hydrogen atoms inside voids in a-Si with an emphasis on hydrogen diffusion and the resulting structure of the void surfaces with respect to a varying concentration of hydrogen at 400 K and 700 K. A comparison of the results obtained from the LDA and the GGA reveals that the former considerably overestimates the number of monohydride Si–H bonds but underestimates the presence of H2 molecules inside the cavities, irrespective of the annealing temperature and the concentration of hydrogen. The surfaces of the voids are found to be primarily passivated with monohydride Si–H bonds and a few dihydride SiH2 bonds at high concentration of hydrogen. Neither the LDA nor the GGA shows any presence of SiH3 configurations even for a high concentration/load of 30 H atoms/void. The number densities of the bonded and non-bonded hydrogens observed in this study are found to be consistent with those from the infrared and Rutherford back scattering (RBS) measurements. The study reveals that the kinetics of Si–H bond formation and dissociation during AIMD simulations can be approximately described and understood by considering the (translational) kinetic energy of H atoms inside the voids. Hydrogen atoms with KE values significantly higher than the average KE of the system at a given temperature are found to dissociate from Si–H bonds on the surface of the voids. The resulting isolated H atoms then diffuse through the void region to form new bonds with nearby active Si atoms within a fraction of a picosecond in our simulations. The results also show that a somewhat higher value of the mean-square displacement of the H atoms within voids in the LDA can be attributed to the reconstruction of the void surface through the formation of Si–H bonds. This is also reflected in the linear size of the voids obtained from the convex-hull approximation.
acknowledgments
The work was partially supported by the U.S. National Science Foundation (NSF) under Grant No. DMR 1833035. The authors acknowledge the use of computing resources at the University of Southern Mississippi, supported by the NSF under the Major Research Instrumentation (MRI) program via Grant No. ACI 1626217.
References
- Street [2009] R. A. Street, Adv. Materials 21, 2007 (2009).
- Wolf et al. [2012] S. D. Wolf, A. Descoeudres, Z. C. Holman, and C. Ballif, Green 2, 7 (2012).
- Ge et al. [2012] J. Ge, Z. Ling, J. Wong, T. Mueller, and A. Aberle, Energy Procedia 15, 107 (2012).
- Staebler and Wronski [1977] D. L. Staebler and C. R. Wronski, Applied Physics Letters 31, 292 (1977).
- Su et al. [2002] T. Su, P. C. Taylor, G. Ganguly, and D. E. Carlson, Phys. Rev. Lett. 89, 015502 (2002).
- Bobela et al. [2011] D. C. Bobela, H. M. Branz, and P. Stradins, Applied Physics Letters 98, 201908 (2011).
- Biswas et al. [2007] P. Biswas, R. Atta-Fynn, and D. A. Drabold, Phys. Rev. B 76, 125210 (2007).
- Chakraborty and Drabold [2009] S. Chakraborty and D. A. Drabold, Phys. Rev. B 79, 115214 (2009).
- Biswas and Timilsina [2011] P. Biswas and R. Timilsina, J. Phys.: Cond. Matt. 23, 065801 (2011).
- Biswas et al. [2017] P. Biswas, D. Paudel, R. Atta-Fynn, D. A. Drabold, and S. R. Elliott, Phys. Rev. Applied 7, 024013 (2017).
- Biswas et al. [2020] P. Biswas, D. Paudel, R. Atta-Fynn, and S. R. Elliott, Nanoscale 12, 1464 (2020).
- Limbu et al. [2020] D. K. Limbu, S. R. Elliott, R. Atta-Fynn, and P. Biswas, Sci. Rep. 10, 7742 (2020).
- Biswas et al. [2014] P. Biswas, D. A. Drabold, and R. Atta-Fynn, Journal of Applied Physics 116, 244305 (2014).
- Guerrero and Strubbe [2020] E. Guerrero and D. A. Strubbe, Phys. Rev. Materials 4, 025601 (2020).
- Sekimoto et al. [2016] T. Sekimoto, M. Matsumoto, A. Sagara, M. Hishida, and A. Terakawa, J. Non-Cryst. Solids 447, 207 (2016).
- Sekimoto et al. [2018] T. Sekimoto, M. Matsumoto, and A. Terakawa, Jpn. J. Appl. Phys. 57, 08RB07 (2018).
- Paudel et al. [2018] D. Paudel, R. Atta-Fynn, D. A. Drabold, S. R. Elliott, and P. Biswas, Phys. Rev. B 97, 184202 (2018).
- Wooten et al. [1985] F. Wooten, K. Winer, and D. Weaire, Phys. Rev. Lett. 54, 1392 (1985).
- Barkema and Mousseau [2000] G. T. Barkema and N. Mousseau, Phys. Rev. B 62, 4985 (2000).
- Soler et al. [2002] J. M. Soler, E. Artacho, J. D. Gale, A. García, J. Junquera, P. Ordejón, and D. Sánchez-Portal, J. Phys.: Condens. Matter 14, 2745 (2002).
- Mahan et al. [2001] A. H. Mahan, Y. Xu, D. L. Williamson, W. Beyer, J. D. Perkins, M. Vanecek, L. M. Gedvilas, and B. P. Nelson, Journal of Applied Physics 90, 5038 (2001).
- Young et al. [2007] D. L. Young, P. Stradins, Y. Xu, L. M. Gedvilas, E. Iwaniczko, Y. Yan, H. M. Branz, Q. Wang., and D. L. Williamson, Applied Physics Letters 90, 081923 (2007).
- [23] The effective width of the void surface is chosen to be about 3 Å. This is based on the results from the test calculations at 700 K, which show that the majority of silicon atoms near the void surface can move up to a distance of 2.5–3.0 Å. This distance is roughly equal to the first nearest-neighbor distance between Si atoms in the amorphous environment. For structural analysis of voids, we thus use a void-surface region of 8 Å.
- Junquera et al. [2001] J. Junquera, O. Paz, D. Sánchez-Portal, and E. Artacho, Phys. Rev. B 64, 235111 (2001).
- Troullier and Martins [1991] N. Troullier and J. Martins, Phys. Rev. B 43, 1993 (1991).
- Perdew and Zunger [1981] J. P. Perdew and A. Zunger, Phys. Rev. B 23, 5048 (1981).
- Perdew et al. [1996] J. P. Perdew, K. Burke, and M. Ernzerhof, Phys. Rev. Lett. 77, 3865 (1996).
- Nosé [1984] S. Nosé, The Journal of Chemical Physics 81, 511 (1984).
- Kageyama et al. [2011] S. Kageyama, M. Akagawa, and H. Fujiwara, Phys. Rev. B 83, 195205 (2011).
- Beyer [2003] W. Beyer, Solar Energy Materials and Solar Cells 78, 235 (2003).
- Beyer and Wagner [1982] W. Beyer and H. Wagner, Journal of Applied Physics 53, 8745 (1982).
- Sekimoto et al. [2014] T. Sekimoto, M. Matsumoto, M. Hishida, and A. Terakawa, Jpn. J. Appl. Phys. 53, 095501 (2014).
- Chabal and Patel [1984] Y. J. Chabal and C. K. N. Patel, Phys. Rev. Lett. 53, 210 (1984).
- Biswas and Elliott [2015] P. Biswas and S. R. Elliott, J. Phys.: Cond. Matt. 27, 435201 (2015).
- Kokalj [1999] A. Kokalj, J. Mol. Graph. Model. 17, 176 (1999).
- Wadell [1935] H. Wadell, J. Geology 43, 250 (1935).