The luminous red nova variety: AT 2020hat and AT 2020kog
We present the results of our monitoring campaigns of the luminous red novae (LRNe) AT 2020hat in NGC 5068 and AT 2020kog in NGC 6106. The two objects were imaged (and detected) before their discovery by routine survey operations. They show a general trend of slow luminosity rise, lasting at least a few months. The subsequent major LRN outbursts were extensively followed in photometry and spectroscopy. The light curves present an initial short-duration peak, followed by a redder plateau phase. AT 2020kog is a moderately luminous event peaking at erg s-1, while AT 2020hat is almost one order of magnitude fainter than AT 2020kog, although it is still more luminous than V838 Mon. In analogy with other LRNe, the spectra of AT 2020kog change significantly with time. They resemble those of type IIn supernovae at early phases, then they become similar to those of K-type stars during the plateau, and to M-type stars at very late phases. In contrast, AT 2020hat already shows a redder continuum at early epochs, and its spectrum shows the late appearance of molecular bands. A moderate-resolution spectrum of AT 2020hat taken at +37 d after maximum shows a forest of narrow P Cygni lines of metals with velocities of 180 km s-1, along with an H emission with a full-width at half-maximum velocity of 250 km s-1. For AT 2020hat, a robust constraint on its quiescent progenitor is provided by archival images of the Hubble Space Telescope. The progenitor is clearly detected as a mid-K type star, with an absolute magnitude of mag and a colour of mag, which are inconsistent with the expectations from a massive star that could later produce a core-collapse supernova. Although quite peculiar, the two objects nicely match the progenitor versus light curve absolute magnitude correlations discussed in the literature.
Key Words.:
binaries: close - stars: winds, outflows - stars: individual: AT 2020hat - stars: individual: AT 2020kog - stars: individual: V1309 Sco - stars: individual: V838 Mon1 Introduction
Luminous red novae (LRNe) form a novel class of stellar transients with luminosities intermediate between novae and core-collapse supernovae (SNe). These gap transients (Kasliwal, 2012; Pastorello & Fraser, 2019) have a characteristic double-peak light curve, early spectra similar to those of type IIn SNe, and late spectra that migrate from matching those of intermediate stellar types to those of mid-to-late M-type stars (see, Pastorello et al., 2019a, and references therein). These properties allow us to securely discriminate LRNe from the so-called intermediate-luminosity red transients (ILRTs111ILRTs always show a very slow spectral evolution and prominent Ca lines, in particular the typical narrow [Ca II] 7291, 7324 doublet in emission., e.g. Botticella et al., 2009; Bond et al., 2009; Cai et al., 2018; Stritzinger et al., 2020a), which are believed to originate from eruptions or terminal explosions of super-asymptotic giant branch (S-AGB) stars. Nonetheless, some observational overlap between the two classes has been occasionally noted, giving rise to controversial cases (e.g. M85-2006OT1 and AT 2018hso; Kulkarni et al., 2007; Pastorello et al., 2007; Cai et al., 2019).
The LRN phenomenon can be comfortably explained in terms of post common envelope evolution and eventually coalescence in binary systems whose components span a wide range of masses. However, the physical processes leading to the common envelope ejection and the path to coalescence are still debated (e.g. Ivanova et al., 2013; Pejcha et al., 2017; Metzger & Pejcha, 2017; Segev et al., 2019; MacLeod et al., 2018; Soker, 2020; Soker & Kaplan, 2020). The characterisation of this species of gap transients is also necessary to provide reliable estimates of their rates, both in the Galaxy and in the local Universe, although it is now clear that the frequency of LRNe significantly depends on their luminosity and the total mass of the system (Kochanek et al., 2014; Howitt et al., 2020). Finally, the study of the evolution of massive binaries is a hot topic, as this has important implications in the formation of close compact binaries (Klencki et al., 2020), which are sources of gravitational waves (Abbott et al., 2016, 2017).
Collecting good datasets covering all the crucial phases of the LRN evolution is a necessary condition to develop reliable theoretical models (see, e.g. Pejcha et al., 2016a, b; Metzger & Pejcha, 2017; Segev et al., 2019; MacLeod & Loeb, 2020a, b). However, so far only a limited number of LRNe are available in the literature with extensive light curves, including pre-outburst detections and well-sampled spectral sequences. For this reason, within the NOT Unbiased Transient Survey 2 (NUTS2222http://nuts.sn.ie; Holmbo et al., 2019) collaboration, we are leading a programme of the systematic follow-up of LRNe (e.g. Cai et al., 2019; Pastorello et al., 2019a, b).
In this paper, we present the outcomes of our monitoring campaigns of two LRNe in the nearby Universe: AT 2020hat and AT 2020kog. These two objects, along with AT 2019zhd in M 31 (whose study is presented in a companion paper, Pastorello et al., 2020), were discovered in the observing semester from December 2019 to May 2020. Our team made a substantial effort to follow these three objects and provided excellent datasets for all of them, although the monitoring campaigns were severely complicated by the fact that many observational facilities had to suspend operations during the global lock-down resulting from the Covid-19 pandemic emergency.
The paper is structured as follows: Sect. 2 reports information on the discovery, classification, host-galaxy properties, distance, and reddening of AT 2020hat and AT 2020kog; their light curves and spectral evolution are presented in Sect. 3 and Sect. 4, respectively; archive photometry of the quiescent progenitor system of AT 2020hat is analysed in Sect. 5; the evolution of the bolometric luminosity, temperature, and radius is illustrated in Sect. 6. A general discussion on the physical properties of LRNe and final remarks follow in Sect. 7.
2 AT 2020hat and AT 2020kog: Discoveries and host galaxies
|
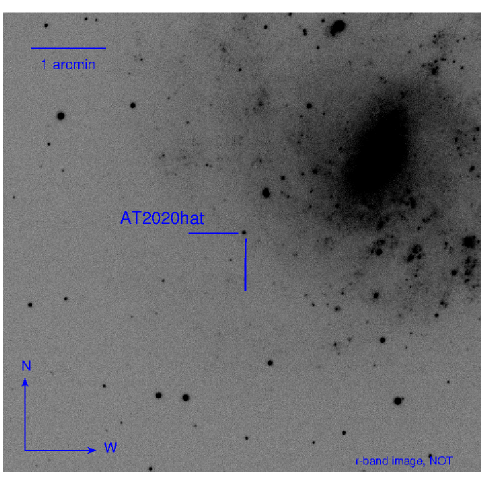
AT 2020hat333The transient is also known with the survey names ATLAS20jxk, PS20cjf, and ZTF20aawdwch. was discovered on 2020 April 12.48 UT in the Sc-type galaxy NGC 5068 by the Asteroid Terrestrial-impact Last Alert System (ATLAS, Tonry et al., 2018; Smith et al., 2020), at an ATLAS orange-band magnitude of mag. The coordinates of the object are , (equinox J 2000.0), which is offset by south and east from the centre of the host galaxy (see Fig. 1, top panel). The object was classified as an LRN after maximum light by Reguitti et al. (2020). The transient was also observed in the radio domain, but no counterpart was found down to 3 limits of about 0.06 mJy at 5.5 GHz and 0.04 mJy at 9.0 GHz (Ryder et al., 2020).
The host, NGC 5068, is a nearby face-on Sc-type galaxy444According to HyperLeda; http://leda.univ-lyon1.fr/. with a redshift of (Pisano et al., 2011). Given its proximity, the redshift does not provide a good constraint on the galaxy distance. For this reason, in this paper we adopt the distance estimate obtained through the tip of red-giant branch method, which provides a distance of Mpc (Karachentsev et al., 2017), hence a distance modulus of mag. We note that this value is remarkably similar to another estimate based on the planetary nebulae luminosity function ( mag, Herrmann et al., 2008).
The reddening towards AT 2020hat is dominated by the Milky Way component, mag (Schlafly & Finkbeiner, 2011). In fact, the analysis of the spectra of the transient (as we see in Sect. 4) does not indicate additional host galaxy reddening, as expected considering the peripheral location of the object in its host.
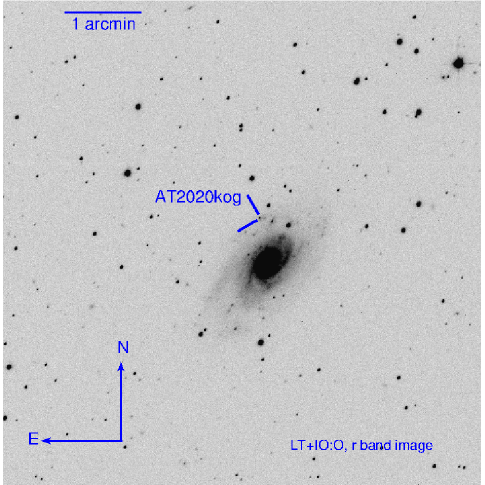
AT 2020kog, also known as PS20dgq, was discovered by the Panoramic Survey Telescope and Rapid Response System (Pan-STARRS) Search for Kilonovae (Smartt et al., 2019) on 2020 May 18.49 UT, in an outer spiral arm of the Sc-type galaxy NGC 6106. The coordinates of the object are , (equinox J 2000.0), with an offset of north and east from the core of the host galaxy (Fig. 1, bottom panel). The survey discovery magnitude was mag (Fulton et al., 2020).
The redshift of NGC 6106 is . Adopting a standard cosmology with km s-1 Mpc-1, = 0.27, and = 0.73, a distance of Mpc (corrected for Virgo Infall)555We note that other kinematic distance estimates span a relatively wide range of values, from 20.7 to 26.1 Mpc. is obtained (Mould et al., 2000), which provides mag. Numerous distance estimates have been published using the Tully-Fisher method, spanning a wide range of inferred values (from about 21 to 28 Mpc). Here we adopt the most recent estimate from Tully et al. (2016) adapted to our cosmological assumptions: Mpc, which gives mag. This distance, which is adopted hereafter in the paper, is slightly lower than the kinematic distance.
The dust extinction within the Milky Way in the direction of the transient is mag (Schlafly & Finkbeiner, 2011). In addition, the detection of a prominent narrow interstellar feature of Na I 5890,5896 (Na ID) in the spectra of the transient suggests the existence of additional reddening within the host galaxy. With a host galaxy contribution of mag (see Sect. 4.2 for details), we find that a total colour excess due to line-of-sight dust extinction is mag.
| Date | MJD | Phase | Instrumental configuration | Exptime (s) | Range (nm) | Resolution (nm) |
| AT 2020hat | ||||||
| 2020-04-16 | 58955.99 | +2.0 | NOT+ALFOSC+gm4 | 3600 | 340-960 | 1.4 |
| 2020-04-21 | 58960.01 | +6.0 | NOT+ALFOSC+gm4 | 3600 | 340-960 | 1.8 |
| 2020-04-28⋆ | 58967.99 | +14.0 | LT+SPRAT+VPH600 | 2100 | 400-800 | 1.4 |
| 2020-05-02 | 58971.07 | +17.1 | TNG+DOLORES+LRB | 2700 | 320-795 | 1.4 |
| 2020-05-03 | 58972.02 | +18.0 | TNG+DOLORES+LRR | 2700 | 500-1030 | 1.3 |
| 2020-05-17 | 58986.95 | +33.0 | GTC+OSIRIS+R1000B+R1000R | 2400,1800 | 360-1035 | 0.7,0.8 |
| 2020-05-17 | 58986.99 | +33.0 | GTC+OSIRIS+R2500R | 3000 | 559-768 | 0.34 |
| 2020-05-29 | 58998.96 | +45.0 | TNG+DOLORES+LRB+LRR | 2400,2400 | 330-1035 | 1.0,0.9 |
| 2020-06-29 | 59029.94 | +75.9 | TNG+DOLORES+LRR | 3600 | 500-970 | 1.3 |
| AT 2020kog | ||||||
| 2020-05-27 | 58996.18 | +4.3 | GTC+OSIRIS+R1000B | 1500 | 365-785 | 0.7 |
| 2020-06-01 | 59001.17 | +9.3 | GTC+OSIRIS+R1000R | 3000 | 510-1035 | 0.8 |
| 2020-06-14 | 59014.09 | +22.2 | GTC+OSIRIS+R1000B | 3000 | 365-785 | 0.7 |
| 2020-06-29 | 59029.04 | +37.1 | GTC+OSIRIS+R1000R | 3000 | 510-1035 | 0.8 |
| 2020-08-17 | 59078.91 | +87.0 | GTC+OSIRIS+R1000R | 3000 | 510-1035 | 0.8 |
| 2020-08-17 | 59078.97 | +87.1 | NOT+ALFOSC+gm4 | 5400 | 390-960 | 1.4 |
| 2020-08-30 | 59091.92 | +100.0 | GTC+OSIRIS+R1000R | 3000 | 510-1040 | 0.8 |
3 Light curves of AT 2020hat and AT 2020kog
The photometric follow-up campaigns of AT 2020hat and AT 2020kog were performed after their discovery using a number of instruments available to our collaboration. The details of the instrumental configurations are provided in the photometry tables (available in electronic form at the CDS).
Due to its faint apparent magnitude, AT 2020kog was not detected by most of the surveys. However, important early data have been obtained by Pan-STARRS (Chambers et al., 2019; Flewelling et al., 2020; Magnier et al., 2020), with the wide -band filter. In contrast, AT 2020hat had a brighter apparent magnitude, and it was routinely observed by numerous surveys, including the Mpc SN survey (DLT40; Tartaglia et al., 2018, unfiltered data), the Zwicky Transient Facility (ZTF; Masci et al., 2018, in the Sloan- and bands)777ZTF forced photometry is released through the Lasair (https://lasair.roe.ac.uk/) and ALeRCE (https://alerce.online/) brokers., the All-Sky Automated Survey for Supernovae (ASAS-SN; Shappee et al., 2014; Kochanek et al., 2017, in the band)888ASAS-SN photometry is publicly released through the Sky Patrol ASAS-SN interface (https://asas-sn.osu.edu)., the Asteroid Terrestrial-impact Last Alert System project (ATLAS: Tonry et al., 2018, in the ATLAS-cyan and orange bands) and Pan-STARRS (in the and bands). We remark that in our paper the unfiltered DLT40 data were calibrated to Sloan- magnitudes, while the observations with ATLAS-orange () and ATLAS-cyan () filters were left in their original photometric systems. Finally, although no transformation was applied to the Pan-STARRS- band magnitudes provided by the survey, these data match our Sloan- observations very well.
Our imaging data needed some preliminary processing, including bias, flat-field, and (when useful) fringing pattern corrections. Near-infrared (NIR) images required additional preliminary steps, including building a sky image for each filter obtained from median-combining dithered science frames. Then, the sky image was subtracted from individual science frames, which were finally combined to increase the signal-to-noise ratio (S/N). Optical and NIR imaging data were reduced using the python/pyraf SNOoPY pipeline (Cappellaro, 2014). The software allowed us to perform astrometric calibration of the images, PSF-fitting photometry of the transient (with or without template subtraction)999AT 2020kog was located in a crowded region of its host galaxy, hence we subtracted template images of NGC 6106 obtained from the Pan-STARRS survey ( filters) and SDSS ( filter). In contrast, AT 2020hat was in a clean and peripheral location of the host galaxy, hence template subtraction was not necessary., and the subsequent photometric calibration making use of catalogues of reference stars. For the optical Sloan band images, we used the Sloan catalogue, while for the NIR data we used the Two Micron All-Sky Survey (2MASS) catalogue (Skrutskie et al., 2006). The unfiltered DLT40 photometry was calibrated with reference to the Sloan- photometry.
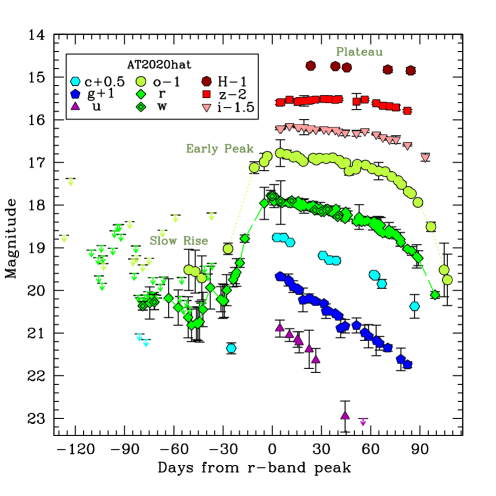
The final light curves of the two objects are shown in Fig. 2, while the optical photometry Tables E1 and E2 are made available in electronic form at the CDS. The NIR observations of AT 2020hat are instead reported in Table 1.
The field of AT 2020hat was routinely sampled before the LRN discovery by public surveys. These observations are crucial to build the light curve before the LRN outburst (Fig. 2, left panel). In particular, a faint source at the position of the transient is observed starting about three months before the AT 2020hat peak luminosity. In the pre-outburst phase, the light curve shows some fluctuations over a general brightening trend. From about one month before maximum, the best-sampled -band light curve shows a much more evident luminosity rise of about 2.5 mag, reaching the peak at mag (on )101010The time of the -band first light curve peak is used as reference epoch throughout the paper for both AT 2020hat and AT 2020kog.. The low-contrast light-curve peak is followed by a nearly linear decline in the blue bands, while a sort of plateau lasting about 70-80 d is observed in the red bands. This phase is followed by a rapid decline that unfortunately was not sampled well due to the modest visibility from our northern facilities. The decline rates in the different bands between the maximum and d are as follows: , , , , , and mag (100 d)-1 . The late-time (80 d) decline rates in the Sloan- and ATLAS- bands steepen to mag (100 d)-1 and mag (100 d)-1, respectively.
A few observations of AT 2020hat were also obtained in the NIR domain by the 2.0 m Liverpool Telescope (LT) with IO:I and the 2.56 m Nordic Optical Telescope (NOT) with NOTCam. While only two epochs were obtained in the and bands, observations in the band were obtained at five epochs during the plateau, with the object staying at roughly constant luminosity, around mag (Fig. 2, left panel).
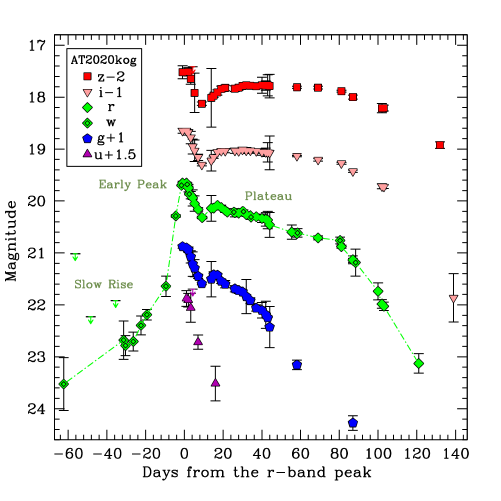
AT 2020kog was detected by Pan-STARRS a couple of months before the outburst peak (see Fig. 2, right panel). During the pre-outburst phase, until one month before maximum, the -band light curve initially rises with a rate of 2.40.3 mag (100 d)-1. The -band light curve brightening becomes faster in the following two weeks, with a rate of 5.80.2 mag (100 d)-1, to finally increase by further 2 mag in about 10 days by the time of the first blue peak. The epoch of the maximum and the peak magnitude of the -band light curve of AT 2020kog can be inferred from a low-order polynomial fit: We obtain and 0.02 mag. Pre-maximum information is not available for the band, so we adopt and mag as indicative parameters for the -band maximum.
After the peak, the -band light curve fades with a slope of mag (100 d)-1 and reaches a local minimum of mag at about 10 d past-maximum, followed by a modest re-brightening ( mag). From three weeks after maximum, the light curve declines almost linearly, with a rate of mag (100 d)-1. A much larger steepening is observed from about 80 d after maximum in all bands, although the decline rates are less steep in the Sloan- and bands. At phases 80 d, we find , , and mag (100 d)-1.
4 Spectroscopic data of AT 2020hat and AT 2020kog
Spectroscopic observations of the two objects were performed using the 10.4 m Gran Telescopio Canarias (GTC) equipped with OSIRIS, the 3.58 m Telescopio Nazionale Galileo (TNG) equipped with Dolores (LRS), the NOT with ALFOSC, and the 2.0 m LT with SPRAT. All these telescopes are hosted at the Observatorio del Roque de los Muchachos in La Palma (Canary Islands, Spain). Information on the instrumental configurations used for the spectroscopic data is given in Table 2.
The spectra were reduced using standard tasks in IRAF111111IRAF is distributed by the National Optical Astronomy Observatory, which is operated by the Association of Universities for Research in Astronomy (AURA) under a cooperative agreement with the National Science Foundation., with the exception of the ALFOSC data which were reduced using the Python-based FOSCGUI pipeline121212https://sngroup.oapd.inaf.it/foscgui.html developed by E. Cappellaro. After the traditional bias and flat-field correction of the science frames, 1-d spectra were optimally extracted and wavelength calibrated using arc-lamp spectra. The accuracy of the wavelength calibration was checked by measuring the wavelengths of the [O I] night sky lines. Then, the spectra were flux calibrated using spectrophotometric standards taken during the same night as the LRN observation. The flux calibration was finally fine-tuned using the photometric information, and the telluric absorption bands of O2 and H2O were removed using the spectra of hot standard stars.
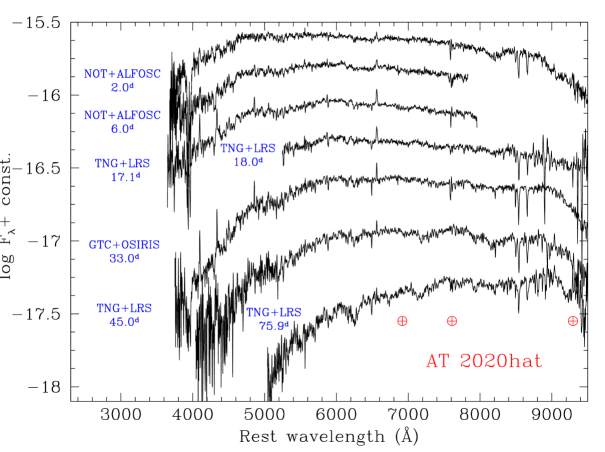
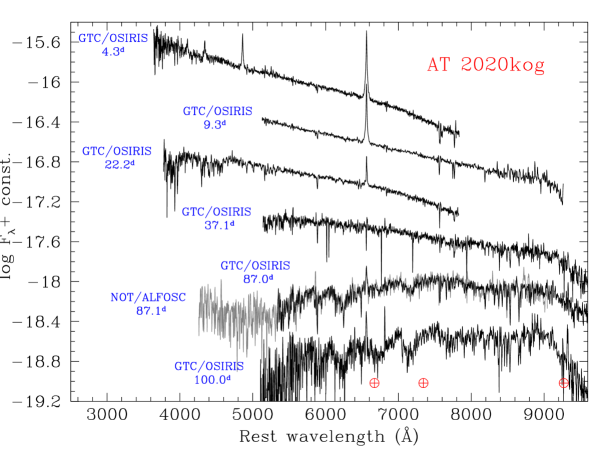
AT 2020hat was discovered quite late, and we could not follow it spectroscopically during the pre-maximum evolution. Nonetheless, the observational cadence after discovery is excellent and spans over 100 days of its evolution. The observational campaign of AT 2020kog is more complete, although it was hampered by the faint apparent magnitude of the transient and, because of its northern declination, the lack of support of southern facilities. As a consequence, the object was only observed with GTC and NOT, starting from soon after the blue peak to +100 d. Despite the limited number of spectra, we have been able to sample all of the crucial phases of the evolution of AT 2020kog. The two spectral sequences are shown in Fig. 3.
4.1 AT 2020hat spectra
The spectra of AT 2020hat are typical of the cooler, red-peak (or plateau) phase of LRNe. This either implies that we failed to see an earlier hotter phase, which is unlikely, or that this LRN did not become very hot at the early phases of the outburst, as occasionally observed in lower luminosity Galactic LRNe such as V1309Sco (Mason et al., 2010; Tylenda et al., 2011) and V838 Mon (Munari et al., 2002; Goranskij et al., 2002; Kimeswenger et al., 2002; Crause et al., 2003; Tylenda, 2005).
The spectra show weak Balmer lines with P Cygni profiles and a forest of narrow absorptions due to metal lines. These features are responsible for line blanketing at the blue wavelengths, although many multiplets are clearly detected at longer wavelengths. It is important to note that Ca II HK and Ca II NIR triplet are among the most prominent absorption lines in the spectra of AT 2020hat. We also possibly identify O I 7772,7777, although O I 8446 is not unequivocally seen.
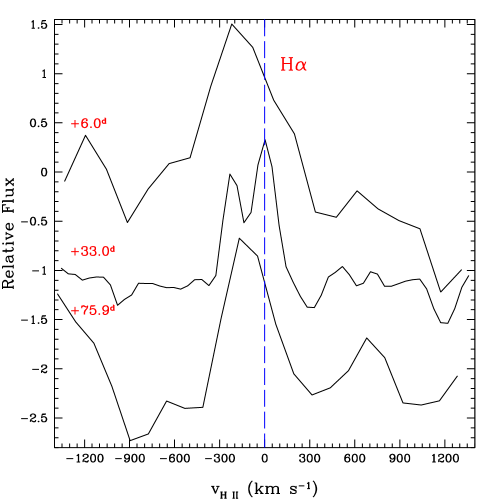
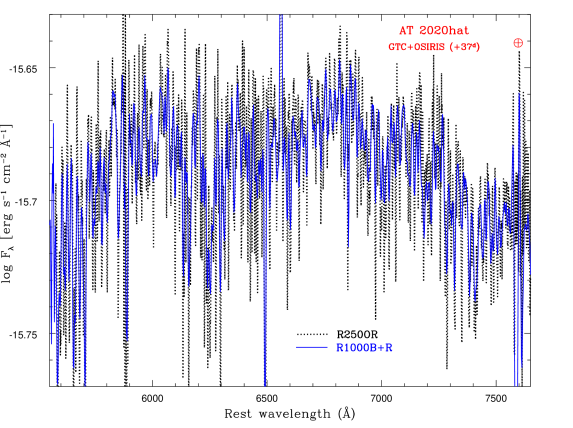
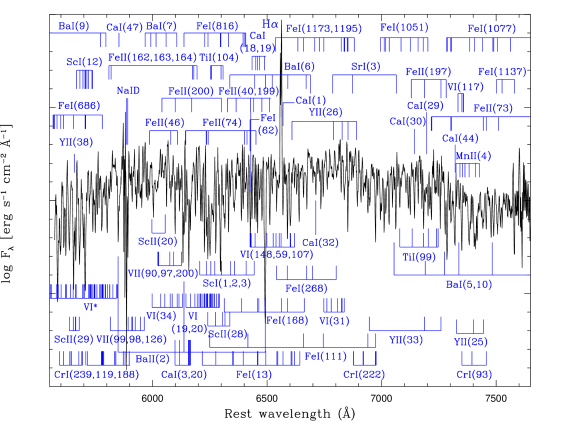
A detailed line identification and more precise velocity measurements can be performed in the region 560-760 nm using the moderate-resolution GTC+OSIRIS R2500R spectrum of AT 2020hat at phase +33 d. We note that H shows a resolved broader emission component with a full-width at half-maximum (FWHM) velocity () of km s-1 (after correction for spectral resolution), atop of which a narrower absorption feature is observed. Adopting a redshift of (see Sect. 2), this feature is blueshifted by about 1205 km s-1 from the rest wavelength (Fig. 4). An indicative estimate for the photosperic velocity at +33 d can be inferred by measuring the position of the minima of the prominent Ba II (multiplet 2) lines, which is found to be km s-1. In Fig. 5 (top panel), we compare the R2500R spectrum with the combined R1000B+R1000R spectrum obtained at the same epoch. The comparison shows that the narrow features observed in the R2500R spectrum match those observed in the lower resolution configuration, confirming that these are real spectral absorption lines and not noise patterns. A line identification on the R2500R spectrum is shown in Fig. 5 (bottom panel). The spectrum shows a number of multiplets of metals, which were identified following Moore (1945), including Ca I, Ba I, Ba II, Sc I, Sc II, Fe I, Fe II, V I, V II, Ti I, Ti II, and Na I. We note that Y II and Mn II are also tentatively identified, as these ions do not generate prominent features in the AT 2020hat spectrum.
4.2 AT 2020kog spectra
The first two spectra of AT 2020kog (Fig. 3, bottom panel) were obtained a few days after the initial blue peak. These early spectra have also been used to estimate the host galaxy reddening towards AT 2020kog. The narrow interstellar feature of Na ID is well detected in these low-resolution spectra, with an equivalent width (EW) of Å. Adopting the relation between EW(Na ID) and presented by Turatto et al. (2003)131313We remark, however, that the estimates of interstellar extinction inferred through EW(Na ID) should be taken with caution, in particular when EW(Na ID) Å (see discussions in Munari & Zwitter, 1997; Poznanski et al., 2012; Phillips et al., 2013; Stritzinger et al., 2018)., a host galaxy extinction value of mag is inferred, hence a total colour excess of mag.
After correcting for the total reddening, the continuum temperature can be inferred through a black-body fit to the continuum. We find it to be K in the +4.3 d spectrum, and it rapidly declines to K at +9.3 d, K at +22.2 d, and K at 37.1 d. In the early spectra, along with the prominent emission lines of H, we identify P Cygni lines of Ca II, O I, and Fe II. In particular, the most prominent Fe II lines are those of the multiplet 42. At phase +4.3 d, H has a Lorentzian profile with km s-1 after correcting for spectral resolution and km s-1 at +9.3 d. In our third spectrum at +22.2 d, the H profile becomes asymmetric and shows two unresolved Gaussian components, with a more prominent emission component at the rest wavelength and a weaker emission redshifted by about +350 km s-1. In our fourth spectrum (phase d), H is very faint, showing now a P Cygni profile, whose minimum is blue-shifted by 220 km s-1. The evolution of the Fe II lines is quite modest, with an expansion velocity inferred from the P Cygni minimum, which declines from about 330 km s-1 in our +4.3 d spectrum to km s-1 at 22.2 d.
Two spectra were also taken at phase 87 d, with the continuum becoming redder, with now evidence for the presence of broad absorption features due to molecules (mostly TiO), and H being relatively prominent again. We note that these spectra are remarkably similar to the spectrum of AT 2020hat at +75.9 d (see Fig. 3, top panel). Both the narrow H in emission and the broad molecular bands in absorption become much stronger in the 100 d spectrum of AT 2020kog. Among the molecular band features, we clearly identify TiO features at about 6150-6270 Å, 6570-6880 Å, 7050-7270 Å, 7590-7860 Å, and above 9200 Å. This late evolution is consistent with the expectations for an LRN (e.g. Martini et al., 1999; Kamiński et al., 2009; Mason et al., 2010; Barsukova et al., 2014; Smith et al., 2016; Blagorodnova et al., 2017; Pastorello et al., 2019a, b; Cai et al., 2019; Blagorodnova et al., 2020).
5 The progenitor of AT 2020hat
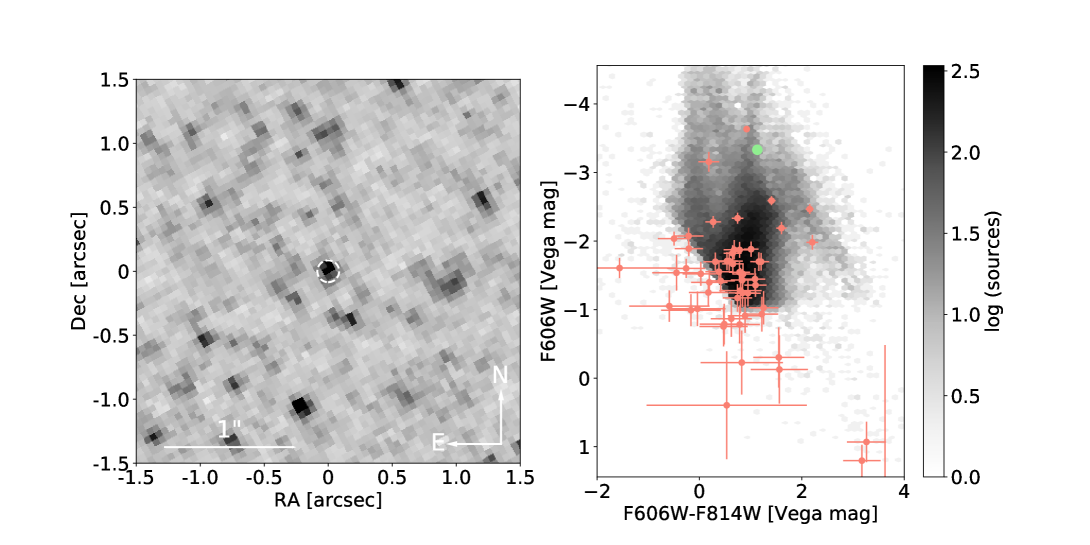
Due to its proximity, the host of AT 2020hat was frequently monitored in the past. In particular, the Hubble Space Telescope (HST) fortuitously observed NGC 5068 with the Advanced Camera for Surveys (ACS) Wide-Field Channel on 2017 February 11, a little over three years prior to the discovery of AT 2020hat. Two images with an exposure time of 515 s each were taken in both of the and filters. These data were downloaded from the Mikulski Archive for Space Telescopes141414http://archive.stsci.edu/.
In order to locate the position of AT 2020hat in these images, we obtained deep imaging from the NOT+ALFOSC on the night of 2020 June 8. To avoid saturation on the transient, we selected s images in the Sloan- band which were subsequently co-added to give a deep image with a measured FWHM of 0.9″. We used 22 point-like sources common to the drizzled (_drc) HST+ACS and NOT+ALFOSC images in order to derive an astrometric transformation between the two images. We find an RMS scatter of these sources of only 0.14, 0.13 ALFOSC pixels in x and y (hence mas) on the transformation. After measuring the pixel coordinates of AT 2020hat on the ALFOSC image, we were therefore able to transform this to the ACS image with a 1 uncertainty of only 0.44 pixels.
A source (henceforth the progenitor candidate) is clearly visible at the transformed position in Fig. 6. We used the dolphot package (Dolphin, 2000) to measure Vega-scale magnitudes of mag and mag. The source is 0.7 pixels offset from our transformed position for AT 2020hat and, as this is 1.6, we regard it as a strong candidate for the progenitor. In addition, two fainter sources were detected to the south and west which are potentially consistent with the position of AT 2020hat (Fig. 6). The magnitudes and colours of these sources are , with mag, and mag, with mag, respectively. This would imply absolute magnitudes of nearly to 0 mag at our adopted distance, and we do not consider them any further here.
For our adopted distance and extinction, the progenitor candidate has an absolute magnitude of mag and an colour mag, which is significantly redder than the detected progenitors of other LRNe (see discussion in section 5 of Pastorello et al., 2019a). While, in analogy with other LRNe, these photometric parameters are most likely the integrated values of the binary system stellar components, the absolute magnitude is too faint to be consistent with a system dominated by a massive ( M⊙) star that could later explode as a core-collapse SN. It appears to be more consistent with a system dominated by a lower mass (below 8 M⊙) giant star of mid-K spectral type.
6 Bolometric light curves, temperatures, and radii
Using the light curves presented in Sect. 3, along with the distance and reddening values computed in Sect. 2, we can estimate the evolution of the luminosity through a blackbody fit to the spectral energy distribution (SED) at selected epochs. This procedure has been previously applied for other LRN studies (e.g. Blagorodnova et al., 2017; Cai et al., 2019; Pastorello et al., 2019b, 2020).
For AT 2020hat, the SED fits were computed by accounting for the contributions of the following bands: Sloan- (until phase +50 d after maximum); Sloan- and ATLAS- (until phase +100 d); Sloan- and ATLAS-; and (from +20 to +100 d). For AT 2020kog, only the contribution of Sloan filter data have been considered, while the PanSTARRS- data were roughly approximated to Sloan-. The flux contribution of the missing bands in the pre-outburst epochs were computed through the gross assumption that the source had the same colours as at maximum light. For both AT 2020hat and AT 2020kog, the SEDs are fairly well fitted by single blackbody functions, and the bolometric luminosity for each epoch was computed by integrating the inferred blackbody flux over the entire electromagnetic spectrum. The resulting bolometric light curves are compared in Fig. 7 (top panel) with that of AT 2015dl/M101-2015OT1 (Blagorodnova et al., 2017), an object whose luminosity is intermediate between those of the two LRNe discussed here.
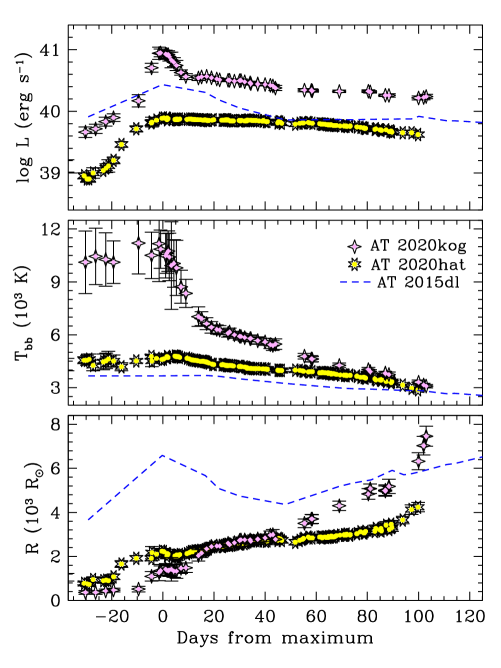
The comparison with AT 2015dl is interesting because it has an intermediate luminosity between AT 2020hat and AT 2020kog. After the rise, AT 2020kog peaks at almost erg s-1, then rapidly declines until reaching the plateau at about erg s-1. Instead, AT 2020hat is about one order of magnitude fainter at maximum, peaking at erg s-1, and then its luminosity declines by almost a factor of 2 at phase 70 d after peak. AT 2015dl stays in the middle, although it has a much more prominent second maximum, while both AT 2020hat and AT 2020kog show a longer lasting plateau. An interpretation of the shapes of the LRN light curves is given in Sect. 7.
The blackbody temperature () evolution of the three LRNe is shown in Fig. 7 (middle panel). While AT 2020kog is initially hot (with temperatures K), AT 2020hat is much cooler, having about 4700 K at maximum (hence comparable with the photosphere of an intermediate K-type star), with a temperature which is similar (slightly higher) than that of AT 2015dl. We note, however, that the pre-maximum temperatures of the two LRNe are highly uncertain due to the incomplete colour information regarding the pre-outburst epochs. With time, the temperature of AT 2020hat declines very slowly ( K at about 3 months after maximum, which is consistent with that of an intermediate M-type star), while the temperature of AT 2020kog goes down much more rapidly, decreasing by a factor of two in two months and by a factor of three in the final epochs of the monitoring campaign.
Fig. 7 (bottom panel) shows the evolution of the photospheric radii of AT 2020hat and AT 2020kog, obtained through the Stefan-Boltzmann law. For both objects, the pre-outburst radius is relatively small at about 2 AU. Then, at the maximum light, the photospheric radius of AT 2020hat and AT 2020kog increases to 10.3 and 7 AU (hence, about 2200 and 1500 R⊙), respectively. At 3 months after peak, the radii of AT 2020hat and AT 2020kog monotonically rise with time reaching about 16 AU (i.e. 3400 R⊙) and 25 AU (5400 R⊙), respectively. At phases +100 days, when the optical light curves decline very rapidly and the SED peak shifts towards the NIR domain, the photospheric radius is expected to rise significantly. In the case of AT 2020kog, the radius increases by 50 per cent in about two weeks. We also note that, at early phases, the photospheric radii of AT 2020hat and AT 2020kog are much smaller than that of AT 2015dl, but they become reasonably similar at late phases. In addition, while AT 2015dl shows a photospheric radius receding from 6500 to 4300 R⊙ from the peak to 50 days after, this behaviour is not seen in AT 2020hat or AT 2020kog, which have a low-contrast early peak.
7 Photometric parameters of LRNe
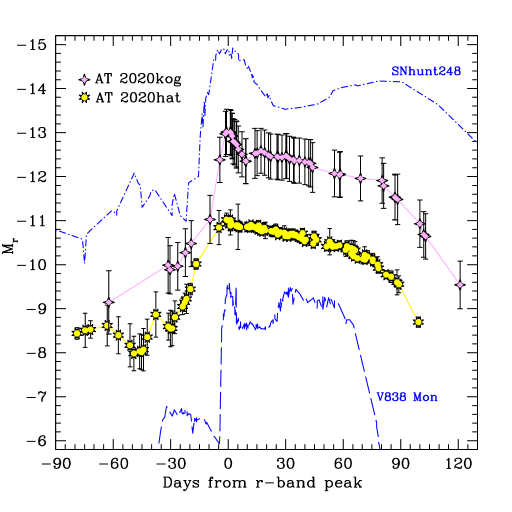
AT 2020hat and AT 2020kog belong to the growing group of LRNe that were detected before the luminous outburst. The absolute magnitude of AT 2020hat in the last three months before the outburst ranges from mag to mag, with the light curve showing some fluctuations superposed on a general trend of luminosity rise (Fig. 8). The pre-outburst phase of AT 2020kog was also less densely sampled because of its faintness. However, in the last 50 d before the outburst, the object monotonically brightens from mag to mag (see, Fig. 8).
The pre-outurst light curves of AT 2020hat and, more marginally, AT 2020kog are similar to those observed in other LRNe, such as V1309 Sco (Tylenda et al., 2011) and M31-LRN2015 (phases 1 to 3 as described in Blagorodnova et al., 2020, see their figure 2). The initial slow luminosity rise observed in these LRNe accompanied by a low-contrast modulation in the light curve is usually interpreted as due to an increasing mass loss through the L2 point that generates an expanding photosphere (Pejcha et al., 2017). When this common envelope engulfs the binary, the luminosity decreases and the light curve shows a minimum, along with the disappearance of the superposed light-curve modulation. A further mass loss or shock interaction produced by the L2 outflow may cause a modest, later rebrightening, as those also observed in AT 2020hat and AT 2020kog.
This phase is followed by a major outburst, during which AT 2020hat and AT 2020kog reach mag and mag, respectively. This light curve peak is likely due to a hot, high-velocity gas outflow in polar direction following the system coalescence (Metzger & Pejcha, 2017). We note that AT 2020hat has a modest early peak, while it is much more prominent in AT 2020kog. The differences in the early LRN light curve shapes can be explained through the geometry of the system and the variety of masses involved in the process. This phase is then followed by a plateau, lasting 2-3 months, which is reminiscent of that seen in type IIP SNe, rather than a broad, red second peak observed in the most luminous events (Pastorello et al., 2019a). Radiative shocks generated in the interaction between the newly expelled fast outflow and slower circumstellar material ejected before the coalescence power the plateau (Metzger & Pejcha, 2017). The material gathered through the shocks then produces a cool dense shell where dust may form in short time scales. The progressively increasing photospheric radius and the slow decline of temperature observed in this phase (see Sect. 6) are fairly well explained with this scenario. Nonetheless, the mechanisms producing the heterogeneous photometric observables of LRNe are still under debate (e.g. MacLeod et al., 2017).
Despite the uncertainties in the mechanism powering the light curves of LRNe, it is reasonable to assume that the ejected and total masses involved are key parameters to explain the widely heterogeneous photometric properties of these gap transients. Pastorello et al. (2019a) propose that individual features of the light curve (the -band absolute magnitudes of the pre-outburst rise, the first peak, and the second peak or the plateau) are correlated with the intrinsic luminosity of the quiescent progenitor, while Kochanek et al. (2014) state that the light curve peak magnitudes are correlated with the total mass of the progenitor system.
Unfortunately ultra-deep pre-explosion images of the host of AT 2020kog are not available, hence very few constraints can be placed on the luminosity of its progenitor. The stacked Pan-STARRS images allowed us to only set detection limits for the progenitor of AT 2020kog down to and mag. The pre-outburst brightest Pan-STARRS -band magnitude of AT 2020kog was converted to Johnson- through the relations given by Tonry et al. (2012), while Johnson- magnitudes of the two main peaks were obtained from the -band magnitudes adopting the prescriptions of Chronis & Gaskell (2008) and the available colour information. In order to obtain the desired magnitudes of the pre-outburst maximum of AT 2020hat, along with those of the two main peaks, we used the available Sloan- and magnitudes, transformed to Johnson- following Chronis & Gaskell (2008). When Sloan filter magnitudes were not available, they were estimated from the ATLAS- and magnitudes using the relations of Tonry et al. (2018) and Tonry et al. (2012) to account for the conversion from Pan-STARRS to Sloan photometry systems. A similar approach was also adopted for other LRNe without a -band observation at the crucial epochs discussed here (see, also, Pastorello et al., 2019a). Following these prescriptions, from the stacked Pan-STARRS images, we infer an upper limit for the absolute magnitude of the quiescent progenitor of AT 2020kog of mag.
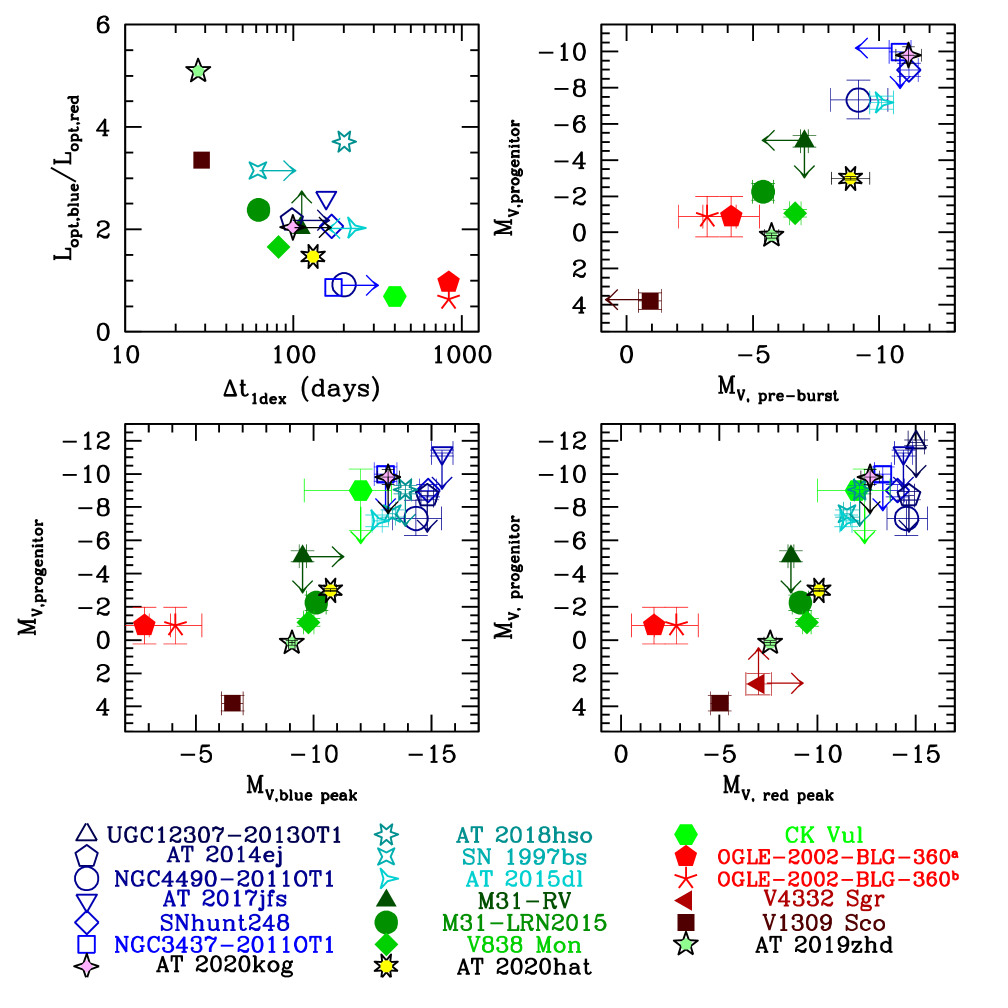
As discussed in Sect. 5, we can place much tighter constraints on the progenitor of AT 2020hat. Using the conversion formula between HST and Johnson- (Dolphin, 2000), the quiescent progenitor of AT 2020hat would have a relatively faint absolute magnitude, that is mag. For these two objects and the recent LRN AT 2019zhd (Pastorello et al., 2020), we can compute the absolute magnitudes of the brightest pre-outburst phase, and those of the blue peak and the red peak (or the plateau). Their photometric parameters can be compared with those of other LRNe from the literature in the updated version of the diagram originally presented in Pastorello et al. (2019a) (see Fig. 9), with the inclusion of AT 2018hso (Cai et al., 2019), AT 2014ej from Stritzinger et al. (2020b), AT 2019zhd (Pastorello et al., 2020), and the two LRNe discussed in this paper. In the top-left panel, we also report where LRNe are located in the diagram showing the ratio between blue and red peak optical luminosities versus the time during which the LRN light curves stay in the luminosity range between and .
We note that the parameters of M31-LRN2015 (Williams et al., 2015; Kurtenkov et al, 2015; Lipunov et al, 2017; Blagorodnova et al., 2020), M31-RV (Boschi & Munari, 2004, and references therein)151515The -band light curve parameters of M31-RV have been fine-tuned including a few observations from Bryan & Royer (1992), which were not considered in Boschi & Munari (2004)., and OGLE-2002-BLG-360 (Tylenda et al., 2013) have been updated with respect to those discussed in Pastorello et al. (2019a). In particular, as the light curve of OGLE-2002-BLG-360 is peculiar and shows a triple peak, we discuss two scenarios: Scenario (a), in which the first maximum corresponds to the brightest pre-merging detection, the second maximum is the blue peak, and the third one is the red peak; Scenario (b) assumes that the first light-curve maximum is coincident with the blue peak, the second maximum is the red peak, while the third maximum is an unprecedented late optical re-brightening, which has never been observed in other LRNe thus far161616To date, a late third light curve peak has only been observed in LRN AT 2017jfs, but in the NIR domain (Pastorello et al., 2019b).. Finally, we have revised the distance estimate of the Galactic LRN CK Vul, adopting the value reprted by Banerjee et al. (2020)171717For CK Per, Banerjee et al. (2020) inferred a distance of kpc and adopted a total line-of-sight absorption of mag from Marshall et al. (2006)..
While we confirm the existence of a correlation between the progenitor absolute magnitude and the light curve luminosity as discussed in Pastorello et al. (2019a), in this paper, we also note another general trend among LRNe. In particular, objects with a larger blue peak to red peak luminosity ratio have light curves fading more rapidly in luminosity (Fig. 9; top-left panel).
On the bright extreme of the LRN luminosity function (see Fig. 9), we find extra-galactic events, such as NGC 4490-2011OT1 (Smith et al., 2016; Pastorello et al., 2019a), SNhunt248 (Kankare et al., 2015; Mauerhan et al., 2015), and AT 2015dl (Goranskij et al., 2016; Blagorodnova et al., 2017; Pastorello et al., 2019a). They are likely produced by massive, hot stellar systems, with masses of a few tens of M⊙ (Smith et al., 2016; Blagorodnova et al., 2017; Mauerhan et al., 2018; Pastorello et al., 2019a). The final outcomes of these high-luminosity LRNe are massive stars that will complete the nuclear burning cycles, finally exploding as core-collapse SNe. A significant fraction of core-collapse SNe are in fact expected to arise in close binary systems, including those producing a massive merger (e.g. Zapartas et al., 2017). A massive stellar merger, for instance, was proposed to explain the peculiar circumstellar environment of SN 1987A and its blue supergiant progenitor (Morris & Podsiadlowski, 2007).
On the faint side of the LRN luminosity function, we have faint Galactic transients, such as V1309 Sco (Mason et al., 2010; Tylenda et al., 2011; Walter et al., 2012), V4332 Sgr (Martini et al., 1999; Kimeswenger, 2006; Goranskij & Barsukova, 2007), and OGLE 2002-BLG-360 (Tylenda et al., 2013). These transients are likely produced by cooler low mass systems, with a primary of about 1 M⊙ and a secondary of 0.1M⊙ (or even less). While a binary interaction may produce a single stellar merger (Tylenda et al., 2011), the binary system producing an LRN may also survive after the common envelope ejection. After the expansion of the giant primary, the loss of orbital momentum reduces its separation from the low-mass companion. This leads to the ejection of the common envelope and the birth of a short-period binary, such as the WZ Sge cataclysmic variables, which were formed by a white dwarf and a low-mass cool dwarf (Webbink & Politano, 1993; Kato, 2015). However, there are additional configurations that may produce LRN outbursts, including more complex multiple systems. For instance, V4332 Sgr was proposed to be a triple system, with the LRN ouburst being produced by a contact binary (Barsukova et al., 2014). Regardless of the evolutionary paths of their progenitor systems, the outcomes of lower-luminosity LRNe will likely end their life without producing an SN explosion.
In this framework, AT 2020kog can be regarded among the most luminous events generating massive mergers, while AT 2020hat has intermediate photometric properties similar to those of AT 2015dl. AT 2019zhd (whose progenitor was over three mag fainter and redder than that of AT 2020hat, Pastorello et al., 2020) shares instead some similarity with other LRNe discovered in M 31, and more marginally with V838 Mon, hence the merger is likely a low to moderate-mass star, which is not expected to end its life as a core-collapse SN.
While light curve modelling (e.g. MacLeod et al., 2017; Metzger & Pejcha, 2017) has improved our knowledge on the LRN outburst mechanisms, very little is known about their progenitor systems. Strategies with high-cadence multiband observations are necessary to better understand the binary properties and the masses of the two components during the pre-merger phase of orbital instability, as has been done for V1309 Sco (Tylenda et al., 2011) and – with less accuracy – M31-LRN2015 (Blagorodnova et al., 2020). In addition, future deep images with high spatial resolution will verify our predictions as to the fate of the final merger, in particular through information provided by multi-domain observations, as imaging in a single domain (e.g. Bond & Siegel, 2006; Bond, 2018) has often remained ambiguous.
Acknowledgements.
We thank David Buckley for providing acquisition imaging taken with the Southern African Large Telescope (SALT), and Paolo Ochner for providing a few images taken with the Copernico Telescope of Asiago (INAF-Osservatorio Astronomico di Padova). We are grateful to the referee V. Goranskij for carefully reading the manuscript and for the insightful comments.MF gratefully acknowledges the support of a Royal Society – Science Foundation Ireland University Research Fellowship.
Research by SV and YD is supported by NSF grants AST–1813176 and AST-2008108.
Time domain research by DJS is supported by NSF grants AST-1813466, 1908972, and by the Heising-Simons Foundation under grant #2020-1864.
YZC is supported in part by National Natural Science Foundation of China (NSFC grants 12033003, 11633002, 11325313, and 11761141001), National Program on Key Research and Development Project (grant no. 2016YFA0400803), and Ma Huateng Foundation.
DJ acknowledges support from the State Research Agency (AEI) of the Spanish Ministry of Science, Innovation and Universities (MCIU) and the European Regional Development Fund (FEDER) under grant AYA2017-83383-P. DJ also acknowledges support under grant P/308614 financed by funds transferred from the Spanish Ministry of Science, Innovation and Universities, charged to the General State Budgets and with funds transferred from the General Budgets of the Autonomous Community of the Canary Islands by the Ministry of Economy, Industry, Trade and Knowledge.
SJS and KWS acknowledge funding from STFC Grants ST/P000312/1, ST/T000198/1 and ST/S006109/1.
EC and AF are partially supported by the PRIN-INAF 2017 with the project Towards the SKA and CTA era: discovery, localisation, and physics of transients sources (P.I. M. Giroletti).
MS is supported by generous grants from Villum FONDEN (13261,28021) and by a project grant (8021-00170B) from the Independent Research Fund Denmark.
This work is based on observations made with the Nordic Optical Telescope, operated by the Nordic Optical Telescope Scientific Association at the Observatorio del Roque de los Muchachos, La Palma, Spain, of the Instituto de Astrofisica de Canarias; the Gran Telescopio Canarias (GTC), installed in the Spanish Observatorio del Roque de los Muchachos of the Instituto de Astrofísica de Canarias, in the Island of La Palma; the Liverpool Telescope operated on the island of La Palma by Liverpool John Moores University at the Spanish Observatorio del Roque de los Muchachos of the Instituto de Astrofísica de Canarias with financial support from the UK Science and Technology Facilities Council; the Italian Telescopio Nazionale Galileo (TNG) operated on the island of La Palma by the Fundación Galileo Galilei of the INAF (Istituto Nazionale di Astrofisica) at the Spanish Observatorio del Roque de los Muchachos of the Instituto de Astrofísica de Canarias. This work makes also use of observations from the LCOGT network.
This work has made use of data from the Asteroid Terrestrial-impact Last Alert System (ATLAS) project. ATLAS is primarily funded to search for near earth asteroids through NASA grants NN12AR55G, 80NSSC18K0284, and 80NSSC18K1575; byproducts of the NEO search include images and catalogs from the survey area. The ATLAS science products have been made possible through the contributions of the University of Hawaii Institute for Astronomy, the Queen’s University Belfast, the Space Telescope Science Institute, and the South African Astronomical Observatory, and The Millennium Institute of Astrophysics (MAS), Chile.
The Pan-STARRS1 Surveys (PS1) and the PS1 public science archive have been made possible through contributions by the Institute for Astronomy, the University of Hawaii, the Pan-STARRS Project Office, the Max-Planck Society and its participating institutes, the Max Planck Institute for Astronomy, Heidelberg and the Max Planck Institute for Extraterrestrial Physics, Garching, The Johns Hopkins University, Durham University, the University of Edinburgh, the Queen’s University Belfast, the Harvard-Smithsonian Center for Astrophysics, the Las Cumbres Observatory Global Telescope Network Incorporated, the National Central University of Taiwan, the Space Telescope Science Institute, the National Aeronautics and Space Administration under Grant No. NNX08AR22G issued through the Planetary Science Division of the NASA Science Mission Directorate, the National Science Foundation Grant No. AST-1238877, the University of Maryland, Eotvos Lorand University (ELTE), the Los Alamos National Laboratory, and the Gordon and Betty Moore Foundation.
This publication is partially based on observations obtained with the Samuel Oschin 48-inch Telescope at the Palomar Observatory as part of the Zwicky Transient Facility project. ZTF is supported by the National Science Foundation under Grant No. AST-1440341 and a collaboration including Caltech, IPAC, the Weizmann Institute for Science, the Oskar Klein Center at Stockholm University, the University of Maryland, the University of Washington, Deutsches Elektronen-Synchrotron and Humboldt University, Los Alamos National Laboratories, the TANGO Consortium of Taiwan, the University of Wisconsin at Milwaukee, and Lawrence Berkeley National Laboratories. Operations are conducted by COO, IPAC, and UW.
This research has made use of the NASA/IPAC Extragalactic Database (NED) which is operated by the Jet Propulsion Laboratory, California Institute of Technology, under contract with the National Aeronautics and Space Administration. This publication made also use of data products from the Two Micron All Sky Survey, which is a joint project of the University of Massachusetts and the Infrared Processing and Analysis Center/California Institute of Technology, funded by NASA and the NSF.
This publication makes use of data products from the Two Micron All Sky Survey, which is a joint project of the University of Massachusetts and the Infrared Processing and Analysis Center/California Institute of Technology, funded by the National Aeronautics and Space Administration and the National Science Foundation.
References
- Abbott et al. (2016) Abbott, B. P., et al. 2016, ApJ, 812, L22
- Abbott et al. (2017) Abbott, B. P., et al. 2017, ApJ, 848, L12 !
- Banerjee et al. (2020) Banerjee, D. P. K., et al. 2020, ApJ, 904, L23
- Barsukova et al. (2014) Barsukova, E. A., Goranskij, V. P., Valeev, A. F., Zharova, A. V. 2014, Astrophys. Bull., 69, 67
- Blagorodnova et al. (2017) Blagorodnova, N., et al. 2017, ApJ, 834, 107
- Blagorodnova et al. (2020) Blagorodnova, N., et al. 2020, MNRAS, 496, 3229
- Bond & Siegel (2006) Bond, H. E., Siegel, M. H. 2006, AJ, 131, 984
- Bond et al. (2009) Bond, H. E., et al. 2009, ApJ, 695, L154
- Bond (2018) Bond, H. E. 2018, Research Notes of the American Astronomical Society, 2, 176
- Boschi & Munari (2004) Boschi, F., Munari, U. 2004, A&A, 418, 869
- Botticella et al. (2009) Botticella, M. T., et al. 2009, MNRAS, 398, 1041
- Bryan & Royer (1992) Bryan, J., Royer, R. E. 1992, PASP, 104, 179
- Cai et al. (2018) Cai, Y.-Z., et al. 2018, MNRAS, 480, 3424
- Cai et al. (2019) Cai, Y.-Z., et al. 2019, A&A, 632, L6
- Cappellaro (2014) Cappellaro, E. 2014, “SNOoPY: a package for SN photometry”, http://sngroup.oapd.inaf.it/snoopy.html
- Chambers et al. (2019) Chambers, K. C., et al. 2019, pre-print arXiv:1612.05560 (version 4)
- Chronis & Gaskell (2008) Chronis, T. S., Gaskell, C. M. 2008, AJ, 135, 264
- Crause et al. (2003) Crause, L. A., et al. 2003, MNRAS, 341, 785
- Dolphin (2000) Dolphin, A. E. 2000, PASP, 112, 1383
- Flewelling et al. (2020) Flewelling, H. A., et al. 2020, ApJS, 251, 7
- Fulton et al. (2020) Fulton, M., et al. 2020, TNSAN, 107, 1
- Goranskij et al. (2002) Goranskij, V. P., et al. 2002, Astr. Lett., 28, 691
- Goranskij & Barsukova (2007) Goranskij, V. P., Barsukova, E. A. 2007, Astronomy Reports, 51, 126
- Goranskij et al. (2016) Goranskij, V. P., Barsukova, E. A., Spiridonova, O. I., et al. 2016, Astrophysical Bulletin, 71, 82
- Herrmann et al. (2008) Herrmann, K. A., Ciardullo, R., Feldmeier, J. J., Vinciguerra, M., 2008, ApJ, 683, 630
- Holmbo et al. (2019) Holmbo, S., et al. 2019, Astron. Tel., 12661, 1
- Howitt et al. (2020) Howitt, G., et al. 2020, MNRAS, 492, 3329
- Ivanova et al. (2013) Ivanova, N., et al. 2013, AARv, 21, 59
- Kamiński et al. (2009) Kamiński, T., Schmidt, M., Tylenda, R., Konacki, M., Gromadzki, M. 2009, ApJS, 182, 33
- Kankare et al. (2015) Kankare, E., et al. 2015, A&A, 581, L4
- Karachentsev et al. (2017) Karachentsev, I. D., et al. 2017, MNRAS, 469, L113
- Kasliwal (2012) Kasliwal, M. M. 2012, PASA, 29, 482
- Kato (2015) Kato, T. 2015, PASJ, 67, 109
- Kimeswenger et al. (2002) Kimeswenger, S., et al. 2002, MNRAS, 336, L43
- Kimeswenger (2006) Kimeswenger, S. 2006, Astron. Nachrichten, 327, 44
- Klencki et al. (2020) Klencki, J., Nelemans, G., Istrate, A. G., Chruslinska, M. 2020, A&A, in press, ArXiv eprints (arXiv:2006.11286)
- Kochanek et al. (2014) Kochanek C. S., Adams S. M., Belczynski K. 2014, MNRAS, 443, 1319
- Kochanek et al. (2017) Kochanek, C. S., et al. 2017, PASP, 129, 104502
- Kulkarni et al. (2007) Kulkarni, S., et al. 2007, Nature, 447, 458
- Kurtenkov et al (2015) Kurtenkov, A. A., et al. 2015, A&A, 578, L10
- Lipunov et al (2017) Lipunov, V. M., et al. 2017, MNRAS, 470, L2339
- MacLeod et al. (2017) MacLeod, M., et al. 2017, ApJ, 835, 282
- MacLeod et al. (2018) MacLeod, M., et al. 2018, ApJ, 863, 5
- MacLeod & Loeb (2020a) MacLeod, M., Loeb, A. 2020a, ApJ, 893, 106
- MacLeod & Loeb (2020b) MacLeod, M., Loeb, A. 2020b, ApJ, 895, 29
- Magnier et al. (2020) Magnier, E. A., et al. 2020, ApJS, 251, 6
- Marshall et al. (2006) Marshall, D. J., et al. 2006, A&A, 453, 635
- Martini et al. (1999) Martini, et al. 1999, AJ, 119, 1034
- Masci et al. (2018) Masci, F. J., et al. 2018, PASP, 131, 995
- Mason et al. (2010) Mason, E., et al. 2010, AA, 516, 108
- Mauerhan et al. (2015) Mauerhan, J. C., et al. 2015, MNRAS, 447, 1922
- Mauerhan et al. (2018) Mauerhan, J. C., et al. 2018, MNRAS, 473, 3765
- Metzger & Pejcha (2017) Metzger, B. D., Pejcha, O. 2017, MNRAS, 471, 513
- Moore (1945) Moore, C. E. 1945, Contributions from the Princeton University Observatory, 20, 1
- Morris & Podsiadlowski (2007) Morris, T., Podsiadlowski, P. 2007, Science, 315, 1103
- Mould et al. (2000) Mould, J. R., et al. 2000, ApJ, 529, 786
- Munari & Zwitter (1997) Munari, U., Zwitter, T. 1997, A&A, 318, 269
- Munari et al. (2002) Munari, U., et al. 2002, A&A, 389, L51
- Pastorello et al. (2007) Pastorello, A., et al. 2007, Nature, 449, 1
- Pastorello & Fraser (2019) Pastorello, A., Fraser, M. 2019, Nat. Astron., 3, 676
- Pastorello et al. (2019a) Pastorello, A., et al. 2019a, A&A, 630, 75
- Pastorello et al. (2019b) Pastorello, A., et al. 2019b, A&A, 625, L8
- Pastorello et al. (2020) Pastorello, A., et al. 2020, A&A, in press, ArXiv eprints (arXiv:2011.10588)
- Pejcha et al. (2016a) Pejcha, O., Metzger, B. D., Tomida, K. 2016a, MNRAS, 455, 4351
- Pejcha et al. (2016b) Pejcha, O., Metzger, B. D., Tomida, K. 2016b, MNRAS, 471, 3200
- Pejcha et al. (2017) Pejcha, O., Metzger, B. D., Tyles, J. G., Tomida, K. 2017, ApJ, 850, 59
- Phillips et al. (2013) Phillips, M. M., et al. 2013, ApJ, 779, 38
- Pisano et al. (2011) Pisano, D. J., et al. 2011, ApJS, 197, 28
- Poznanski et al. (2012) Poznanski, D., Prochaska, J. X., Bloom, J. S. 2012, MNRAS, 426, 1465
- Reguitti et al. (2020) Reguitti, A., et al. 2020, Astron. Telegram, 13644, 1
- Ryder et al. (2020) Ryder, S. D., et al. 2020, Astron. Telegram, 13642, 1
- Segev et al. (2019) Segev, R., Sabach, E., Soker, N., et al. 2019, ApJ, 884, 58
- Schlafly & Finkbeiner (2011) Schlafly, E. F., Finkbeiner, D. P. 2011, ApJ, 737, 103
- Shappee et al. (2014) Shappee, B. J., et al. 2014, ApJ, 788, 48
- Skrutskie et al. (2006) Skrutskie, M. F., et al. 2006, AJ, 131, 1163
- Smartt et al. (2019) Smartt, S. J., et al. 2019, TNSAN, 48, 1
- Smith et al. (2016) Smith, N., et al. 2016, MNRAS, 458, 950
- Smith et al. (2020) Smith, K. W., et al. 2020, PASP, 132, 085002
- Soker (2020) Soker, N. 2020, ApJ, 893, 20
- Soker & Kaplan (2020) Soker, N., Kaplan, N. 2020, Res. Astron. Astrophys., in press, ArXiv eprints (arXiv:2007.06472)
- Stritzinger et al. (2018) Stritzinger, M. D., et al. 2018, A&A, 609, 135
- Stritzinger et al. (2020a) Stritzinger, M. D., et al. 2020a, A&A, 639, 103
- Stritzinger et al. (2020b) Stritzinger, M. D., et al. 2020b, A&A, 639, 104
- Tartaglia et al. (2018) Tartaglia, L., et al. 2018, ApJ, 853, 62
- Tylenda (2005) Tylenda, R. 2005, AA, 436, 1009
- Tylenda et al. (2011) Tylenda, R., et al. 2011, AA, 528, 114
- Tylenda et al. (2013) Tylenda, R., et al. 2013, A&A, 555, 16
- Tonry et al. (2012) Tonry, J. L., et al. 2012, ApJ, 750, 99
- Tonry et al. (2018) Tonry, J. L., et al. 2018, PASP, 130, 064505
- Tully et al. (2016) Tully, R. B., Curtois, H. M., Sorce, J. G. 2016, AJ, 152, 50
- Turatto et al. (2003) Turatto, M., Benetti, S., Cappellaro, E. 2003, in Hillebrandt W., Leibundgut B. eds, From Twilight to Highlight: The Physics of Supernovae. Springer-Verlag, Berlin, p. 200
- Walter et al. (2012) Walter, F. M., Battisti, A., Towers, S. E., Bond, H. E., Stringfellow, G. S. 2012, PASP, 124, 1057
- Webbink & Politano (1993) Webbink, R. F., Politano, M. 1993, ASP Conf. Series, 38, 186
- Williams et al. (2015) Williams, S. C., Darnley, M. J., Bode, M. F., Steele, I. A. 2015, ApJ, 805, L18
- Zapartas et al. (2017) Zapartas, E., et al. 2017, A&A, 601, 29