Luminous red nova AT 2019zhd, a new merger in M 31
We present the follow-up campaign of the luminous red nova (LRN) AT 2019zhd, the third event of this class observed in M 31. The object was followed by several sky surveys for about five months before the outburst, during which it showed a slow luminosity rise. In this phase, the absolute magnitude ranged from mag to mag. Then, over a four to five day period, AT 2019zhd experienced a major brightening, reaching a peak of mag and an optical luminosity of erg s-1. After a fast decline, the light curve settled onto a short-duration plateau in the red bands. Although less pronounced, this feature is reminiscent of the second red maximum observed in other LRNe. This phase was followed by a rapid linear decline in all bands. At maximum, the spectra show a blue continuum with prominent Balmer emission lines. The post-maximum spectra show a much redder continuum, resembling that of an intermediate-type star. In this phase, H becomes very weak, H is no longer detectable, and a forest of narrow absorption metal lines now dominate the spectrum. The latest spectra, obtained during the post-plateau decline, show a very red continuum ( 3000 K) with broad molecular bands of TiO, similar to those of M-type stars. The long-lasting, slow photometric rise observed before the peak resembles that of LRN V1309 Sco, which was interpreted as the signature of the common-envelope ejection. The subsequent outburst is likely due to the gas outflow following a stellar merging event. The inspection of archival HST images taken 22 years before the LRN discovery reveals a faint red source ( mag, with mag) at the position of AT 2019zhd, which is the most likely quiescent precursor. The source is consistent with expectations for a binary system including a predominant M5-type star.
Key Words.:
binaries: close - stars: winds, outflows - stars: individual: AT 2019zhd - stars: individual: M31-RV - stars: individual: M31-LRN2015 - stars: individual: V838 Mon1 Introduction
The luminous red nova (LRN) designation covers a heterogeneous class of gap transients (Pastorello & Fraser, 2019). In contrast with other families of gap transients, LRNe span an enormous luminosity range. Intrinsically faint transients ( to mag) such as OGLE 2002-BLG-360 (Tylenda et al., 2013) and V1309 Sco (Mason et al., 2010; Tylenda et al., 2011) are usually observed in our Galaxy, while much brighter events ( mag) such as NGC4490-2011OT1 (Smith et al., 2016; Pastorello et al., 2019a), AT 2015dl in M 101 (Blagorodnova et al., 2017), AT 2017jfs (Pastorello et al., 2019b), and AT 2018hso (Cai et al., 2019) are occasionally discovered in other galaxies. This suggests that faint LRNe are common and can be observed with a rate of once per decade in a galaxy such as the Milky Way, while luminous events are intrinsically rare (Kochanek et al., 2014; Howitt et al., 2020).
The detailed photometric and spectroscopic follow-up of V1309 Sco revealed the physical mechanisms powering at least most of LRN outbursts. For a few years before the outburst, V1309 Sco showed a short-period photometric modulation with a pseudo-period of about 1.4 d due to the inspiraling motion of the secondary star in a binary system. Later, the photometric period started to decline. The photometric modulation disappeared as soon as the light curve reached a minimum followed by a slow luminosity rise of 4 mag, lasting about six months. This was interpreted as the signature of the common-envelope (CE) ejection which obscured the binary system. The final LRN outburst was likely due to the gas outflow following the stellar coalescence. Recent theoretical studies (e.g. Pejcha et al., 2016, 2017; MacLeod et al., 2017, 2018) support this scenario.
Starting from an alternative characterization of the sub-families of gap transients, Soker & Kaplan (2020) recently proposed a jet-powered toy model to explain their observed properties of different types of objects. Regardless of whether the physical scenario is a merging event or simple mass transfer that leaves the binary system intact, the accretion of mass through a disk may launch polar jets (Kashi & Soker, 2016; Soker & Kashii, 2016). The efficient conversion of kinetic energy into radiation produced by the jet colliding with pre-existing circum-stellar material may account for the light curves of LRNe and other gap transients (see, also, Soker, 2020).
The large range of observed peak luminosity of LRNe is related to the different masses involved. Kochanek et al. (2014) propose that the most luminous outbursts are produced by more massive mergers. This finding is supported by Pastorello et al. (2019a), who found a possible correlation between the luminosity of individual light curve features and the luminosity of the quiescent progenitor system.
In this paper, we present the results of our follow-up campaign of LRN AT 2019zhd, which was discovered in M 31. This is the third LRN that has been discovered so far in M 31, after M31-RV (Boschi & Munari, 2004) and M31-LRN2015 (Kurtenkov et al., 2015; Williams et al., 2015; Lipunov et al., 2017; Blagorodnova et al., 2020). Interestingly, all of them have rather similar observational properties. The follow-up campaign of AT 2019zhd has been carried out during the pandemic period in part, and has been affected by a limited access to the observational facilities. Despite these restrictions, the past few months have been prolific in terms of LRN discoveries as AT 2020hat and AT 2020kog (Pastorello et al., 2020) were announced soon after AT 2019zhd.
The format of the paper is as follows. In Sect. 2, we report information on the discovery of AT 2019zhd, along with its distance and interstellar reddening; in Sect. 3, we discuss the photometric properties during the different phases of the LRN evolution, while in Sect. 4 we describe the spectroscopic evolution; in Sect. 5 we analyse the bolometric light curve and the evolution of the photospheric temperature and radius, compared with the other LRNe in M 31; in Sect. 6 we characterise the nature of the progenitor system, while a discussion and a short summary follow in Sect. 7.
2 The discovery of AT 2019zhd
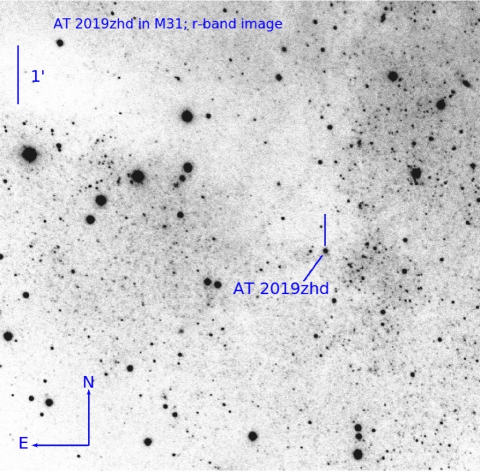
AT 2019zhd111Alternative survey designations are ZTF19adakuot and ATLAS19berq. was discovered by the Zwicky Transient Factory (ZTF) on 2019 December 14.10 UT (Ho, 2019) at an apparent magnitude mag. The transient is observed at RA = and Dec = (equinox J2000.0), which is in the south-west outskirts of the M 31 disk. The object was then spectroscopically classified as a possible luminous blue variable (LBV) outburst or a LRN by Kawabata (2020). The association of the transient with the galaxy is confirmed through its spectra, whose emission lines are slightly shifted towards bluer wavelengths, consistent with the negative recessional velocity of M 31222The redshift of AT 2019zhd measured from our early spectra (see Sect. 4) is consistent with that of the nearby emission line source 2035 () discussed by Merrett et al. (2006).. The region in M 31 with AT 2019zhd is shown in Fig. 1.
The distance of M 31 is well constrained through a number of methods. In this paper, we adopt the statistical estimate from Tully et al. (2013), based on different methods (including cepheids, the tip of the red giant branch, and the surface brightness fluctuation) and scaled to H0 = 73 km s-1 Mpc-1. The inferred distance is Mpc, which provides a distance modulus mag.
The Galactic line-of-sight extinction at the location of the transient is mag (Schlafly & Finkbeiner, 2011). Our early spectra of AT 2019zhd (see Sect. 4) do not show evident absorption features of interstellar Na I that can be attributed to additional host galaxy reddening. For this reason, we assume that the total reddening towards AT 2019zhd is consistent with the Galactic value.
3 Photometric data
Photometric data reduction was carried out using the SNOoPY pipeline (Cappellaro, 2014). After correcting the science images for standard calibration images (bias and flat-fields), and after performing astrometric calibration, SNOoPY allows us to carry out the simultaneous PSF-fitting photometry of the target along with a number of stellar sources in the field of the transient. The instrumental photometry was then calibrated using zero points and colour term corrections inferred, for each night and instrumental configuration, using standard stars from Smith et al. (2002). Finally, the Sloan-band photometry was fine-tuned through a comparison of the magnitudes of a number of stars in the field of AT 2019zhd with those of the SDSS catalogue.
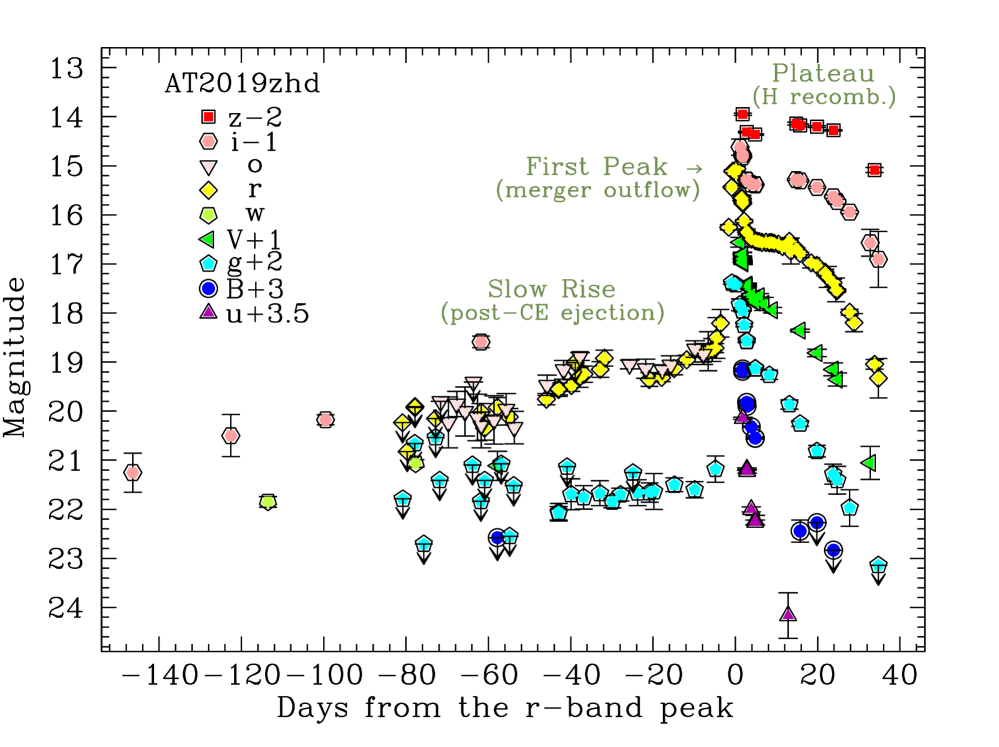
A catalogue of comparison stars in the and Johnson filters was obtained converting SDSS to Johnson-Bessell magnitudes using the transformation relations of Chronis & Gaskell (2008). The final magnitudes of AT 2019zhd are reported in Tables 2 and LABEL:tabA2. The comprehensive multi-band light curves of AT 2019zhd are shown in Fig. 2.
3.1 Pre-outburst phase
Although the object was discovered about two months before the -band light-curve maximum (see Sect. 3.2), we collected data from the major public surveys to track its pre-outburst evolution. Photometric data come from ZTF333The data have been obtained through the Lasair (Smith et al., 2019) and the ALeRCE brokers (Förster et al., 2020). (Bellm et al., 2019; Graham et al., 2019), the Panoramic Survey telescope and Rapid Response System (Pan-STARRS, hereafter PS; Chambers et al., 2019; Magnier et al., 2020), and the Asteroid Terrestrial-impact Last Alert System (ATLAS; Tonry et al., 2018; Smith et al., 2020). While the ZTF photometry was obtained with nearly standard Sloan- and filters, PS provided data in the band (which is close to Sloan-) and the wide () filter (nearly covering the band). ATLAS provided magnitudes in the cyan (hereafter , which is approximately ) and orange (hereafter , nearly ) filters. While the few ATLAS- magnitudes have been converted to Sloan- magnitudes following the prescriptions of Tonry et al. (2018), the PS- and the ATLAS- magnitudes have been left in their original photometric systems.

The earliest detections (from 150 to 100 days before maximum) are provided by the PS survey. From Fig. 2, we note that a very faint source (at mag) was first observed at the location of AT 2019zhd on MJD = 58745.59, hence 146 d before the peak of the outburst (see Sect. 3.2). Then, the source experienced a moderate magnitude rise of mag (100 d)-1 in the band and mag (100 d)-1 in the band (these slopes have been obtained approximating ATLAS- and PS- magnitudes to Sloan-). Finally, a much more evident brightening started on MJD 58887; the evolution of this outburst will be detailed in Sect. 3.2.
3.2 Multi-band light curves
The LRN outburst was well monitored by the surveys mentioned in Sect. 3.1 and, in the band, by the All-Sky Automated Survey for Supernovae (ASAS-SN; Shappee et al., 2014; Kochanek et al., 2017). Supporting multi-band photometry has been obtained at the 2.0m Liverpool Telescope equipped with IO:O and the 2.56 m Nordic Optical Telescope (NOT) with ALFOSC and StanCam444The NOT data have been obtained in the framework of the Nordic optical telescope Unbiased Transient Survey 2 (NUTS2) collaboration (Holmbo et al., 2019); see https://nuts.sn.ie/., hosted at the Roque de los Muchachos (La Palma Canary Islands, Spain); the 1.82m Copernico Telescope with AFOSC, and the 67/92 cm Schmidt Telescope at Mt. Ekar (near Asiago, Italy). Additional unfiltered photometry (scaled to Sloan -band) has been taken using a 35 cm telescope of the Itagaki Astronomical Observatory (Yamagata, Japan).

The rise to the outburst peak is very fast, lasting 4-5 days in the and bands. The peak parameters were determined through a low-order polynomial fit. We obtained that the light curve reached the peak in the -band on MJD = 58892.0 0.5 ( mag), and in the -band on MJD = 58991.5 0.7 ( mag). Hereafter, the epoch of the -band peak will be considered as the reference time in this paper. The maximum is followed by an initially fast decline and then by a flattening, which is marginally visible in the blue bands, while it is more evident in the redder bands. The magnitude of the plateau in the band is mag. A plateau or a broad second maximum have been observed in a number of LRNe (see, Pastorello et al., 2019a, and references therein). However, while the second red peak is prominent in the intrinsically luminous events, usually it is relatively shallow in fainter LRNe (see, e.g. Pastorello et al., 2019a, their figure 15). After the secondary peak (or the plateau) the light curve declines monotonically in all bands. The overall photometric evolution of the outburst in the different bands is shown in Fig. 3.
3.3 Comparison with other LRNe
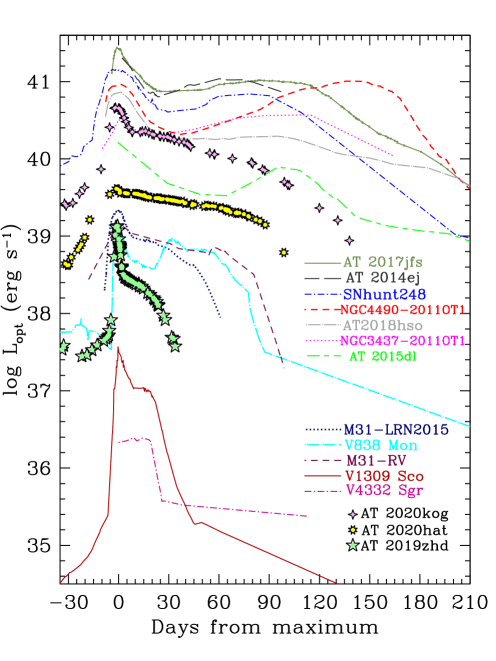
In Fig. 4, we compare the -band absolute light curve, the colour evolution, and the pseudo-bolometric light curve of AT 2019zhd with those of a sample of LRNe (see Pastorello et al., 2019a, and references therein). The top-left panel of Fig. 4 shows the pre-outburst light curves of a few objects whose fields were covered by survey observations, highlighting the pre-outburst photometric evolution of the LRN precursors. In particular, the historical light curve of V1309 Sco published by Tylenda et al. (2011) is considered as a milestone for our comprehension of the LRN phenomenon. V1309 Sco is a Galactic LRN routinely observed by the OGLE project (Udalski, 2003) from 2001 to late 2007, and showed a modulated light curve with photometric period decreasing with time. This photometric variability was likely produced by a binary system that was rapidly losing angular momentum. In early 2008, a broad photometric minimum and a later brightening by 4 mag in about six months were observed, while signatures of a light curve modulation were no longer visible. This was interpreted as the result of the common envelope ejection, which embedded and obscured the two stellar companions. A much more evident outburst, characterised by a brightening by further 4 mags in about one week, was later observed, and is believed to be due to gas outflow triggered by the coalescence of the two stellar cores.
Unfortunately, V1309 Sco is the only LRN for which high signal to noise (S/N) and high cadence photometry is available. For this reason, the past history of binary variability is not detectable for other objects. However, SNhunt248 (Kankare et al., 2015; Mauerhan et al., 2015, 2018), AT 2015dl (Blagorodnova et al., 2017), and OGLE-2002-BLG-360 (Tylenda et al., 2013) showed a long period of slowly rising luminosity before the outburst onset, with in some cases minor to moderate luminosity fluctuations (see, e.g. M31-LRN2015; Blagorodnova et al., 2020).
AT 2019zhd was observed for almost five months before the LRN outburst, during which its absolute magnitude increased from to mag. This relatively slow rise is likely due to the photometric evolution of the stellar system after the common envelope ejection, similarly to V1309 Sco. The light-curve bump observed for a few months before the outburst is closely reminiscent that of V838 Mon (Munari et al., 2002; Goranskij et al., 2002; Kimeswenger et al., 2002; Crause et al., 2003, 2005, see Fig. 4, top-left panel) before the main peak. We also note that the absolute magnitude of AT 2019zhd, both before and during the outburst, is intermediate between luminous extra-galactic events such as SNhunt248 and AT 2015dl, and the faint LRNe observed in the Milky Way, such as V1309 Sco and OGLE-2002-BLG-360. Hence, its absolute magnitude at peak ( mag) is somewhat comparable with that of V838 Mon.
Fig. 4 (bottom-left panel) shows that the colour evolution of AT 2019zhd during the first month after the outburst ranges from about 0 (at the blue peak) to 2 mag at the end of the plateau. This colour becomes redder much more rapidly than what has been observed in the extra-Galactic LRNe discussed in Pastorello et al. (2019a), and this evolution is comparable to those shown by fainter Galactic objects, such as V1309 Sco.
Figure 4 (right panel) compares the quasi-bolometric evolution of AT 2019zhd, obtained after integrating the flux over the optical domain only, with those of a wide sample of LRNe. The luminosity of AT 2019zhd at peak, erg s-1, is similar to that of the prototypical V838 Mon. The optical luminosity of AT 2019zhd is over two orders of magnitude fainter than that of the luminous SNhunt248 (Kankare et al., 2015), AT 2014ej (Stritzinger et al., 2020), and AT 2017jfs (Pastorello et al., 2019b), and about 25 times brighter than V1309 Sco. After maximum, the light curve decline is initially very fast, it flattens after one week, and increases again at late phases. The figure also shows that fainter LRNe have light curves with shorter duration than those of the most luminous counterparts. In general, AT 2019zhd has a luminosity similar to V838 Mon and the other two LRNe in M 31, although with a faster-evolving light curve, which is reminiscent of that of V1309 Sco. The short-duration plateau of AT 2019zhd is likely due to a smaller ejected mass than other LRNe.
4 Spectral evolution
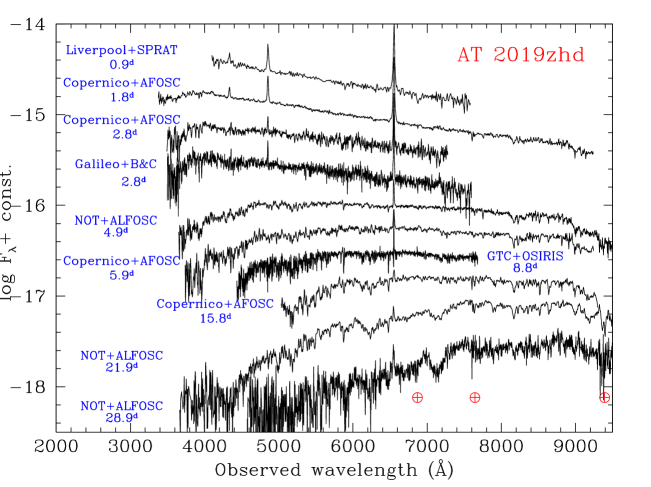
The spectroscopic follow-up of AT 2019zhd lasted about one month. The monitoring campaign was limited by the short visibility window of the object, which was observable only soon after sunset. Nonetheless, we obtained ten spectra using the 2.0 m Liverpool Telescope equipped with SPRAT (Piascik et al., 2014), the 2.56 m NOT with ALFOSC, the 10.4 m Gran Telescopio Canarias (GTC) with OSIRIS, the 1.82 m Copernico Telescope with AFOSC, and the 1.22 m Galilei Telescope with a BC spectrograph. We monitored all crucial phases of the LRN evolution, from the initial blue peak to the end of the plateau. The spectroscopic data were reduced through standard tasks in IRAF666IRAF is distributed by the National Optical Astronomy Observatory, which is operated by the Association of Universities for Research in Astronomy (AURA) under a cooperative agreement with the National Science Foundation. or dedicated pipelines, such as the FOSCGUI777FOSCGUI is a graphic user interface developed by E. Cappellaro, and aimed at extracting supernova spectroscopy and photometry obtained with FOSC-like instruments. A package description can be found at http://sngroup.oapd.inaf.it/foscgui.html.. Technical information on the spectra is reported in Table 1, while the entire spectral sequence is shown in Fig. 5.
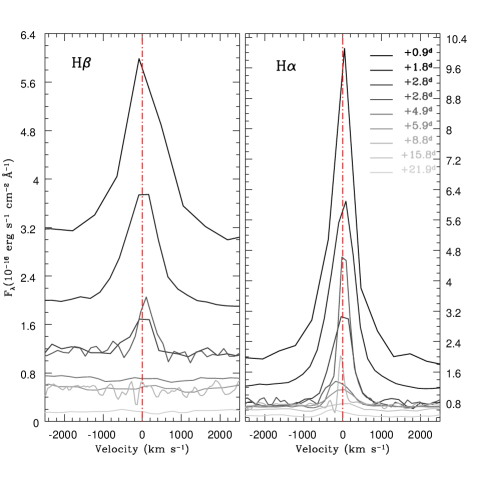
Early spectra, taken soon after the blue peak, show a blue continuum with superposed prominent emission lines of the Balmer series. A number of Fe II features with a predominant emission component are also clearly detected, along with Ca II HK, which is instead observed in absorption. The continuum temperature decreases from to K from 0.9 d to 2.8 d after maximum. The best resolution BC spectrum at +2.8 d (Munari et al., 2020) allows us to constrain an upper limit for the full-width at half-maximum (FWHM) velocity for the H emission, which is about 280 km s-1.
The following spectra show a remarkable transition, with the continuum becoming rapidly redder ( K at 4.9 d, K at 5.9 d, and K at 15.8 d). In a moderate resolution GTC spectrum obtained at 8.8 d after maximum, H shows a P-Cygni profile with an absorption component which is blue-shifted by about 160 km s-1. During the first two weeks past maximum, the Balmer emission components become progressively weaker, and only H is barely visible at 15.8 d, with a slightly blueshifted peak (see Fig. 6). In this phase, the spectrum is dominated by a forest of narrow absorption metal lines. Following Pastorello et al. (2019a, see their figure 10), we identify the prominent Fe II multiplets in absorption, along with Sc II, Ba II, Ti II, Na I doublet, Ca II and O I. This transitional spectrum is typical of LRNe during the second, redder peak (Smith et al., 2016; Blagorodnova et al., 2017; Pastorello et al., 2019b; Cai et al., 2019; Stritzinger et al., 2020), although here the transition is much more rapid, in agreement with the rapid light curve evolution.
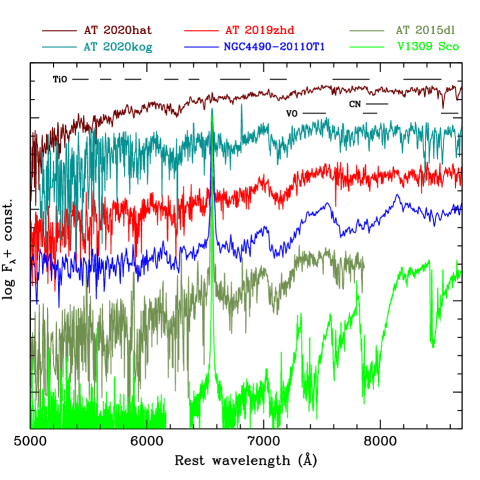
When the light curve starts the fast post-plateau decline, the spectral continuum temperature further decreases to K at 21.9 d, and K at 28.9 d. In these later spectra, broad absorption bands produced by molecules are clearly detected at about 5450 Å, 5900 Å, 6250 Å, 6750 Å, 7150 Å, 7700 Å and 8300 Å; in particular, TiO bands are becoming prominent (Valenti et al., 1998). Again, the presence of molecular bands is a common feature of late-time optical spectra of LRNe (Smith et al., 2016; Blagorodnova et al., 2017; Pastorello et al., 2019a, b; Cai et al., 2019), although it happens earlier in faint, fast-evolving LRNe observed in the Milky Way (e.g. Martini et al., 1999; Munari et al., 2007; Goranskij & Barsukova, 2007; Kamiński et al., 2009; Mason et al., 2010; Barsukova et al., 2014). A comparison of the latest spectrum of AT 2019zhd with late spectra of other LRNe is shown in Fig. 7.
5 Bolometric light curve and evolution of the temperature and the radius
As noted in Sect. 3.2 (see Fig. 4, right panel), AT 2019zhd belongs to the LRN sample having intermediate luminosity at maximum ( mag). This group also includes V838 Mon, and two other LRNe discovered in M 31: M31-LRN2015 (Kurtenkov et al., 2015; Williams et al., 2015; Lipunov et al., 2017; Blagorodnova et al., 2020) and M31-RV (Rich et al., 1989; Mould et al., 1990; Bryan & Royer, 1992; Tomaney & Shafter, 1992; Boschi & Munari, 2004). The fact that only intermediate-brightness LRNe have been discovered in M 31 is somewhat puzzling. While it is not surprising that very luminous LRN events have not been observed so far in M 31 as they are intrinsically rare (Kochanek et al., 2014), faint events similar to V1309 Sco are expected to be common, and they should have been discovered in M 31. One may invoke selection effects to explain the lack of faint red nova discoveries in this galaxy. Objects similar to V1309 Sco, at the distance of M 31, would have a peak apparent magnitude of about 18, hence they should be comfortably observed, unless they occur in crowded or dusty regions. In this respect, we note that a few tens of nova candidates are discovered every year in M 31 in the magnitude range 17-21 mag, and a large fraction of them (nearly 50 , from the on-line database of M 31 novae888https://www.mpe.mpg.de/~m31novae/opt/m31; see Pietsch, 2010) remain unclassified. Hence, it is plausible that low-luminosity events similar to V1309 Sco can be found among these unclassified candidates.
To best characterise the three LRNe in M 31, we now compare their parameters inferred from the available photometric data, adopting a similar approach as MacLeod et al. (2017, see their figure 2). For M31-LRN2015, we adopt a moderate-reddening scenario ( mag, Kurtenkov et al., 2015).
In Fig. 8 (top-right panel), we show the colour curve as in Fig. 4 (bottom-left), but we limit the sample to the three LRNe in M 31. The colour evolution of the three objects is remarkably similar, with growing from about 0.1 mag at maximum to over 1.4-2 mag (depending on the object) after one month. The colour increases more rapidly in AT 2019zhd than in the other two LRNe, reaching mag at about 15 d after maximum. The late evolution, up to +82 d, is observed only for M31-RV, and the colour seems to flatten to mag.
In order to determine the evolution of the bolometric luminosity (), the temperature () and the photospheric radius (), we first construct the spectral energy distribution (SED) for each object, and for any epochs with available multi-band, reddening-corrected photometric data. When the measurement in a determined band is missing, its flux contribution can be estimated through an interpolation using the magnitudes at adjacent epochs, or extrapolating the missing magnitude by assuming a constant colour from the closest epoch. This assumption is very crude, and is critical mainly in the pre-maximum phases, when the object is expected to have a very rapid colour evolution.
The total flux () and are estimated for each epoch through a Monte Carlo simulation. Firstly, flux values at different wavelengths () are generated with a Gaussian distribution centred at the measured , and with a standard deviation equal to the measured Fλ error. Then, we fitted a black-body to the randomly generated values, obtaining an i-th estimate of the total flux and the temperature Tbb,i.
After reiterating this procedure for 200 times, we adopt the median values of and as best estimates of and for that epoch, and the errors are given by the standard deviation of the 200 and estimates. Adopting the distance given in Sect. 2 and assuming spherical symmetry for the emitting source, from we infer for that epoch. Finally, corresponing to the above is obtained through the Stefan-Boltzmann law for an emitting sphere. Trivial error propagation provides the uncertainties on the and estimates. The evolution of , and are obtained by repeating the full procedure for all available epochs. We remark that, while in general a temperature inferred through black-body fits to the SED is not a good proxy for the photospheric temperature in spectra dominated by deep TiO features (e.g. Fluks et al., 1994), this is acceptable in the case of AT 2019zhd, as the TiO bands become relatively prominent only at late epochs (30 days after maximum, see Sect. 4).
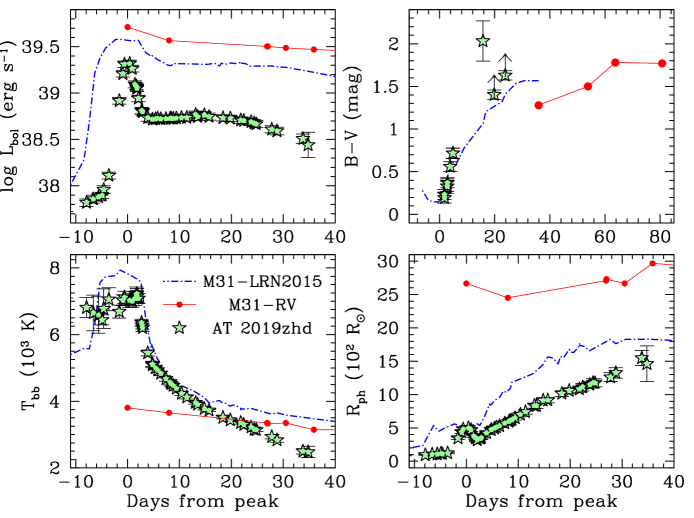
The resulting bolometric light curves of the three objects are shown in Fig. 8 (top-left panel). AT 2019zhd peaks at erg s-1 (hence, L⊙), about two times fainter than M31-LRN2015 ( erg s-1). We note that the bolometric light curve of M31-RV999We assume the epoch of the early peak is MJD = 47355.5 (Mould et al., 1990). Unfortunately, no precise colour information is available at that epoch, and this uncertainty affects the accuracy of the bolometric correction. The first epoch with multi-band photometry was obtained at about 36 d days after the peak. shown here is the most luminous in the M 31 LRN sample, peaking at erg s-1. This is due to the large NIR contribution to the bolometric luminosity, obtained through the NIR observations originally presented by Mould et al. (1990).
The evolution of is shown in Fig. 8 (bottom-left panel). While the pre-maximum evolution is very uncertain for all objects due to the incomplete colour information, from the available data we note that M31-LRN2015 peaks at almost 8000 K, AT 2019zhd peaks at about 7000 K, while M31-RV seems to peak at much lower temperatures ( K). Soon after maximum, their temperatures undergo a fast decline during the first week, and then the decline rates become slower. At one month after maximum, the temperature measured for AT 2019zhd was K, while both M31-RV and M31-LRN2015 have hotter blackbody temperatures, i.e. K and 3600 K, respectively.
Finally, Fig. 8 (bottom-right panel) shows the evolution of . Again, the evolution of is very uncertain in the pre-peak phases for the reasons mentioned above. At maximum, in both AT 2019zhd and M31-LRN2015. After a short-lasting decline soon after peak, increases almost linearly in AT 2019zhd until phase 35 d (). At the same epoch, in M31-LRN2015, while M31-RV appears to be much more expanded, with .
We note that in AT 2019zhd and M31-LRN2015 the evolution of and follows a similar trend as more luminous LRNe, such as AT 2020kog (Pastorello et al., 2020), AT 2018hso (Cai et al., 2019), AT 2017jfs (Pastorello et al., 2019b), and AT 2014ej (Stritzinger et al., 2020), that have higher temperature ( K) and a more compact radius at the early maximum. In contrast, M31-RV is much redder (the temperature is lower by a factor of two) and has a larger radius at maximum. This behaviour is reminiscent of those of AT 2015dl (Blagorodnova et al., 2017) and AT 2020hat (Pastorello et al., 2020), which do not show a prominent early, hot peak. The variety in early-time temperatures and radii of LRNe could be a consequence of the different geometry of the expelled gas, the radii of the two stellar components, the total masses involved, and the final outcome of the dynamic interaction process. Detailed modelling is thus necessary to infer whether the heterogeneous evolution of the above parameters brings some information on the fate of the system. In particular, the LRN observables are expected to be different when the post common-envelope evolution has led to coalescence, or eventually to a new stable binary configuration.
6 The quiescent progenitor
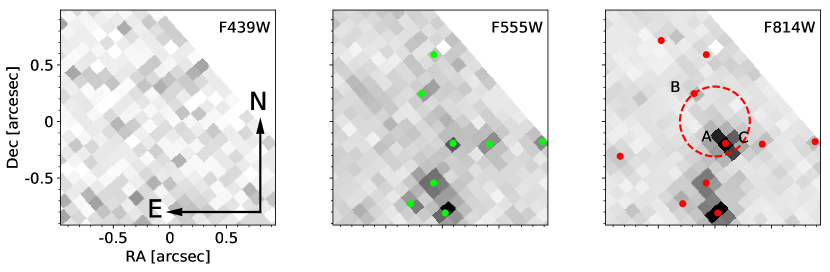
In order to characterise the progenitor of AT 2019zhd, we searched in the Mikulski Archive for Space Telescopes for Hubble Space Telescope (HST) images covering the site of the transient. While M 31 has been observed extensively with HST, the site of AT 2019zhd was only covered by one epoch of multi-band imaging, due to its small field of view. These images were taken with WFPC2 on 1997 December 9, with exposure times of 2350 s, 2260 s and 2260 s in the , and filters respectively. The site of AT 2019zhd falls on the WF4 chip, which has a pixel scale of 0.1″ pix-1, and is unfortunately 10 pixels from the edge of the detector.
To precisely localise the position of AT 2019zhd on the WFPC2 images, we performed differential astrometry between the images and a 35 s -band image of the transient taken on 2020 February 17 with the NOT plus ALFOSC. Seven point sources common to both images were used to determine a geometric transformation. From this, we find the pixel coordinates of AT 2019zhd to be (792.67, 522.15) on the image. The associated uncertainty on this position is 103 mas (1 WF pixel) from the rms scatter of the sources used in deriving the transformation. However, due to systematic effects, this is likely an underestimate of the true uncertainty on the position. Firstly, the only sources visible in common to both the NOT and HST images were bright foreground stars. These will potentially exhibit proper motion at mas level over the 22 years between the HST and NOT images. As AT 2019zhd lies at the extreme edge of the WF4 chip we must extrapolate the geometric transformation (since the reference sources used for the alignment all lie to one side of the transient). Finally, our geometric transformation has six free parameters, while we are only using seven sources to derive the transformation. All things considered, we adopt three times the transform uncertainty (i.e. 0.31″) as a conservative uncertainty on the location of AT 2019zhd in the HST images.
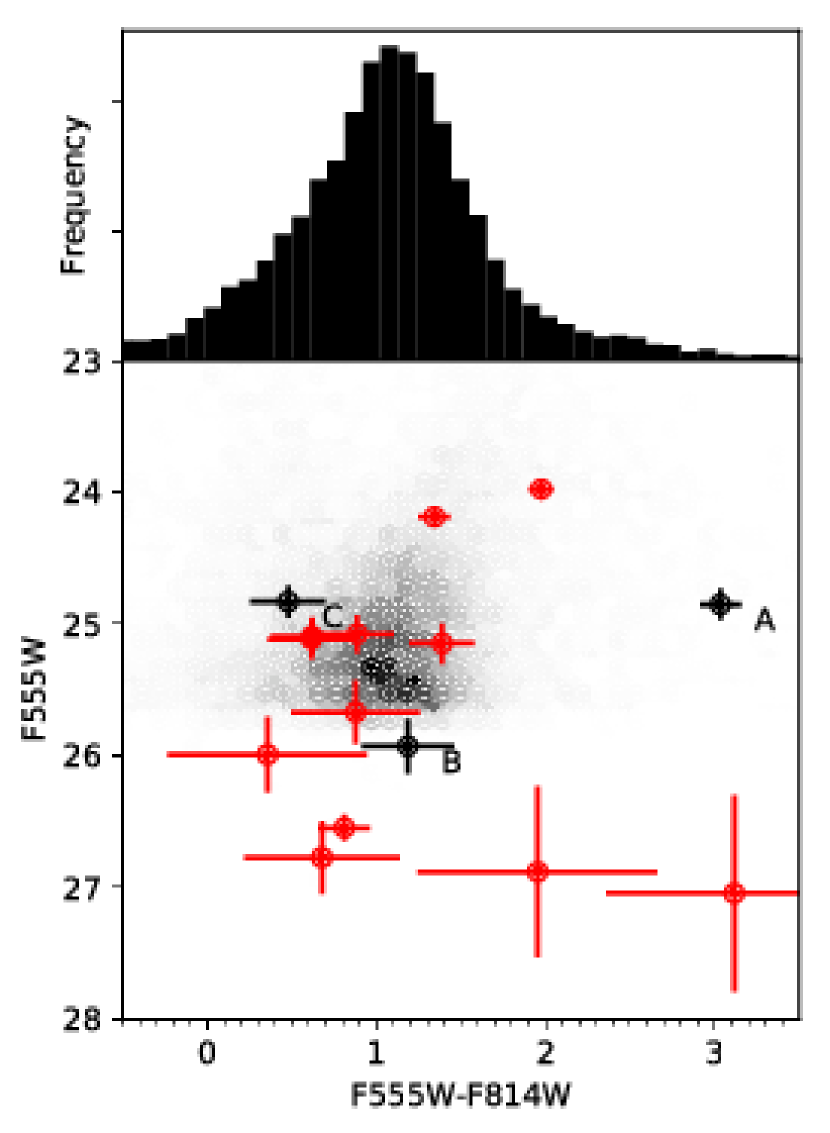
In order to identify sources on the HST images, we used the dolphot photometry package (Dolphin, 2000). All sources detected by dolphot at confidence are plotted in Fig. 9. One source was found to be consistent with the position of AT 2019zhd (designated as Source A), along with two sources just outside our adopted positional uncertainty (Sources B and C). While we regard Source A as a credible counterpart to AT 2019zhd on its location, we note that it also has markedly different colour with respect to the other sources in the field. PSF-fitting photometry was performed for Source A using dolphot, and we find magnitudes for the source (in the Vegamag system) of and mag, while it is not detected in the filter, down to mag. Source A is extremely red, hence it is not surprising it is undetected in the F439W filter. A comparison to other sources in the field in Fig. 10 shows it to be far redder than the majority of sources in the field, and this difference with the local stellar population makes source A as an appealing progenitor candidate for AT 2019zhd.
For Source B, we measure mag; mag; while for Source C, we find mag; mag. As these are further from the location of AT 2019zhd, and appear very similar to other sources in the field, we regard them as unlikely to be the progenitor.
Turning back to Source A, after correcting for foreground reddening (E() mag), and adopting a distance modulus for M 31 of mag, we find an absolute magnitude of M mag and a colour of mag. While this candidate progenitor is much redder than those of most LRNe studied so far (e.g. Pastorello et al., 2019a), its red colour is somewhat reminiscent of that of the progenitor of AT 2020hat (Pastorello et al., 2020). The progenitor of M31-LRN2015 has been also detected in archive images, showing a brighter absolute magnitude (M mag) and a bluer colour ( mag; Williams et al., 2015). We remark that, as most (if not all) LRNe are closely interacting binary systems, the two stellar components contribute to the magnitudes and the colours inferred here.
An alternative scenario is that none of the three sources mentioned above is the progenitor of AT 2019zhd, hence source A is merely a chance alignment with the location of the LRN. Accounting for the detection limits of the HST images, a non-detected progenitor would have mag, mag and mag, hence mag, mag and mag. Such a faint source would not comfortably match the correlations between progenitor versus light curve absolute magnitudes (Pastorello et al., 2019a), as it would fainter than the expected absolute magnitude of the progenitor of a LRN whose light curve peaks at mag (see, also, figure 9 of Pastorello et al., 2020). Moreover, the exceptionally red colour of Source A is markedly different from other sources in the field, and may be explained by a puffed-up star that has formed a common-envelope. For this reason, while we believe that source A remains the most plausible progenitor of AT 2019zhd, a bluer progenitor below the detection threshold of the HST images cannot be definitely ruled out.
7 Discussion and conclusions
In order to infer the -band magnitudes of AT 2019zhd at a few critical phases of its evolution, we apply the conversion relations between photometric systems from Jordi et al. (2006). During the slow magnitude rise before the LRN outburst, AT 2019zhd reaches a maximum -band absolute magnitude mag. Superposed to the global rise, the light curve shows some fluctuations, similar to those observed for instance in M31-LRN2015.
As discussed by Pejcha et al. (2017), the dynamical mass transfer in a binary system, which happens when one star has filled its Roche lobe, may cause a systemic mass loss with a double effect: the decrease of the angular momentum (which may eventually lead the binary to merge) and the formation of an optically thick expanding cocoon (the CE) that engulfs the stellar system (Paczynski, 1976). This phase is characterised by a substantial luminosity decline. Shocks between material ejected in more recent mass-loss events and the CE may cause a renewed luminosity rise, as observed before the outburst of M31-2015LRN and other LRNe (Blagorodnova et al., 2020). The non-monotonic light curve of AT 2019zhd before the main outburst (see Fig. 2) can be explained with a similar mechanism as proposed for M31-2015LRN.
The subsequent luminous blue peak in the light curve of AT 2019zhd at mag is produced by a violent gas ejection during the merging process, which then interacts with the pre-existing circumstellar material (MacLeod et al., 2017). The average magnitude of the plateau (which is considered analogous of the red peak in more luminous events) is mag. This feature in the LRN light curve, characterised by a roughly constant effective temperature, has been explained as due to a hydrogen recombination front which propagates through the expanding gas (Ivanova et al., 2013; Lipunov et al., 2017), similar to that observed during the plateau phase in type IIP supernovae (Popov, 1993). This scenario is also confirmed by the Balmer decrement, which ranges from 2.4 to 2.8 in the first two spectra, consistent with the expectations for Case B recombination, along with the decrease of the Balmer emission lines intensity.
While some observational properties (e.g. the light curve shape with an early, sharp peak followed by a broader maximum or a plateau, and the late spectra reminiscent of those of intermediate-to-late M spectral types) are shared among all LRNe, we have seen in Sect. 5 that other parameters (peak luminosity, effective temperature, and photospheric radius) show a wide diversity which could be due to the dynamical processes occurring in the binary system, and the physical properties of the individual stellar components. Exploring the diversity in the observed parameters through hydro-dynamical models can give some constraints on the main parameters of the binary system and, eventually, the final merger.
Kochanek et al. (2014) proposed a tight relation between the luminosity of the outburst and the total mass of the binary. This is also supported by the correlations of the LRN luminosity with that of the progenitor system before the outburst (Pastorello et al., 2019a), and with the outburst duration (Pastorello et al., 2020). Objects with Lbol at maximum exceeding erg s-1 have been discovered, along with transients whose Lbol is 3-4 orders of magnitude smaller. In the luminosity distribution of LRNe, AT 2019zhd lies in the middle (see figure 9 in Pastorello et al., 2020), sharing similar photometric parameters with objects such as V838 Mon (e.g. Goranskij et al., 2002; Kimeswenger et al., 2002; Munari et al., 2002; Crause et al., 2003; Goranskij et al., 2004; Crause et al., 2005; Goranskij et al., 2020), M31-RV (Bond, 2003; Boschi & Munari, 2004), and M31-LRN2015 (Kurtenkov et al., 2015; Williams et al., 2015; Lipunov et al., 2017; Blagorodnova et al., 2020). This implies that these transients were likely produced by stellar systems with relatively similar masses, intermediate between those of the two groups mentioned above.
The system leading to the M31-LRN2015 event was observed over a decade before the LRN outburst in HST images at mag and mag (Williams et al., 2015) (see, also, Dong et al., 2015), which are typical of a late-G to early K-type stars. The progenitor of M31-LRN2015 was somewhat redder than those discussed in Pastorello et al. (2019a). It is important to note, however, that MacLeod et al. (2017) estimated a somewhat bluer intrinsic colour adopting a higher reddening scenario (up to mag, giving an F spectral type source, see their figure 4). The M31-LRN2015 precursor was likely formed by a primary sub-giant of 3-5.5 M⊙ with a radius of 35 R⊙, and a lower-mass (0.1-0.6 M⊙) main sequence companion (MacLeod et al., 2017; Lipunov et al., 2017). The M31-RV LRN event has somewhat similar photometric characteristics, and the progenitor belongs to a population of old red giants in the M 31 halo. While no information is available on the system before the M31-RV outburst, an in-depth analysis of the LRN location years after the outbursts was performed by some authors, although the results do not give firm constraints on the identification of the survivor. Most likely, the merger faded below the detection limit due to dust obscuration, or the survivor is eventually one of the red giants in the field101010We note that this conclusion was questioned by Shara et al. (2010). (Bond & Siegel, 2006; Bond, 2011, 2018). In the case of AT 2019zhd, a stellar source at the expected position of the quiescent progenitor was tentatively identified in pre-explosion HST archive images, with absolute magnitude mag, and a reddening-corrected colour mag, which is consistent with an intermediate M-type source.
In this context, while the V838 Mon LRN event was relatively similar to the above objects, its progenitor system was more massive and bluer, and hosted in a young stellar population environment (Barsukova et al., 2017; Goranskij et al., 2020, and references therein), somewhat more similar to the environments of the brightest extra-galactic LRNe (Smith et al., 2016; Mauerhan et al., 2015; Goranskij et al., 2016; Blagorodnova et al., 2017; Pastorello et al., 2019a; Cai et al., 2019).
Recent studies on LRNe have confirmed a large heterogeneity in their properties, which is expected since binary interaction leading to merging events may involve stars spanning an enormous range of masses. Further observational efforts and investments in developing theoretical models are necessary to provide robust correlations between the observational parameters and those of the binary progenitor system.
Acknowledgements.
We acknowledge with thanks the variable star observations from the AAVSO International Database contributed by observers worldwide and used in this research.MF gratefully acknowledges the support of a Royal Society – Science Foundation Ireland University Research Fellowship. EK and MS are supported by generous grants from Villum FONDEN (13261,28021) and by a project grant (8021-00170B) from the Independent Research Fund Denmark. SJS and KWS acknowledge funding from STFC Grants ST/P000312/1, ST/T000198/1 and ST/S006109/1. DJ acknowledges support from the State Research Agency (AEI) of the Spanish Ministry of Science, Innovation and Universities (MCIU) and the European Regional Development Fund (FEDER) under grant AYA2017-83383-P. DJ also acknowledges support under grant P/308614 financed by funds transferred from the Spanish Ministry of Science, Innovation and Universities, charged to the General State Budgets and with funds transferred from the General Budgets of the Autonomous Community of the Canary Islands by the Ministry of Economy, Industry, Trade and Knowledge.
This research is based on observations made with the Nordic Optical Telescope, operated by the Nordic Optical Telescope Scientific Association at the Observatorio del Roque de los Muchachos, La Palma, Spain, of the Instituto de Astrofisica de Canarias; the Gran Telescopio Canarias, installed at the Spanish Observatorio del Roque de los Muchachos of the Instituto de Astrofísica de Canarias, in the island of La Palma; the Liverpool Telescope operated on the island of La Palma by Liverpool John Moores University at the Spanish Observatorio del Roque de los Muchachos of the Instituto de Astrofísica de Canarias with financial support from the UK Science and Technology Facilities Council; the 1.82 m Copernico Telescope and the 67/92 cm Schmidt Telescope of INAF-Osservatorio Astronomico di Padova at Mt. Ekar; and the 1.22 Galileo Galilei Telescope of the Padova University in the Asiago site.
This work has made use of data from the Asteroid Terrestrial-impact Last Alert System (ATLAS) project. ATLAS is primarily funded to search for near earth asteroids through NASA grants NN12AR55G, 80NSSC18K0284, and 80NSSC18K1575; byproducts of the NEO search include images and catalogues from the survey area. The ATLAS science products have been made possible through the contributions of the University of Hawaii Institute for Astronomy, the Queen’s University Belfast, the Space Telescope Science Institute, and the South African Astronomical Observatory, and The Millennium Institute of Astrophysics (MAS), Chile.
The Pan-STARRS1 Surveys (PS1) and the PS1 public science archive have been made possible through contributions by the Institute for Astronomy, the University of Hawaii, the Pan-STARRS Project Office, the Max-Planck Society and its participating institutes, the Max Planck Institute for Astronomy, Heidelberg and the Max Planck Institute for Extraterrestrial Physics, Garching, The Johns Hopkins University, Durham University, the University of Edinburgh, the Queen’s University Belfast, the Harvard-Smithsonian Center for Astrophysics, the Las Cumbres Observatory Global Telescope Network Incorporated, the National Central University of Taiwan, the Space Telescope Science Institute, the National Aeronautics and Space Administration under Grant No. NNX08AR22G issued through the Planetary Science Division of the NASA Science Mission Directorate, the National Science Foundation Grant No. AST-1238877, the University of Maryland, Eotvos Lorand University (ELTE), the Los Alamos National Laboratory, and the Gordon and Betty Moore Foundation.
Lasair is supported by the UKRI Science and Technology Facilities Council and is a collaboration between the University of Edinburgh (grant ST/N002512/1) and Queen’s University Belfast (grant ST/N002520/1) within the LSST:UK Science Consortium. This publication is partially based on observations obtained with the Samuel Oschin 48-inch Telescope at the Palomar Observatory as part of the Zwicky Transient Facility project. ZTF is supported by the National Science Foundation grant No. AST-1440341 and a collaboration including Caltech, IPAC, the Weizmann Institute for Science, the Oskar Klein Center at Stockholm University, the University of Maryland, the University of Washington, Deutsches Elektronen-Synchrotron and Humboldt University, Los Alamos National Laboratories, the TANGO Consortium of Taiwan, the University of Wisconsin at Milwaukee, and Lawrence Berkeley National Laboratories. Operations are conducted by COO, IPAC, and UW. This research has made use of “Aladin sky atlas” developed at CDS, Strasbourg Observatory, France.
This work made use of the NASA/IPAC Extragalactic Database (NED), which is operated by the Jet Propulsion Laboratory, California Institute of Technology, under contract with NASA. We also used NASA’s Astrophysics Data System.
References
- Banerjee et al. (2015) Banerjee, D. P. K., Nuth III, J. A., Misselt, K. A., et al. 2015, ApJ, 814, 109
- Barsukova et al. (2014) Barsukova, E. A., Goranskij, V. P., Valeev, A. F., Zharova, A. V. 2014, Astrophys. Bull., 69, 67
- Barsukova et al. (2017) Barsukova, E. A., Goranskij, V. P., Valeev, A. F. 2017, ASPC, 510, 401
- Bellm et al. (2019) Bellm, E. C., Kulkarni, S. R., Barlow, T., et al. 2019, PASP, 131, 018002
- Blagorodnova et al. (2017) Blagorodnova, N., Kotak, R., Polshaw, J., et al. 2017, ApJ, 834, 107
- Blagorodnova et al. (2020) Blagorodnova, N., Karambelkar, V., Adams, S. M., et al. 2020, MNRAS, 496, 5503
- Blanton & Roweis (2007) Blanton, M. R., Roweis, S. 2007, AJ, 133, 734
- Bond (2003) Bond, H. E., Henden, A., Levay, Z. G., et al. 2003, Nature, 422, 405
- Bond & Siegel (2006) Bond, H. E., Siegel, M. H. 2006, AJ, 131, 984
- Bond (2011) Bond, H. E. 2011, ApJ, 737, 17
- Bond (2018) Bond, H. E. 2018, RNAAS, 2, 163
- Boschi & Munari (2004) Boschi, F., Munari, U. 2004, A&A, 418, 869
- Bryan & Royer (1992) Bryan, J., Royer, R. E. 1992, PASP, 104, 179
- Cai et al. (2019) Cai, Y.-Z., Pastorello, A., Fraser, M., et al. 2019, A&A, 632, L6
- Cappellaro (2014) Cappellaro, E. 2014, SNOoPy: a package for SN photometry, http://sngroup.oapd.inaf.it/snoopy.html
- Chambers et al. (2019) Chambers, K. C., Magnier, E. A., Metcalfe, N., et al. 2019, ArXiv eprints (arXiv:1612.05560, version 4)
- Chronis & Gaskell (2008) Chronis, T. S., Gaskell, C. M. 2008, AJ, 135, 264
- Crause et al. (2003) Crause, L. A., Lawson, W. A., Kilkenny, D., et al. 2003, MNRAS, 341, 785
- Crause et al. (2005) Crause, L. A., Lawson, W. A., Menzies, J. W., Marang, F. 2005, MNRAS, 358, 1352
- Dolphin (2000) Dolphin A. E. 2000, PASP, 112, 1383
- Dong et al. (2015) Dong, S., Kochanek, C. S., Adams, S., Prieto, J.-L. 2015, Astron. Tel., 7173, 1
- Fluks et al. (1994) Flux, M. A., Plez, B., Thé, P. S., et al. 1994, A&AS, 105, 336
- Förster et al. (2020) Förster, F., et al. 2020, AAS submitted, ArXiv eprints (arXiv:2008.03303)
- Goranskij et al. (2002) Goranskij, V. P., Kusakin, A. V., Metlova, N. V., et al. 2002, Ast. Lett., 28, 691
- Goranskij et al. (2004) Goranskij, V. P., Shugarov, S. Yu., Barsukova, E. A., Kroll, P. 2004, IBVS, 5511, 1
- Goranskij & Barsukova (2007) Goranskij, V. P., Barsukova, E. A. 2007, Astron. Rep., 51, 126
- Goranskij et al. (2016) Goranskij, V. P., Barsukova, E. A., Spiridonova, O. I., et al. 2016, Astrophys. Bull., 71, 82
- Goranskij et al. (2020) Goranskij, V. P., Barsukova, E. A., Burenkov, A. N., et al. 2020, Astrophys. Bull., 75, 325
- Graham et al. (2019) Graham, M. J., Kulkarni, S. R., Beellm, E. C., et al. 2019, PASP, 131, 078001
- Jordi et al. (2006) Jordi, K., Greber, E. K., Ammon, K. 2006, A&A, 460, 339
- Ho (2019) Ho, A. 2019, TNSTR, 2743, 1
- Holmbo et al. (2019) Holmbo, S., Stritzinger, M., Nowack, G., et al. 2019, Astron. Tel., 12661, 1
- Howitt et al. (2020) Howitt, G., Stevenson, S., Vigna-Gómez, A., et al. 2020, MNRAS, 492, 3229
- Ivanova et al. (2013) Ivanova, N., Justham, S., Avendano Nandez, J. L., Lombardi, J. C. 2013, Science, 339, 433
- Kafka (2020) Kafka, S. 2020, Observations from the AAVSO International Database, https://www.aavso.org
- Kamiński et al. (2009) Kamiński, T., Schmidt, M., Tylenda, R., Konacki, M., Gromadzki, M. 2009, ApJS, 182, 33
- Kankare et al. (2015) Kankare, E., Kotak, R., Pastorello, A., et al. 2015, A&A, 581, L4
- Kashi & Soker (2016) Kashi, A., Soker, N. 2016, Res. Astron. Astrophys., 16, 99
- Kawabata (2020) Kawabata, M. 2020, TNSCR, 499, 1
- Kimeswenger et al. (2002) Kimeswengen, S. Lederle, C., Schmeja, S., Armsdorfer, B. 2002, MNRAS, 336, L43
- Kochanek et al. (2014) Kochanek, C. S., Adams, S. M., Belczynski, K. 2014, MNRAS, 443, 1319
- Kochanek et al. (2017) Kochanek, C. S., Shappee, B. J., Stanek, K. Z., et al. 2017, PASP, 129, 104502
- Kurtenkov et al. (2015) Kurtenkov, A., Pessev, P., Tomov, T., et al. 2015, A&A, 578, L10
- Lipunov et al. (2017) Lipunov, V. M., Blinnikov, S., Gorbovskoy, E., et al. 2017, MNRAS, 470, 2339
- MacLeod et al. (2017) MacLeod, M., Macias, P., Ramirez-Ruiz, E., et al. 2017, ApJ, 835, 282
- MacLeod et al. (2018) MacLeod, M., Ostriker, E. C., Stone, J. M. 2018, ApJ, 868, 136
- Magnier et al. (2020) Magnier, E. A., Schlafly, E. F., Finkbeiner, D. P., et al. 2020, ApJS, 251, 6
- Martini et al. (1999) Martini, P., Wagner, R. M., Tomaney, A., et al. 1999, AJ, 119, 1034
- Mason et al. (2010) Mason, E., Diaz, M., Williams, R. E., Preston, G., Bensby, T. 2010, A&A, 516, 108
- Mauerhan et al. (2015) Mauerhan, J. C., Van Dyk, S. D., Graham, M. L., et al. 2015, MNRAS, 447, 1922
- Mauerhan et al. (2018) Mauerhan, J. C., Van Dyk, S. D., Johansson, J., et al. 2018, MNRAS, 473, 3765
- Merrett et al. (2006) Merrett, H. R., Merrifield, M. R., Douglas, N. G., et al. 2006, MNRAS, 368, 120
- Mould et al. (1990) Mould, J., Cohen, J., Graham, J. R., et al. 1990, 353, L35
- Munari et al. (2002) Munari, U., Henden, A., Kiyota, S., et al. 2002, A&A, 389, L51
- Munari et al. (2007) Munari, U., Navasardyan, H., Villanova, S. 2007, ASPC, 363, 13
- Munari et al. (2020) Munari, U., Siviero, A., Dallaporta, S., Maitan, A. 2020, Astron. Tel, 13484, 1
- Pastorello & Fraser (2019) Pastorello, A., Fraser, M. 2019, Nat. Astron., 3, 636
- Pastorello et al. (2019a) Pastorello, A., Mason, E., Taubenberger, S., et al. 2019a, A&A, 630, A75
- Pastorello et al. (2019b) Pastorello, A., Chen, T.-W., Cai, Y.-Z., et al. 2019b, A&A, 625, L8
- Pastorello et al. (2020) Pastorello, A., Valerin, G., Fraser, M., et al. 2020, A&A, submitted, ArXiv eprints (arXiv:2011.10590)
- Paczynski (1976) Paczynski, B. 1976, in Eggleton P., Mitton S., Whelan J. eds, Proc. IAU Symp. 73, Structure and Evolution of Close Binary Systems . Kluwer, Dordrecht, p. 75
- Pejcha et al. (2016) Pejcha, O., Metzger, B. D., Tomida, K. 2016, MNRAS, 461, 2527
- Pejcha et al. (2017) Pejcha, O., Metzger, B. D., Tyles, J. G., Tomida, K. 2017, ApJ, 850, 59
- Piascik et al. (2014) Piascik, A. S., Steele, I. A., Bates, S. D., et al. 2014, Proc. SPIE, 9147, 8
- Pietsch (2010) Pietsch, W. 2010, Astron. Nachr., 331, 187
- Popov (1993) Popov, D. V. 1993, ApJ, 414, 712
- Rich et al. (1989) Rich, R. M., Mould, J., Picard, A., Frogel, J. A., Davies, R. 1989, ApJ, 341, L51
- Schlafly & Finkbeiner (2011) Schlafly, E. F., Finkbeiner, D. P. 2011, ApJ, 737, 103
- Shara et al. (2010) Shara, M. M., Zurek, D., Prialnik, D., Yaron, O., Kovetz, A. 2010, ApJ, 725, 824
- Shappee et al. (2014) Shappee, B. J., Prieto, J. L., Grupe, D., et al. 2014, ApJ, 788, 48
- Smith et al. (2002) Smith, J. A., Tucker, D. L., Kent, S., et al. 2002, AJ, 123, 2121
- Smith et al. (2016) Smith, N., Andrews, J. E., Van Dyk, S. D., et al. 2016, MNRAS, 458, 950
- Smith et al. (2019) Smith, K. W., Williams, R. D., Young, D. R., et al. 2019, Res. Astron. Astrophys., 3, 26
- Smith et al. (2020) Smith, K. W., Smartt, S. J.; Young, D. R., et al. 2020, PASP, 132, 085002
- Soker & Kashii (2016) Soker, N., Kashii, A. 2016, MNRAS, 462, 217
- Soker (2020) Soker, N. 2020, ApJ, 836, 20
- Soker & Kaplan (2020) Soker, N., Kaplan, N. 2020, Res. Astron. Astrophys., in press, ArXiv eprints (arXiv:2007.06472)
- Stritzinger et al. (2020) Stritzinger, M. D., Taddia, F., Fraser, M., et al. 2020, A&A, 639, A104
- Tomaney & Shafter (1992) Tomaney, A. B., Shafter, A. W. 1992, ApJS, 81, 683
- Tonry et al. (2018) Tonry, J. L., Denneau, L., Heinze, A. N., et al. 2018, PASP, 130, 064505
- Tully et al. (2013) Tully, R. B., Courtois, H. M., Dolphin, A. E., et al. 2013, AJ, 146, 86
- Tylenda et al. (2011) Tylenda, R., Hajduk, M., Kamiński, T., et al. 2011, AA, 528, 114
- Tylenda et al. (2013) Tylenda, R., Kamiński, T., Udalski, A., et al. 2013, AA, 555, 16
- Udalski (2003) Udalski, A. 2003, Acta Astron., 53, 291
- Valenti et al. (1998) Valenti, J. A., Piskunov, N., Johns-Krull, C. M. 1998, ApJ, 498, 851
- Williams et al. (2015) Williams, S. C., Darnley, M. J., Bode, M. F., Steele, I. A. 2015, ApJ, 805, L18
Appendix A Supplementary material
2]
| Date | MJD | Inst. | ||||||
|---|---|---|---|---|---|---|---|---|
| 2007-08-13 | 54325.61 | – | – | 20.32 | – | – | – | 1 |
| 2017-06-17 | 57921.14 | – | – | – | 22.38 | – | – | 2 |
| 2017-12-25 | 58122.24 | – | – | – | 21.84 | – | – | 3 |
| 2018-12-12 | 58464.23 | – | – | – | – | – | 21.92 | 3 |
| 2018-12-15 | 58467.32 | – | – | – | 20.97 | – | – | 3 |
| 2019-08-20 | 58715.57 | – | – | – | 20.57 | – | – | 3 |
| 2019-08-24 | 58719.54 | – | – | – | 21.39 | – | – | 3 |
| 2019-09-19 | 58745.59 | – | – | – | 22.254 (0.396) | – | – | 3 |
| 2019-10-13 | 58769.42 | – | – | – | 21.500 (0.429) | – | – | 3 |
| 2019-10-22 | 58778.44 | – | – | – | – | – | 21.847 (0.108) | 3 |
| 2019-11-05 | 58792.43 | – | – | – | 21.176 (0.100) | – | – | 3 |
| 2019-11-24 | 58811.15 | – | – | 20.24 | – | – | – | 4 |
| 2019-11-24 | 58811.19 | – | 19.79 | – | – | – | – | 4 |
| 2019-11-25 | 58812.24 | – | – | 20.82 | – | – | – | 4 |
| 2019-11-27 | 58814.11 | – | 18.66 | – | – | – | – | 4 |
| 2019-11-27 | 58814.15 | – | – | 19.93 | – | – | – | 4 |
| 2019-11-27 | 58814.19 | – | – | 19.91 | – | – | – | 4 |
| 2019-11-27 | 58814.30 | – | – | – | – | – | 21.066 (0.078) | 3 |
| 2019-11-29 | 58816.32 | – | 20.71 | – | – | – | – | 5 |
| 2019-11-30 | 58818.41 | – | – | – | – | – | 18.76 | 6 |
| 2019-12-02 | 58819.12 | – | – | 18.89 | – | – | – | 4 |
| 2019-12-02 | 58819.16 | – | – | 20.15 | – | – | – | 4 |
| 2019-12-02 | 58819.19 | – | 18.54 | – | – | – | – | 4 |
| 2019-12-03 | 58820.16 | – | 19.41 | – | – | – | – | 4 |
| 2019-12-03 | 58820.36 | – | – | – | – | – | 19.80 | 5 |
| 2019-12-05 | 58822.29 | – | – | – | – | – | 20.232 (0.519) | 6 |
| 2019-12-07 | 58824.33 | – | – | – | – | – | 19.854 (0.259) | 5 |
| 2019-12-09 | 58826.34 | – | – | – | – | – | 20.008 (0.501) | 6 |
| 2019-12-10 | 58827.40 | – | – | – | – | – | 18.81 | 5 |
| 2019-12-11 | 58828.12 | – | 19.10 | – | – | – | – | 4 |
| 2019-12-11 | 58828.19 | – | – | 18.64 | – | – | – | 4 |
| 2019-12-11 | 58828.34 | – | – | – | – | – | 19.41 | 6 |
| 2019-12-12 | 58829.31 | – | – | – | – | – | 20.130 (0.474) | 5 |
| 2019-12-13 | 58830.18 | – | 19.84 | – | – | – | – | 4 |
| 2019-12-13 | 58830.22 | – | – | – | 19.590 (0.117) | – | – | 3 |
| 2019-12-13 | 58830.28 | – | – | 20.02 | – | – | – | 4 |
| 2019-12-13 | 58830.29 | – | – | – | – | – | 20.298 (0.451) | 6 |
| 2019-12-14 | 58831.10 | – | – | 20.345 (0.243) | – | – | – | 4 |
| 2019-12-14 | 58831.12 | – | 19.41 | – | – | – | – | 4 |
| 2019-12-16 | 58833.36 | – | – | – | – | – | 20.178 (0.494) | 6 |
| 2019-12-17 | 58834.19 | – | – | 19.921 (0.192) | – | – | – | 7 |
| 2019-12-18 | 58835.14 | – | 19.08 | – | – | – | – | 4 |
| 2019-12-19 | 58836.35 | – | – | – | – | – | 19.964 (0.321) | 5 |
| 2019-12-20 | 58837.08 | – | – | 20.116 (0.169) | – | – | – | 4 |
| 2019-12-20 | 58837.14 | – | 20.55 | – | – | – | – | 4 |
| 2019-12-21 | 58838.14 | – | 19.52 | – | – | – | – | 4 |
| 2019-12-21 | 58838.27 | – | – | – | – | – | 20.335 (0.329) | 6 |
| 2019-12-29 | 58846.12 | – | – | 19.756 (0.114) | – | – | – | 4 |
| 2019-12-29 | 58846.26 | – | – | – | – | – | 19.471 (0.208) | 6 |
| 2020-01-01 | 58849.08 | – | – | 19.562 (0.135) | – | – | – | 4 |
| 2020-01-01 | 58849.09 | – | 20.084 (0.138) | – | – | – | – | 4 |
| 2020-01-01 | 58849.09 | – | 20.058 (0.178) | – | – | – | – | 4 |
| 2020-01-01 | 58849.15 | – | – | 19.547 (0.121) | – | – | – | 4 |
| 2020-01-02 | 58850.30 | – | – | – | – | – | 19.157 (0.192) | 6 |
| 2020-01-03 | 58851.13 | – | 19.13 | – | – | – | – | 4 |
| 2020-01-04 | 58852.11 | – | 19.693 (0.315) | – | – | – | – | 4 |
| 2020-01-04 | 58852.16 | – | – | 19.480 (0.116) | – | – | – | 4 |
| 2020-01-05 | 58853.08 | – | – | 19.01 | – | – | – | 4 |
| 2020-01-06 | 58854.14 | – | – | 19.312 (0.200) | – | – | – | 4 |
| 2020-01-06 | 58854.25 | – | – | – | – | – | 18.889 (0.079) | 6 |
| 2020-01-07 | 58855.16 | – | 19.758 (0.236) | – | – | – | – | 4 |
| 2020-01-07 | 58855.19 | – | – | 19.248 (0.166) | – | – | – | 4 |
| 2020-01-11 | 58859.10 | – | 19.674 (0.254) | – | – | – | – | 4 |
| 2020-01-11 | 58859.18 | – | – | 19.149 (0.159) | – | – | – | 4 |
| 2020-01-12 | 58860.18 | – | – | 18.921 (0.162) | – | – | – | 4 |
| 2020-01-14 | 58862.11 | – | 19.845 (0.124) | – | – | – | – | 4 |
| 2020-01-16 | 58864.11 | – | 19.701 (0.129) | – | – | – | – | 4 |
| 2020-01-22 | 58866.31 | – | – | – | – | – | 19.050 (0.087) | 6 |
| 2020-01-19 | 58867.14 | – | 19.25 | – | – | – | – | 4 |
| 2020-01-20 | 58868.27 | – | 19.665 (0.264) | – | – | – | – | 5 |
| 2020-01-22 | 58870.22 | – | – | – | – | – | 19.135 (0.195) | 6 |
| 2020-01-23 | 58871.09 | – | – | 19.356 (0.141) | – | – | – | 4 |
| 2020-01-23 | 58871.16 | – | 19.657 (0.198) | – | – | – | – | 4 |
| 2020-01-24 | 58872.23 | – | 19.636 (0.367) | – | – | – | – | 5 |
| 2020-01-26 | 58874.12 | – | – | 19.314 (0.083) | – | – | – | 4 |
| 2020-01-26 | 58874.26 | – | – | – | – | – | 19.158 (0.087) | 6 |
| 2020-01-28 | 58876.26 | – | – | – | – | – | 19.063 (0.194) | 5 |
| 2020-01-29 | 58877.12 | – | – | 19.133 (0.128) | – | – | – | 4 |
| 2020-01-29 | 58877.18 | – | 19.502 (0.141) | – | – | – | – | 4 |
| 2020-02-01 | 58880.15 | – | – | 18.954 (0.097) | – | – | – | 4 |
| 2020-02-03 | 58882.12 | – | 19.601 (0.166) | – | – | – | – | 4 |
| 2020-02-03 | 58882.24 | – | – | – | – | – | 18.736 (0.170) | 6 |
| 2020-02-05 | 58884.13 | – | – | 18.813 (0.187) | – | – | – | 4 |
| 2020-02-05 | 58884.28 | – | – | – | – | – | 18.842 (0.209) | 5 |
| 2020-02-06 | 58885.41 | – | – | 18.779 (0.400) | – | – | – | 1 |
| 2020-02-07 | 58886.38 | – | – | 18.755 (0.233) | – | – | – | 1 |
| 2020-02-08 | 58887.11 | – | – | 18.717 (0.091) | – | – | – | 4 |
| 2020-02-08 | 58887.18 | – | 19.183 (0.269) | – | – | – | – | 4 |
| 2020-02-08 | 58887.41 | – | – | 18.509 (0.416) | – | – | – | 1 |
| 2020-02-09 | 58888.41 | – | – | 18.210 (0.281) | – | – | – | 1 |
| 2020-02-11 | 58890.41 | – | – | 16.253 (0.052) | – | – | – | 1 |
| 2020-02-12 | 58891.11 | – | – | 15.437 (0.018) | – | – | – | 4 |
| 2020-02-12 | 58891.16 | – | 15.389 (0.026) | – | – | – | – | 4 |
| 2020-02-12 | 58891.39 | – | – | 15.110 (0.028) | – | – | – | 1 |
| 2020-02-12 | 58892.11 | – | 15.422 (0.081) | – | – | – | – | 8 |
| 2020-02-13 | 58892.41 | – | – | 15.062 (0.055) | – | – | – | 1 |
| 2020-02-13 | 58892.86 | – | – | 15.206 (0.012) | – | – | – | 2 |
| 2020-02-14 | 58893.41 | – | – | 15.654 (0.057) | – | – | – | 1 |
| 2020-02-14 | 58893.09 | – | 15.836 (0.122) | – | – | – | – | 8 |
| 2020-02-14 | 58893.14 | – | – | – | 15.621 (0.168) | – | – | 9 |
| 2020-02-14 | 58893.73 | – | – | 15.670 (0.060) | – | – | – | 9 |
| 2020-02-14 | 58893.75 | – | 15.954 (0.012) | 15.731 (0.012) | 15.767 (0.012) | – | – | 9 |
| 2020-02-14 | 58893.81 | 16.646 (0.021) | 15.953 (0.011) | 15.766 (0.016) | 15.817 (0.017) | 15.949 (0.022) | – | 10 |
| 2020-02-15 | 58894.13 | – | – | 16.128 (0.032) | – | – | – | 4 |
| 2020-02-15 | 58894.16 | – | 16.247 (0.034) | – | – | – | – | 4 |
| 2020-02-15 | 58894.74 | – | 16.568 (0.037) | 16.349 (0.059) | 16.289 (0.085) | – | – | 11 |
| 2020-02-15 | 58894.79 | 17.680 (0.025) | 16.578 (0.011) | 16.343 (0.015) | 16.291 (0.016) | 16.312 (0.014) | – | 10 |
| 2020-02-15 | 58894.88 | 17.726 (0.039) | – | 16.368 (0.010) | 16.294 (0.009) | – | – | 2 |
| 2020-02-16 | 58895.86 | 18.502 (0.049) | – | 16.496 (0.012) | 16.371 (0.010) | – | – | 2 |
| 2020-02-17 | 58896.83 | 18.724 (0.099) | 17.129 (0.015) | 16.522 (0.011) | 16.381 (0.010) | 16.361 (0.014) | – | 2 |
| 2020-02-17 | 58896.84 | 18.767 (0.045) | 17.136 (0.009) | 16.527 (0.009) | 16.389 (0.008) | 16.364 (0.014) | – | 12 |
| 2020-02-18 | 58897.42 | – | – | 16.538 (0.063) | – | – | – | 1 |
| 2020-02-18 | 58897.83 | – | – | 16.544 (0.020) | – | – | – | 10 |
| 2020-02-19 | 58898.42 | – | – | 16.563 (0.063) | – | – | – | 1 |
| 2020-02-20 | 58899.42 | – | – | 16.561 (0.067) | – | – | – | 1 |
| 2020-02-21 | 58900.16 | – | – | 16.571 (0.047) | – | – | – | 4 |
| 2020-02-21 | 58900.23 | – | 17.262 (0.096) | – | – | – | – | 5 |
| 2020-02-21 | 58900.42 | – | – | 16.566 (0.081) | – | – | – | 1 |
| 2020-02-21 | 58900.85 | – | – | 16.568 (0.021) | – | – | – | 12 |
| 2020-02-22 | 58901.42 | – | – | 16.579 (0.080) | – | – | – | 1 |
| 2020-02-23 | 58902.43 | – | – | 16.601 (0.067) | – | – | – | 1 |
| 2020-02-24 | 58903.42 | – | – | 16.646 (0.069) | – | – | – | 1 |
| 2020-02-25 | 58904.83 | 20.667 (0.467) | – | – | – | – | – | 12 |
| 2020-02-26 | 58905.12 | – | – | 16.538 (0.038) | – | – | – | 4 |
| 2020-02-26 | 58905.14 | – | 17.865 (0.095 | – | – | – | – | 4 |
| 2020-02-26 | 58905.46 | – | – | 16.738 (0.265) | – | – | – | 1 |
| 2020-02-27 | 58906.79 | – | – | 16.686 (0.019) | 16.282 (0.019) | 16.140 (0.026) | – | 10 |
| 2020-02-28 | 58907.74 | – | 18.259 (0.050) | 16.786 (0.021) | 16.306 (0.019) | 16.180 (0.027) | – | 10 |
| 2020-03-02 | 58910.43 | – | – | 16.977 (0.105) | – | – | – | 1 |
| 2020-03-03 | 58911.83 | – | 18.818 (0.117) | 17.030 (0.033) | 16.441 (0.022) | 16.202 (0.019) | – | 2 |
| 2020-03-05 | 58913.84 | – | – | 17.174 (0.066) | – | – | – | 12 |
| 2020-03-06 | 58914.44 | – | – | 17.265 (0.211) | – | – | – | 1 |
| 2020-03-07 | 58915.78 | – | 19.283 (0.205) | 17.384 (0.072) | 16.629 (0.038) | – | – | 11 |
| 2020-03-07 | 58915.83 | – | – | – | – | 16.277 (0.015) | – | 2 |
| 2020-03-08 | 58916.45 | – | – | 17.527 (0.242) | – | – | – | 1 |
| 2020-03-08 | 58916.76 | – | 19.408 (0.283) | 17.543 (0.036) | 16.729 (0.048) | – | – | 11 |
| 2020-03-11 | 58919.78 | – | 19.972 (0.373) | 17.985 (0.061) | 16.944 (0.033) | – | – | 11 |
| 2020-03-12 | 58920.85 | – | – | 18.198 (0.185) | – | – | – | 12 |
| 2020-03-16 | 58924.76 | – | – | – | 17.570 (0.273) | – | – | 11 |
| 2020-03-17 | 58925.84 | – | – | 19.046 (0.100) | – | 17.087 (0.050) | – | 13 |
| 2020-03-18 | 58926.77 | – | – | 19.329 (0.402) | 17.906 (0.570) | – | – | 11 |
| 2020-03-18 | 58926.77 | – | 21.14 | – | – | – | – | 11 |