New Spectral Analysis Results Within the Scope of Extended Matter Research in the AR Lacertae Active Binary System
Abstract
Within the scope of extended matter research, we present new spectral analysis results of an active binary system AR Lac. The low and high resolution spectra of this system were taken during the period 2013-2016. The evaluation of low dispersion spectra together with the B, V, Rc, Ic and WISE photometric data showed that AR Lac has an excess radiation in W2 band. In addition, the spectral energy distribution and the minima depth ratios of the light curves of this active binary system were studied to examine the flux contributions of the components of the system depending on wavelengths and on orbital phase. Furthermore, high resolution spectral analysis showed evidence of prominence-like structures and a possible extended matter around the cooler component of AR Lac binary system.
……
Stars: activity \addkeyword(Stars:) binaries: eclipsing \addkeywordStars: chromospheres \addkeyword(Stars:) circumstellar matter \addkeywordStars: individual: AR Lac
0.1 Introduction
AR Lac (HD 210334, Vmax = 6.09, P = 1.98 days) is one of the bright and totally eclipsing binary system of chromospherically active binaries (CABs). This RS CVn type binary system has components of spectral type G2 IV + K0 IV. Lu et al. (2012) summarized the previous studies that had been presented by numerous investigators, including photometric and spectroscopic observations of AR Lac. This active binary system is well known to have orbital period change, magnetic and spot activity which are affecting the cooler component together with strong emission features in Ca II H and K lines (see Lu et al., 2012). A long-term secular period decrease was estimated at a rate of by Lu et al. (2012), which may be caused by the magnetic activity of this active binary system. Based on this result, they also gave an estimation on the mass-loss rate for this binary system as .
The spectral H and Ca II H and K emission lines are very important indicators of chromospheric or magnetic activity of the component(s) of CABs (see Rodono, 1980). Thus, the activity level of a star can also be inferred by determining the presence of spectral H emission line or by determination of H with a core which was filled-in some absorption features (see Fernandez-Figueroa et al., 1994; Barden, 1985; Fekel et al., 1986; Bopp et al., 1988; Strassmeier et al., 1990).
In the studies of some CABs, it was found that there were some evidences which indicate that the extended/circumstellar matter in that binary system may exist (see Scaltriti et al., 1993). In these studies the measurements of the excess radiation, especially in the spectral region of long wavelengths of active binary systems, were used with the respect to excess radiation, may be caused by mass loss due to stellar winds, and which may related to extended/circumstellar matter.
Assessments of some important observational data of disk structure around chromospherically active binary stars began with the infrared astronomical satellite (IRAS) in 1983. IRAS was the first mission to put a telescope in space to survey the All Sky Survey at 12, 25, 60, and 100 micron bands (Scaltriti et al., 1993). Based on IRAS observations, Busso et al. (1988) found that IR excess is definitely present in CF Tuc, while the spectral distributions of the And, UX Ari and AR Lac can be accounted for IR excess by combinations of normal stellar components. They also concluded that the excess is not correlated with the activity level nor with the evolutionary status but may be correlated with the mass loss phenomena near the Main Sequence. Possible interpretation of the excess emission based on the evolutionary status of the binary components are also discussed by Busso et al. (1990). They discuss possible explanations in terms of mass loss phenomena(triggered by the binary nature) during the evolution of the sources near the Main Sequence. The behaviour of excess Ca ii H and K and H emission in a sample of 73 (CABs), including AR Lac, was examined by Montes et al. (1996), and they found that there was a good correlation between excess Ca ii K and H chromospheric emission fluxes.
In the H line study of the system Frasca et al. (2000) found that there are chromospheric emissions from both components in most spectra and the rotational modulation of H line emission is not obvious. They gave an interpretation on the excess absorption observed in 1997 during and near the primary minima as a comment for the effect of a prominence like structure anchored between the leading and trailing hemisphere of the cool component. This interpretation was fully compatible with the radial velocities of H peaks in extracted spectra. Zboril et al. (2004) reported that the central depth of H profiles of AR Lac at eclipses (at 0.041P and 0.043P) were deeper than synthetic profiles and close to the profiles of stars with the same spectral types(e.g. Eri).
Lanza et al. (1998) gave a detailed analysis of the long-term and seasonal light curves of AR Lac. Based on their main results concerning the magnetic activity of AR Lac binary system, they concluded that the large active region around the substellar point on the secondary showed itself not only at photospheric levels but also in the chromosphere and corona, with an extended structure which might well be an interconnecting loop between the two stars.
The results of Very Large Array (VLA) observations during optical eclipses in 1977 of AR Lac were reported by Owen & Spangler (1977). They found a small increase in radio flux density during 0.5P, although the radio source had variation on time scales a few hours, but they did not detect a strong eclipse-like feature that occurs near 0.0P or 0.5P orbital phases. Together with their spectral evaluations by taking into account the synchrotron self-absorption, they suggested that the radiation is likely to be produced in a volume much larger than the stars in the system due to the lack of clearly defined eclipse in the AR Lac binary system.
Simultaneous observations of AR Lac at radio and ultraviolet wavelengths during two consecutive secondary eclipses, made in 1979 May, were reported by Brown et al. (1979). During one of the eclipses they saw a quiescent radio source without an evidence of an eclipse at radio wavelengths. On the second one, they found the radio source was brighter by a factor of 3 together with an evident radio eclipse. And, in the latter case, the radio source was circularly polarized by 5-10% during eclipse. They also gave the following with the same statements as follows:
-
-
the sense of circular polarization change abruptly at first contact, and
-
-
the radio eclipse was twice as deep in one sense of circular polarization as it was in the other.
They also identified the following features from their simultaneous ultraviolet observations: The ultraviolet coronal lines also showed the eclipse. But, the eclipse on the day in which the radio source was quiescent became much more prominent than the eclipse on the day in which the radio source was active. In other words, the effect of eclipse on coronal ultraviolet lines increases while the radio source is in quiescent state, but while the radio source is in an active state the effect of eclipse decreases and the eclipse becomes more uncertain. Thus, this result is evident that coronal activity in the radio region increases the brightness and this increase will not only be caused by stellar activity because the brightness effect of the radiation in ultraviolet region has not been seen at the same time.
| Stellar | Type | Date | HJD | Start time | Exposure time | Airmass | Orbital | Number |
|---|---|---|---|---|---|---|---|---|
| Object | of obs. | of obs.(UT) | (sec.) | (mag.) | phase | of images | ||
| Vega | Standard | Oct. 12, 2015 | 2457308.278 | 18:40:02 | 0.8 | 1.316 | - | 5 |
| AR Lac | Variable | Oct. 12, 2015 | 2457308.428 | 22:11:28 | 30 | 1.295 | 0.995 | 10 |
| HR 5510 | Reference | June 04, 2016 | 2457544.282 | 18:42:21 | 5 | 1.033 | - | 5 |
| Vega | Standard | June 04, 2016 | 2457544.351 | 20:21:48 | 5 | 1.286 | - | 5 |
| Vega | Standard | June 05, 2016 | 2457545.404 | 21:39:36 | 0.03 | 1.089 | - | 10 |
| AR Lac | Variable | June 05, 2016 | 2457545.422 | 22:08:49 | 20 | 1.739 | 0.496 | 10 |
| HR 8634 | Standard | Sept. 05, 2016 | 2457637.322 | 19:35:20 | 2 | 1.271 | - | 10 |
| AR Lac | Variable | Sept. 05, 2016 | 2457637.438 | 22:25:47 | 7 | 1.048 | 0.894 | 10 |
9 Start time Exposure Airmass G2 IV K0 IV HJD Date of obs. of obs. time (mag.) Phase\tabnotemarka Contribution Contribution S/N (UT) (sec.) rate rate 2456487.407 13.07.2013 21:29:29 1800 1.242 0.012 0.00 1.00 41 2456487.437 13.07.2013 22:04:36 2700 1.157 0.026 0.08 0.92 54 2456487.475 13.07.2013 22:59:53 2700 1.069 0.046 0.25 0.75 84 2456487.509 13.07.2013 23:48:50 2700 1.027 0.063 0.34 0.66 83 2456487.542 14.07.2013 00:36:32 2700 1.012 0.080 0.36 0.64 92 2456487.576 14.07.2013 01:24:42 2700 1.023 0.097 0.36 0.64 94 2456488.401 14.07.2013 21:12:38 2700 1.279 0.513 0.46 0.54 90 2456488.434 14.07.2013 22:00:09 2700 1.158 0.529 0.45 0.55 90 2456488.467 14.07.2013 23:01:02 2700 1.040 0.546 0.44 0.56 94 2456488.501 14.07.2013 23:36:17 2700 1.032 0.563 0.37 0.63 70 2456488.534 15.07.2013 00:23:47 2700 1.013 0.579 0.36 0.64 94 2456488.567 15.07.2013 01:11:18 2700 1.019 0.596 0.36 0.64 80 \tabnotetextaOrbital phases are computed by using the light elements taken from TIDAK (TIming DAtabase in Krakow) http://www.as.up.krakow.pl/ephem/old-ephem/EPHEM-2012xi.TXT.
By using the Einstein Imaging Proportional Counter (IPC) observations of the X-ray eclipse together with the cotemporal International Ultraviolet Explorer (IUE) and radio observations, Walter et al. (1983) found an extended corona with a scale of about 1R∗ to be associated with the K0 IV component of AR Lac binary system. They have obtained X-ray, radio, and ultraviolet observations of the system over one orbital cycle. The primary minimum of the X-ray light curve they obtained for AR Lac was deep and the secondary minimum was broad and shallow. They found that quiescent corona of the G2 IV component is small and asymmetric which extends to some 0.02R∗ above the photosphere to be related with stellar spots. On the other hand, the K0 IV component was found to have two coronal components: 1- An outer, extended coronal component which is presumably a hotter component that extends to 1R∗ above the photosphere and exhibits a bright hemisphere, 2- An inner coronal component which is small relative to the stellar radius.
Using their VLA observations at 1.5 and 4.9 GHz frequencies on 13 and 15 October 1982, Doiron & Mutel (1984) have not detected a clear eclipse signature in the light curve of AR Lac. On both observing days, a significant circular polarization of 2%-8% was observed with a helicity reversal between 1.5 and 4.9 GHz, and they attributed this result to a gyro-synchrotron mechanism.
Using the IUE LWR and SWP spectra of AR Lac, obtained on 3-5 October 1983, and their VLA observation on 4-5 October 1983 at 2, 6, and 20 cm, Walter et al. (1987) determined the atmospheric structure within the plage regions together with the properties of the extended coronal component around K0 IV star. They identified three discrete regions of emissions in the outer atmosphere of the K0 IV star in which there are two ”plages” and a chromospheric brightening that was related to a radio flare.
Based on their results of the multifrequency VLA and Very Long Baseline Array (VLBA) observations, made in 1997, Trigilio et al. (2001) inferred the conclusions as follows:
-
”-
the spectral and spatial information of the corona of AR Lac indicate a structured morphology, which can be modeled with a core-halo source;
-
-
the physical parameters, as derived from the fit of the observed spectra with the core-halo model, are consistent with the hypothesis of a co-spatial X-ray and radio source;
-
-
the observed radio emission cannot be attributed to the same thermal electron population responsible for the observed X-ray emission.”
Koch (2007) detected a variable polarization in the AR Lac. He reported that the seat of the polarization could provisionally be located in the assorted active clouds that populate the outer envelope of K0 IV component. Also, he reported that the plasma must be low in metals compared to the Sun and not have a simple polarization spectrum. In this regard, he also gave the following explanation: ”Since Z is about 0.6Z⊙, there is a possibility that the metal depletion is only apparent and not real because the grain condensation in the cool envelope and that grains alone are the seats of the polarization.”
Recently, a research on the extended/circumstellar matter in CABs has been presented by Karakuş & Ekmekçi (2020). Based on their photometric CCD data of 13 CABs, including AR Lac and together with the 2MASS and WISE data, they found that the AR Lac had some fluctuations in colour excess (CE) values at around primary minimum. And, they also found that the system showed some characteristic variations in CE values towards longer wavelengths, at both around secondary minimum and outside eclipse but with lower and some detectable CE values in all bands at outside eclipses. They concluded that the main source of excess radiation in the AR Lac is stellar activity. This stellar activity is expected to contribute to the formation of an extended/circumstellar matter in the AR Lac, but a significant evidence on how much it contributes could not be presented by Karakuş & Ekmekçi (2020), based solely on their results of photometric CE measurements.
7
| Star | HJD | Date of obs. | Start time of obs.(UT) | Exposure time (sn) | Airmass (mag.) | S/N |
|---|---|---|---|---|---|---|
| HR 6256 | 2456488.287 | 14.07.2013 | 18:36:28 | 1800 | 1.016 | 89 |
| HR 6256 | 2456488.310 | 14.07.2013 | 19:08:57 | 1800 | 1.007 | 61 |
| HD 195405 | 2456487.333 | 13.07.2013 | 19:39:31 | 2000 | 1.280 | 30 |
| HD 195405 | 2456487.366 | 13.07.2013 | 20:18:08 | 3000 | 1.174 | 31 |
In this study, the spectra of AR Lac taken during the observing period 2013-2016 at different orbital phases by using the Coudé Echelle and TFOSC (Faint Object Spectrograph and Camera) instruments were analysed to investigate and to reveal the relationship between its stellar activity and a possible extended/circumstellar matter of the system. In addition, together with the results of this spectral analysis of the AR Lac system, an evaluation was made by including the results given by Karakuş & Ekmekçi (2020) based on their photometric CCD, 2MASS and WISE data taken during minima and outside eclipses. Within the scope of this evaluation, the B, V, Rc, Ic, and W1, W2, W3, W4 of WISE band light curves of AR Lac were also taken into consideration.
0.2 Observations and Data Reductions
Spectral observations of AR Lac were carried out at times to cover the external and internal contact parts of the light curve of the system in the eclipses together with descending and ascending parts. The choice of these observation times corresponding to these orbital phases was made to see the relationship of the system’s activity events with the characteristics of the component stars on the disc edges and a possible extended/circumstellar matter. For this purpose, both low and high resolution spectral data were used to investigate the presence of a possible extended/circumstellar matter together with the properties and evolutionary states of components of AR Lac.
For all low and high resolution spectra of this study, Image Reduction and Analysis Facility (IRAF)111http://iraf.noao.edu was used to reduce the combined data with standard procedures, including the corrections for flat and bias, and determination of aperture, wavelength calibration, velocity correction, and interstellar extinction/cosmic radiation. But, the atmospheric and interstellar extinction effects have only been corrected for low resolution spectra. The standard stars selected and observed within the conditions of observability for flux calibration are as follows: Vega (HR 7001, A0 V, V = 0.03) and HR 8634 (B8 V, V = 3.41). Standard flux values for the stars are taken from the website ”https://snfactory.lbl.gov/snf/spstds/” and the references therein. In addition, the TFOSC spectra of the HR 5510 (M1 III, V = 6.28) reference star were taken to see and evaluate the effect of Telluric line absorptions on the spectra of the AR Lac binary system. For H profile analysis, the high resolution spectra of two reference stars which are of the same spectral type of both components of the AR Lac binary system, were also taken. These two stars are: HD 195405 (G2 IV) and HR 6256 (K0 IV).
In addition, photometric data, from Karakuş & Ekmekçi (2020), of AR Lac in Johnson-Cousins BVRcIc and medium WISE bands were used to make a comparison with our spectroscopic results. In all these bands, the photometric light curves of the AR Lac were also constructed and evaluated by using the photometric colour excess measurements of Karakuş & Ekmekçi (2020). Some details about these photometric observational data are presented below in Section 0.2.3.
0.2.1 Low Dispersion Spectra
The optical low resolution spectral observations of AR Lac, a reference star(HR5510) and two standard stars(Vega and HR 8634) took place during the observing period 2015-2016, by using the TUG (TÜBİTAK National Observatory) Faint Object Spectrograph and Camera (TFOSC) mounted on the 1.5 m Russian Turkish Telescope RTT150222Specifications of RTT150 and TFSOC are available at www.tug.tubitak.gov.tr in Antalya, Turkey. The log of TFOSC observations are given in Table 1. Grism 15 was used with a 100 micron slit. The wavelength range in this configuration is , and the resolving power (R)749. Ar, Ne, He and Halogen lamp spectra taken in the same night with the star were used for wavelength calibration and flat-fielding. A total of 65 slit spectra were obtained: 30 of spectra were taken for AR Lac, and the rest were spectra of other standard stars (see Table 1).

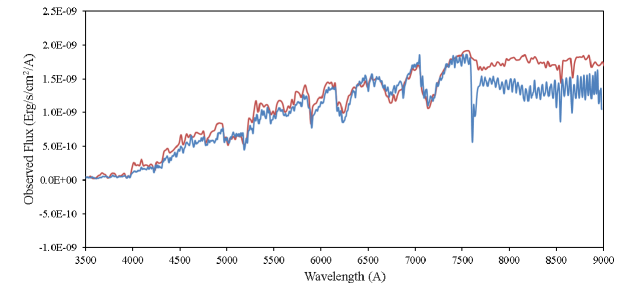
As can be seen from Figure 1, the low resolution TFOSC spectra have the effect of Telluric lines caused by water vapor, oxygen and carbon dioxide molecules in the Earth’s atmosphere in the spectral range , on the continuum level. This effect is larger in cold stars, especially in the photometric "Ic" band spectral region than in hotter stars.
In order to compare the obtained TFOSC spectra with a synthetic spectrum, the synthetic spectra were constructed by using the appropriate temperature, surface acceleration and metal abundance values, taken from website ”http://svo2.cab.intacsic.es/theory/newov2/index.php”. Theoretical spectra were obtained by using the ATLAS9 Kurucz ODFNEW/NOVER (Castelli et al., 1997) data in model with zero metal abundance. In constructing a model spectrum of AR Lac binary system, by using the ATLAS9 Kurucz ODFNEW/NOVER model atmosphere, the related parameters were taken as:
For the G0 IV component; , , and ,
For the K0 IV component; , , and .
The flux contributions from both components of AR Lac binary system were computed by using the physical parameters (masses; , radii; , Planck functions; , fractional projected area depending on orbital phase; , orbital inclination; i) as done by Şenavcı et al. (2018) for SV Cam.
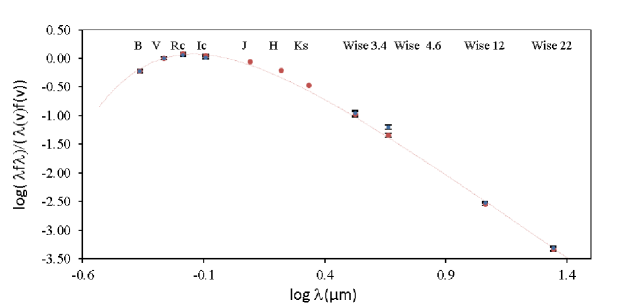
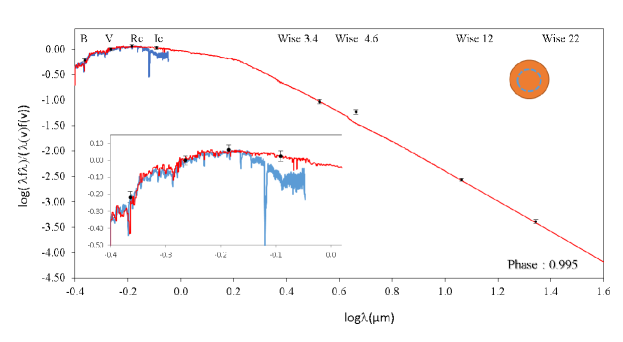
In Figure 2, the spectral energy distribution (SED) modeled for 0.0P orbital phase of AR Lac (i.e. the stellar configuration in which the hotter component of the system is totally eclipsed by cooler component) was compared with SED modeled for HD 56168, reference star, of the same spectral type with the cooler component of AR Lac. In this Figure 2, the SED of a Black Body radiation with the temperature of the same temperature of the cooler component of AR Lac (K0 IV, 5100 K) was also included. As shown in Figure 2, the flux values of SED obtained from photometric CCD data are well compatible with the spectral model results. However, this compatibility appears to be seen in the B, V, Rc bands for TFOSC spectral data, while there is a significant decrease in the continuum level of TFOSC spectrum due to Telluric line absorption effect in the Ic band spectral range (see Figure 3).
7
| Parameters | Primary Component | Secondary Component | Reference | |
|---|---|---|---|---|
| Spectral Type | G2IV | K0IV | Frasca et al. (2000) | |
| H Amplitude of Radial | ||||
| Velocity Curve (kms-1) | Frasca et al. (2000) | |||
| M() | Siviero et al. (2006) | |||
| R() | Siviero et al. (2006) | |||
| (cms-2) | Siviero et al. (2006) | |||
| T (K) | Siviero et al. (2006) | |||
| v sin i (kms-1) | 46 | 73 | Frasca et al. (2001) | |
| Orbit Inclination Angle | ||||
| i (degree) | 90 | Siviero et al. (2006) | ||
| Orbital eccentricity | ||||
| (e) | 0 | Siviero et al. (2006) | ||
| Space Velocity of the | ||||
| System’s Center of Mass | ||||
| (kms-1) | Frasca et al. (2000) |
0.2.2 High Dispersion Spectra
In order to determine the activity level of a star depending on spectral H profile, the photospheric effect must be removed from the H line profile. In the case of binary system, the flux contributions to photospheric H absorption from both components were also taken into consideration in this method of determination of the activity level. This method, which eliminates the photospheric absorption effect from H line profile, is called ”Spectral Extraction Method”. In this study, we tried to analyse the behaviour of H excess emission in chromospherically active binary system AR Lac, by using this Spectral Extraction Method. For this purpose, high resolution spectra of AR Lac, at different orbital phases, in the wavelength range of with resolution power were taken on July 13-14, 2013 by using Coude Echelle Spectrograph equipped with RTT150 telescope of TUG. The log of high resolution spectral observations are given in Tables 2 and 3.
5
| Phase | G2 IV | K0 IV | ||
|---|---|---|---|---|
| Type | RV (kms-1) | Type | RV (kms-1) | |
| 0.013 | - | - | Emission | -28.8 |
| 0.028 | Emission | -47.5 | Emission | -4.6 |
| 0.048 | Emission | -66.7 | Emission | -7.3 |
| 0.065 | Emission | -81.3 | Absorption | -16.9 |
| 0.081 | Emission | -95.5 | Absorption | -47.5 |
| 0.098 | Emission | -116.9 | Absorption | -59.8 |
| 0.514 | Emission | -26.0 | - | - |
| 0.565 | Emission | 23.8 | Emission | -93.2 |
| 0.581 | Emission | 38.4 | Emission | -100.0 |
| 0.598 | Emission | 47.5 | Emission | -109.6 |
6
| Band | (Å) | Bandwidth (Å) | Depth of Min. I (Err) | Depth of Min. II (Err) | / (Err) |
|---|---|---|---|---|---|
| B | 4326 | 1816 | 0.491 (0.013) | 0.281 (0.014) | 1.751 (0.057) |
| V | 5445 | 1129 | 0.429 (0.011) | 0.275 (0.012) | 1.562 (0.051) |
| Rc | 6529 | 1877 | 0.433 (0.012) | 0.311 (0.013) | 1.395 (0.050) |
| Ic | 8104 | 1604 | 0.399 (0.011) | 0.287 (0.011) | 1.388 (0.046) |
| W1 | 33526 | 6625.6 | 0.347 (0.033) | 0.291 (0.046) | 1.195 (0.184) |
| W2 | 46028 | 10423 | 0.335 (0.032) | 0.409 (0.023) | 0.821 (0.109) |
| W3 | 115608 | 55069 | 0.318 (0.008) | 0.276 (0.007) | 1.151 (0.036) |
| W4 | 220883 | 41013 | 0.356 (0.013) | 0.255 (0.011) | 1.399 (0.059) |
The chromospheric contribution to H line profile has been determined using the spectral subtraction technique. This technique was applied to high resolution spectra of AR Lac binary system with the following steps:
-
i)
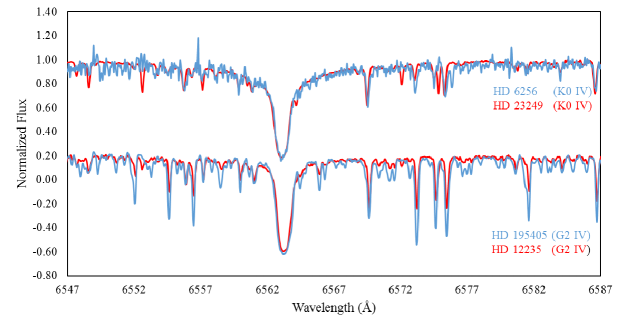
The high resolution spectra of reference stars (HD 195405 and HR 6256) taken at TUG were compared with the high resolution ELODIE spectra333obtained from http://atlas.obs-hp.fr/elodie/index.html of HD 12235 (G2 V) and HD 23249 (K0 IV) stars (which were selected from the catalogue of Montes et al., 1997). This comparison showed that the H profiles of TUG and ELODIE spectra were compatible (see Figure 4).
-
ii)
From the catalogue of Montes et al. (1997), the rotational equatorial velocities were obtained as ¡ 15 kms-1 and 2 kms-1 for HD 12235 (G2 IV) and HD 23249 (K0 IV), respectively. Based on our compatible results, in accordance with their spectral type, we attributed these velocities to our reference stars (HD 195405 and HR 6256).
-
iii)
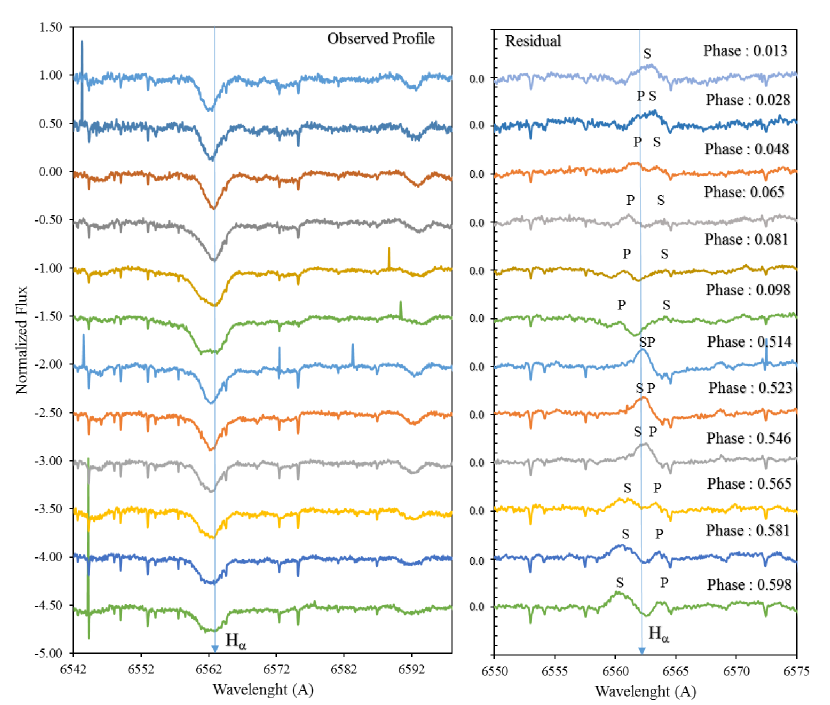
Rotational velocities for the components of AR Lac binary system(G2 IV + K0 IV), were found by Frasca et al. (2001) as 46 kms-1 and 73 kms-1, respectively (see Table 4). Depending on the orbital phase, the observed H line profiles of double-lined spectroscopic and active binary system, AR Lac, are shown in the left panel of Figure 6. Taking into account the rotational velocities of Frasca et al. (2001), given above, the following rotational velocities were applied to the observed spectra of reference stars in modelling the synthetic spectrum of AR Lac binary system by using STARMOD program (see Barden, 1985; Montes et al., 2000):
, for HD 195405 (G2 IV)
, for HR 6256 (K0 IV)
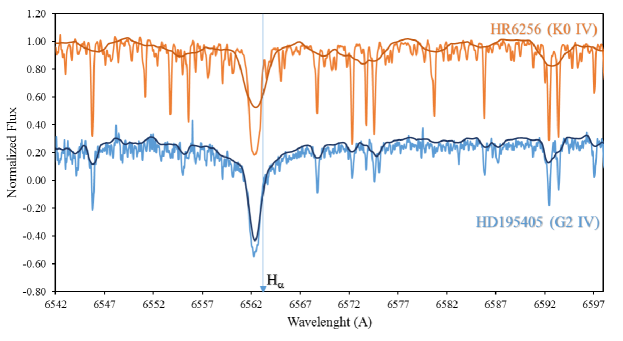
The input parameters for the STARMOD program were derived by using the parameters of the AR Lac as given in Table 4. The obtained synthetic spectra are shown in Figures 5 and 6 for reference stars and AR Lac, respectively.
Since most of the high resolution spectra were taken during minima times within the scope of this study, H profiles of the components of AR Lac binary system were too close to each other (see Figure 7). Therefore, the H profiles of the components could not be separated from each other. In addition, the number of spectral H profiles of the components that can be distinguished is very few, so the equivalent width measurements for these H profiles were not made.
0.2.3 Photometric CCD and Infrared Observations
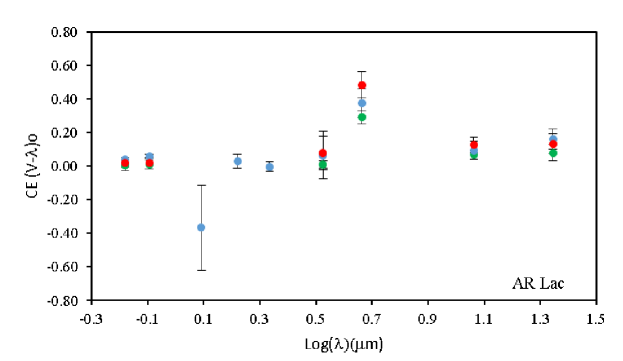
In order to evaluate the spectral results, within the scope of extended matter research, of this study together with the results of photometric CCD and Infrared observations, we constructed the B, V, Rc, Ic, W1, W2, W3 and W4 (WISE)444http://irsa.ipac.caltech.edu/Missions/wise.html (see Wright et al., 2010) band light curves and some characteristics of AR Lac active binary system based on related observational data of Karakuş & Ekmekçi (2020). These BVRcIc observational data were obtained during the period 2012-2013, while WISE data were obtained in 2010. Light curves obtained in normalized luminosity for each band are shown in Figures 9 and 10. And, the results of colour excess (CE) measurements for different photometric bands are also shown in Figure 11.
By taking the advantage of geometric configuration of the components of an active and total eclipsing binary system, the presence of an excess radiation of active component can easily be detected during the primary minimum at which the occultation of hotter component by cooler and active one (e.g. Hall & Ramsey, 1994; Karakuş & Ekmekçi, 2020). This configuration during primary minimum of a total eclipsing and active binary system could also give an advantage to search for the interaction between the activity/spots phenomena and the extended/circumstellar matter which may exist in the system. Therefore, it is important and useful to examine the structural changes of photospheric/chromospheric spectral line profiles and to reveal the structure in spectral energy distribution (SED), during primary minimum. In this context, active and eclipsing binaries are important in extended/circumstellar matter’s studies.
As can be seen from Figures 9 and 10, in the light curves of AR Lac, the depths of primary and secondary minima vary depending on colour (i.e the photometric band). Using the correlation below for the ratio of the minima depth of a light curve (see Kopal & Demircan, 1978), in the case of , we can estimate the flux ratio of the component stars as:
| (1) |
Using all these light curves, the results of flux ratios are given in Table 6.
As can be seen from these observational results, the observed flux ratios decrease gradually by about 10% towards the longer wavelength (W1), and in the infrared wavelengths of WISE the flux of components are approximately equal except W3 and W4 bands (see Table 6). This decrease in flux ratios towards the longer wavelengths and the equality of fluxes in W1 and W2 bands suggest that possible extended/circumstellar matter may exist in the AR Lac active binary system.
0.3 Results
The flux values of SED obtained from photometric CCD data are well compatible with the spectral model results of AR Lac binary system (see Figure 2). From a comparative analysis of the data in Figure 2, it was found that during primary minimum of AR Lac, there was an excess radiation of in the W2 band compared to the HD 56168 reference star. It is clear that this excess radiation at primary minimum can be attributed to the cooler component (K0 IV) of AR Lac binary system.
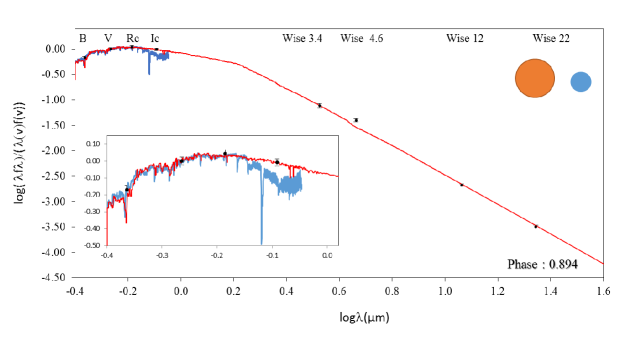
As can be seen from Table 1, the low resolution TFOSC spectra of AR Lac were obtained on Oct. 12, 2015 and June 5, 2016 (at times corresponding to minima times), and on Sept. 5, 2016 at times corresponding to outside eclipses. The times which correspond to minima and outside eclipses are determined within the scope of this study. The analysis results of our TFOSC observations were found as given in Figure 3, along with the synthetic spectrum comparison. In addition, visual and infrared photometric results were added to the evaluation of these low resolution spectral results in Figure 3.
From the patterns given in Figure 3, it is seen that the results of low resolution spectra of AR Lac, taken in both minima and outside eclipse phases, are compatible with the results of synthetic spectra. In addition, photometric flux measurements are also observed to be compatible except for the W2 band (, ). The photometric flux measurements in W2 band clearly show that there is an excess radiation in this band in the AR Lac. Excess radiation rates in have been found as follows:
At 0.995P the excess radiation rate is about ,
At 0.496P the excess radiation rate is about ,
At 0.894P the excess radiation rate is about .
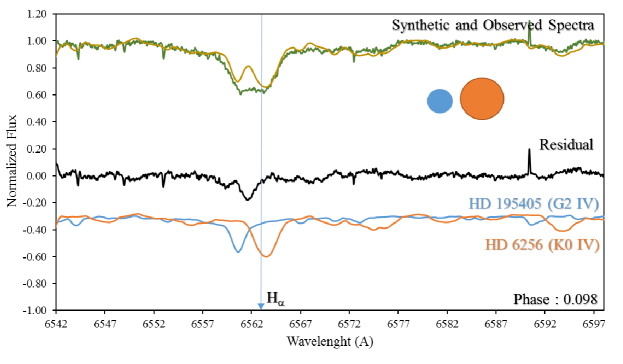
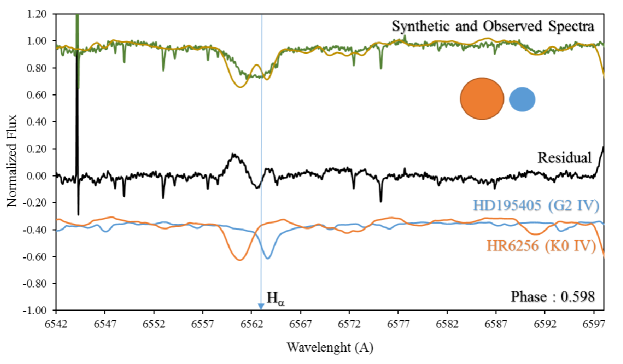
Based on the model spectral solutions of high resolution H line profiles (see Figure 6) of the system, the variation of H and their residual profiles depending on orbital phases were obtained as given in Figure 7.
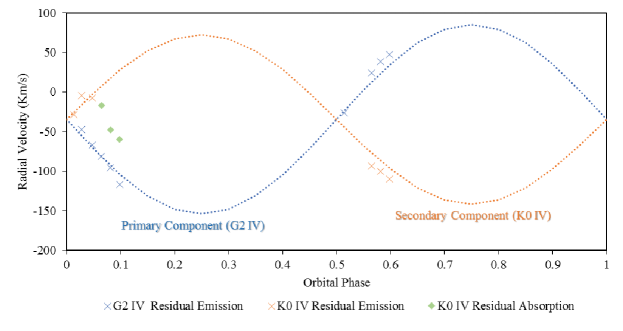
Using our synthetic model spectrum solutions, the radial velocities obtained from residual H profiles of AR Lac are given in Table 5. These radial velocity measurements were also compared with the radial velocity curve by Frasca et al. (2000), as given in Figure 8. The discussion of these results is given in the following Section 0.4.
From our analysis of the minimum depth ratios of the light curves of AR Lac (see Table 6 and Figures 9 and 10), obtained in this study, it was seen that the flux values of the components of this active binary system were going to be equal, towards the longer wavelengths. These results are also discussed in Section 0.4 in the context of existence of an extended/circumstellar matter in the system.
0.4 Discussion and Conclusions
Although recently, an observational evidence of the presence of extended /circumstellar matter has not been found, except in W2 band, by Karakuş & Ekmekçi (2020) in the AR Lac active binary system based on their IR excess measurement results, this issue has been re-evaluated with the results of the spectral analyses of this study. Our spectral analysis results of the low and high resolution spectra of AR Lac were evaluated within the scope of extended/circumstellar matter researched together with our previous photometric results. A discussion on these results can be summarized as follows:
-
i)
During the 0.0P orbital phase of the AR Lac binary system, the hotter component (G2 IV) is totally eclipsed and therefore only the radiation from the cooler component (K0 IV) of the system can be observed. In Figure 2, the SED (Spectral Energy Distributon) measurement results during 0.0P orbital phase of the AR Lac and the results of the HD 56168 (=; as a reference and inactive star) were compared with SED of a black body radiation of an effective temperature of 5100 K. From this comparison, it was seen that the AR Lac has an excess radiation in the W2 band. We were unable to compare our SED measurement results with those of Busso et al. (1988) for AR Lac due to their evaluations did not depend on orbital phase and the components of AR Lac were taken into consideration as G5 V+G8 IV (see their Table 5b and Figure 4). However, roughly, our SED results for outside eclipse phases (see the bottom pattern of Figure 3 of this study) appear to be consistent with their results.
-
ii)
In addition to our SED evaluations made at the primary minimum for AR Lac binary system in Figure 2, our SED results, together with our TFOSC spectral data, in the secondary minimum and outside eclipse phases were obtained as given in Figure 3. From all patterns given in Figure 3, it clearly appears that AR Lac has a significant excess radiation in the W2 band at all orbital phases. The relative value of this excess radiation in the W2 band was at highest level at primary minimum and at the lowest level at around outside eclipse phases, with an average value of . This result is also compatible with the results of photometric colour excess (CE) measurements obtained by Karakuş & Ekmekçi (2020) for the AR Lac (see Figure 11). Therefore, these characteristics of excess radiation depending on orbital phase show that the source of excess radiation in the AR Lac is mainly due to the cooler component (K0 IV) of the system. Using the Spitzer Space Telescope data, obtained during the observing period November 2005-January 2007, Matranga et al. (2010) reported that there was no significant warm dust in the AR Lac binary system, but it was found they gave photometric IR measurements that were partially compatible with our findings. Unfortunately, our survey of data sources found no information about which element or molecule is emitting/absorbing a radiation in the region 4.6 microns, and related atomic terms.
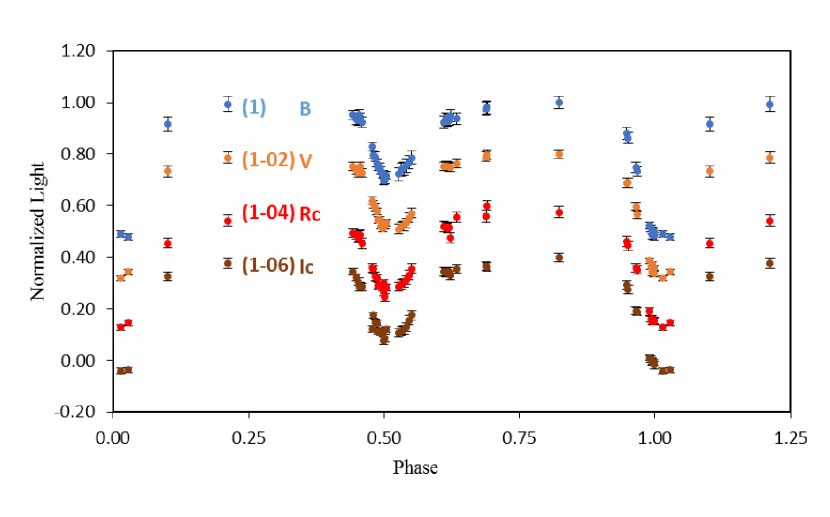
Figure 9: Normalized Light curves of AR Lac in B, V, Rc, Ic bands. 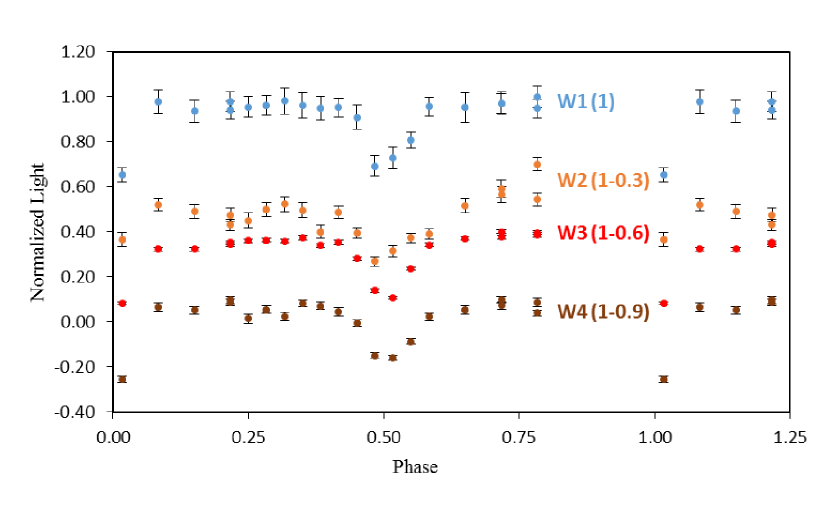
Figure 10: Normalized Light curves of AR Lac in WISE bands. -
iii)
Within the scope of this study, the high resolution H profile observations of AR Lac were made especially at/near minima times. The Spectral Extraction Method was used in modelling spectral H profiles. The residual H profiles of AR Lac binary system have been obtained in the form of emission and absorption profiles which are compatible with radial velocities of the components of the system (see Figures 6 and 7). These residual H profiles are clearly seen as emissions for both components, especially at 0.013P, 0.028P, 0.514P, 0.546P, 0.565P, and 0.581P orbital phases. However, the central depths of H absorption profiles of AR Lac at 0.048P, 0.065P, 0.081P, and 0.098P orbital phases were less deeper than of the depths of synthetic profiles (see Figure 6). The absorption feature in the residual H profiles of AR Lac could be seen at these orbital phases. This excess absorption structure in the residual H profiles of AR Lac observed at/near primary minimum phases is compatible with the finding results of Zboril et al. (2004) and Frasca et al. (2000). These residual H profiles (see Figure 7) provide information about the level and the variation of stellar activity in the AR Lac binary system. In addition, the residual H profiles of the cooler component of AR Lac binary system appear to be wider and intensive than the profiles of the hotter component. That is, from these residual H profiles, given in Figure 7, we see that the stellar activity in AR Lac binary system comes mainly from the secondary/cooler component and this cooler component rotates faster than primary/hotter component. These are the characteristics related to the expected results of chromospheric active stars.
-
iv)
Using synthetic spectra constructed for high resolution Coude Echelle spectra of AR Lac binary system, the radial velocity measurements of the component stars were made from the residual H profiles. All these radial velocity measurement results are shown in Figure 8 together with the radial velocity curves drawn based on the radial velocity measurement results obtained by Frasca et al. (2000) for the AR Lac binary system. As can be seen from Figure 8, the differences between these radial velocities (RVs) and the photospheric RVs give us observational evidence about the RVs which correspond to active regions in the chromosphere, which are at higher layers of the stellar atmosphere. Frasca et al. (2000), based on their study on H spectroscopy of AR Lac, had reported an extra absorption during primary eclipse (at 0.99P) which extends in blue side producing an asymmetric emission of the cool star with a center position shifted to red by 68 kms-1 (i.e. equal to the v sin i of the K0 IV component). A similar result of this extra absorption was determined by using the residual H absorption structure with the RVs of about -47.5 kms-1 and -59.8 kms-1, at 0.081P and 0.098P, respectively (see Table 5 and green squares in Figure 8). It seems that this extra absorption is most likely due to the prominence on the K0 IV component of AR Lac binary system. In summary, based on this observational evidence, it appears that a prominence-like extended/circumstellar matter most likely exist around the cooler component of AR Lac active binary system. Therefore, it can be suggested that such a low-density extended/circumstellar matter causes a colour excess or a residual emission/absorption in the AR Lac binary system.
-
v)
Our evaluations on the flux ratios of the component stars of AR Lac from the minima depth ratios of the light curves of the system (see Table 6 and Figures 9 and 10), show that the fluxes of the component stars are to be equal or almost equal to each other in W1, W2, and W3 band light curves. As can be seen from Table 6, the flux ratio or the component of AR Lac in W2 band is smaller than 1. This is because the depth of primary minimum(Min. I) of the light curve is less than of secondary minimum (Min. II), that is, when the hotter component(G2 IV) is behind the cooler component(K0 IV). In other words,in W2 band the system is brighter during primary minimum than in its secondary minimum phases. On the other hand, it was found that W2 band is additionally sensitive to hot dust(see Cluver et al., 2014). Therefore, the fact that the W2 flux ratio for the components of AR Lac binary system is smaller than 1, suggests that the extended/circumstellar matter around K0 IV component could likely be heated by the hotter component during the orbital phase 0.0P. In addition, the equality in fluxes, for the remaining bands, could be the result of an extended/circumstellar matter/material that can be detected in the wavelengths of these bands in the AR Lac. The colour excess(CE) measurement results in these bands by Karakuş & Ekmekçi (2020) also support this suggestion: CE values in these bands were obtained as and (see Figure 11).
The results of radio and polarization observations of AR Lac binary system, published in the period 1977-2007 (see Owen & Spangler, 1977; Brown et al., 1979; Walter et al., 1983; Doiron & Mutel, 1984; Walter et al., 1987; Trigilio et al., 2001; Koch, 2007), are in agreement with the results of this study. Based on all these spectroscopic and photometric findings obtained in this study, it can be concluded that in the AR Lac, there are not only evidences/contributions of excess radiation caused by stellar activity, but also caused by the presence of an extended/circumstellar matter. In other words, the results obtained in this study, together with the radio and polarization observation results of AR Lac binary system, were evaluated as follows: We made an investigation to find an evidence as to whether the effect of the extended/circumstellar matter(thought to exists) or the extended corona of the K0 IV component of the system contributes more to emergence of these observational findings.
It can be clearly seen that these results are in agreement with the conclusion of this study that an extended/circumstellar matter could, most likely, exist in the AR Lac active binary system.
However, it should also be noted that although the mass-loss rate obtained by using the long-term secular period decreasing due to stellar magnetic activity of AR Lac binary system is very small (see Lu et al., 2012), we see that the stellar activity of this binary system is sufficient to affect the coronal structure (see Walter et al., 1983) and the minima depth ratios of the light curves (see Table 6, Figures 9 and 10; which suggest the presence of common envelope such as Lyr or W UMa type binary systems) and the residual H emissions (see Figure 7) gave some important observational evidences for extended/circumstellar matter. Therefore, it is useful to have some more sensitive observational studies and continue these researches.
We thank to TÜBİTAK National Observatory for a partial support in using RTT150 telescopes with project numbers 13ARTT150-406 (Coudé) and 14BRTT150-664 (TFOSC). We would like to thank Prof. Dr. İlbeyi Ağabeyoğlu for checking out English text. And finally, we would like to thank the referee for his/her directions on some points to improve the comments of some results of this study. This research has made use of the Simbad Database operated at CDS, Starsbourg, France and of NASA’s Astrophysics Data System Bibliographic Services. This work has also made use of data from European Space Agency (ESA) mission Gaia(https://www.cosmos.esa.int/gaia), produced by the Gaia Data Processing and Analysis Consortium (DPAC, https://www.cosmos.esa.int/web/).
References
- Barden (1985) Barden, S. C. 1985, ApJ, 295, 162
- Bopp et al. (1988) Bopp, B.W., Dempsey, R.C., & Maniak, S. 1988, ApJS, 68, 803
- Brown et al. (1979) Brown, R.L., Broderic, J.J., & Neff, S.G. 1979, in BAAS, vol. 11, p. 630
- Busso et al. (1988) Busso, M., Scaltriti, F., Persi, P., Ferrari-Toniolo, M., & Origlia, L. 1988, MNRAS, 234, 445
- Busso et al. (1990) Busso, M., Scaltriti, F., Ferrari-Toniolo, M., Origlia, L., Persi, P., Robberto, M., Silvestro, G.& 1990, Mem. Soc. Astron. Italiana, 61, 77
- Castelli et al. (1997) Castelli, F., Gratton, R.G., & Kurucz, R.L. 1997, A&A, 318, 841
- Cluver et al. (2014) Cluver, M.E., et al. 2014, ApJ, 782, 90
- Doiron & Mutel (1984) Doiron, D.J., & Mutel, R.L. 1984, AJ, 89, 430
- Fekel et al. (1986) Fekel, F.C., Moffett, T.J., & Henry, G.W. 1986, ApJS, 60, 551
- Fernandez-Figueroa et al. (1994) Fernandez-Figueroa, M.J., Montes, D., de Castro, E., & Cornide, M. 1994, ApJS, 90, 433
- Frasca et al. (2000) Frasca, A., Marino, G., Catalano, S., & Marilli, E. 2000, A&A, 358, 1007
- Frasca et al. (2001) Frasca, A., Catalano, S., Marilli, E., & Marino, G. 2001, Long Term H Spectroscopy of AR Lac (CD-ROM Directory: contribs/frasca2) p. 943
- Hall & Ramsey (1994) Hall, J.C., & Ramsey, L.W. 1994, AJ, 107, 1149
- Karakuş & Ekmekçi (2020) Karakuş, O., & Ekmekçi, F. 2020, PASA, 37, e011
- Koch (2007) Koch, R.H. 2007, The Observatory, 127, 22
- Kopal & Demircan (1978) Kopal, Z., & Demircan, O. 1978, Ap&SS, 55, 241
- Lanza et al. (1998) Lanza, A.F., Catalano, S., Cutispoto, G., Pagano, I., & Rodono, M. 1998, A&A, 332, 541
- Lu et al. (2012) Lu, Y., Xiang F.-Y., & Shi, X.-M. 2012, PASJ, 64, 84
- Matranga et al. (2010) Matranga, M., Drake, J.J., Kashyap, V.L., Marengo, M., & Kuchner, M.J. 2010, ApJ, 720, L164
- Montes et al. (1996) Montes, D., Fernandez-Figueroa, M.J., Cornide, M., & de Castro, E. 1996, A&A, 312, 221
- Montes et al. (1997) Montes, D., Martin, E.L., Fernandez-Figueroa, M.J., Cornide, M., & de Castro, E. 1997, A&AS, 123, 473
- Montes et al. (2000) Montes, D., Fernandez-Figueroa, M.J., de Castro, E., Cornide, M., Latorre, A., & Sanz-Forcada, J. 2000, A&AS, 146, 103
- Owen & Spangler (1977) Owen, F.N., & Spangler, S.A. 1977, ApJ, 217, L41
- Rodono (1980) Rodono, M. 1980, Mem. Soc. Astron. Italiana, 51, 623
- Scaltriti et al. (1993) Scaltriti, F., et al. 1993, MNRAS, 264, 5
- Siviero et al. (2006) Siviero, A., Dallaporta, S., & Munari, U. 2006, Baltic Astronomy, 15, 387
- Strassmeier et al. (1990) Strassmeier, K.G., Fekel, F.C., Bopp, B.W., Dempsey, R.C., & Henry, G.W. 1990, ApJS, 72, 191
- Şenavcı et al. (2018) Şenavcı, H.V., et al. 2018, MNRAS, 479, 875
- Trigilio et al. (2001) Trigilio, C., et al. 2001, A&A, 373, 181
- Walter et al. (1983) Walter, F.M., Gibson, D.M., & Basri, G.S. 1983, ApJ, 267, 665
- Walter et al. (1987) Walter, F.M., et al. 1987, A&A, 186, 241
- Wright et al. (2010) Wright, E.L., et al. 2010, AJ, 140, 1868
- Zboril et al. (2004) Zboril, M., Armado, P.J., Oliveira, J.M. & Moreno, C. 2004, In Spectroscopically and Spatially Resolving the Components of the Close Binary Stars, Astronomical Society of the Pacific Conference Series, eds. R. W. Hilditch, H. Hensberge, & K. Pavlovski , vol. 318, pp 382-384