Raman Study of Cooper Pairing Instabilities in (Li1-xFex)OHFeSe
Abstract
We studied the electronic Raman spectra of (Li1-xFex)OHFeSe as a function of light polarization and temperature. In the spectra alone we observe the redistribution of spectral weight expected for a superconductor and two well-resolved peaks below . The nearly resolution-limited peak at 110 cm-1 (13.6 meV) is identified as a collective mode. The peak at 190 cm-1 (23.6 meV) is presumably another collective mode since the line is symmetric and its energy is significantly below the gap energy observed by single-particle spectroscopies. Given the experimental band structure of (Li1-xFex)OHFeSe, the most plausible explanations include conventional spin-fluctuation pairing between the electron bands and the incipient hole band and pairing between the hybridized electron bands. The absence of gap features in and symmetry favors the second case. Thus, in spite of various differences between the pnictides and chalcogenides, this Letter demonstrates the proximity of pairing states and the importance of band structure effects in the Fe-based compounds.
The mechanism of Cooper pairing in Fe-based superconductors (FeSCs) or the copper-oxygen compounds is among the most vexing problems in condensed matter physics. The at least partial understanding of these unconventional superconductors would pave the way toward new materials. In either case superconductivity occurs close to magnetic order Paglione and Greene (2010). Consequently, spin fluctuations are among the candidates for supporting electron pairing Mazin et al. (2008); Scalapino (2012). Alternatively, charge Onari and Kontani (2009) or orbital fluctuations Kontani and Onari (2010) between the Fe orbitals, spin-orbit coupling Borisenko et al. (2016) and/or nematic fluctuations Lederer et al. (2015) may support Cooper pairing. In all cases the Fermi surface topology strongly influences the pairing tendencies and qualitative differences between the pnictides and chalcogenides may be expected and were scrutinized in doped BaFe2As2 (122) and FeSe-based (11) compounds.
Intercalated FeSe superconductors show values higher than 40 K (refs. Lu et al. (2015); Burrard-Lucas et al. (2013)) but a Fermi surface topology different from the pnictides. In (Li1-xFex)OHFeSe, as shown in Fig. 1 (a2), the holelike Fermi surface encircling the point in 122 compounds and bulk FeSe cannot be resolved in angle-resolved photoemission spectroscopy (ARPES) any further Zhao et al. (2016) while it is still present in density functional theoryNekrasov and Sadovskii (2015) marking one of the similarities between intercalated and monolayer FeSe Zhao et al. (2016); Shi et al. (2017). This similarity triggers the question as to the pairing interactions and the directly related gap structure. Neither the recent ARPES nor the tunneling experiments yielded clear answers here but show only that there are essentially two rather different gap energies Du et al. (2016, 2018); Chen et al. (2019) on the presumably hybridized concentric electronlike Fermi surfaces Zhao et al. (2016).
Here electronic Raman scattering can contribute useful information Devereaux and Hackl (2007); Scalapino and Devereaux (2009); Maiti et al. (2016); Kretzschmar et al. (2013); Böhm et al. (2014). In addition to the gap formation and the pair-breaking peaks at approximately twice the gap energy Abrikosov and Fal’kovskii (1961); Klein and Dierker (1984), collective excitations appear in the Raman response which are related to details of the pairing potential . Collective excitations in superconductors were first discussed by Bardasis and Schrieffer (BS) Bardasis and Schrieffer (1961) and by Leggett Leggett (1966). The BS mode stems from a subleading pairing interaction that is orthogonal to the ground state. The Leggett mode is best thought of as interband Josephson-like number-phase fluctuation, the absolute energy of which corresponds to the relative coupling strength between the bands in comparison to the intraband coupling Klein (2010); Blumberg et al. (2007). Thus, the careful study of putative collective modes offers an opportunity to clarify the competing superconducting instabilities and the related pairing glue.
In this Letter, we present polarization-dependent Raman spectra for temperatures between 7.2 K and 48 K in high-quality single-crystalline (Li1-xFex)OHFeSe thin films with K. At 7.2 K we observe two well-defined features at 110 and 190 cm-1 in but not in and symmetry. We conclude that at least the resolution-limited line at 110 cm-1 is a collective mode being either related to a subleading pairing interaction or a number-phase oscillation between the electron bands. The superconducting ground state in (Li1-xFex)OHFeSe may result from either spin fluctuations between the electron bands and the incipient hole band or the interaction between the hybridized electron bands.
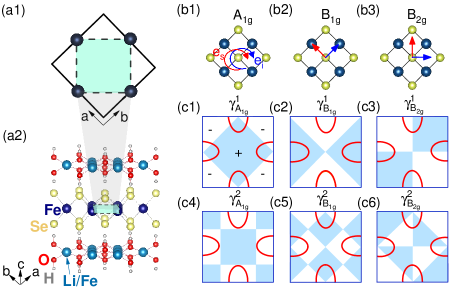
(Li1-xFex)OHFeSe () thin films were grown epitaxially on -oriented LaAlO3 substrates as reported previously Huang et al. (2017a, b). The thin films have a typical thickness of 100 nm and were characterized by x-ray diffraction and magnetization measurements showing a high crystallinity and a superconducting transition at K (see Supplemental Material A). The Raman experiments were carried out with a standard light scattering equipment Devereaux and Hackl (2007). For excitation we used a solid-state and an Ar+ laser emitting at 577 and 457 nm, respectively. All spectra were measured with an absorbed laser power of mW limiting the heating in the spot to below 1.5 K/mW (see Supplemental Material B). The polarizations of the incoming and scattered photons will be defined with respect to the 1 Fe unit cell as shown in Figs. 1(b1)- 1(b3), which are more appropriate for electronic excitations. We show Raman susceptibilities , where is an experimental constant, is the dynamical structure factor that is proportional to the rate of scattered photons, and is the Bose-Einstein distribution function. The first- and second-order crystal harmonics of each symmetry which Raman vertices are proportional to and the position of the Fermi pockets of (Li1-xFex)OHFeSe are shown in Figs. 1(c1)- 1(c6) to illustrate the relation between electronic Raman response in different symmetries and the Fermi surface topology.
Figure 2 shows the polarization-dependent Raman response of (Li1-xFex)OHFeSe above (red) and below (blue) . The peaks observed at approximately 167 cm-1 in symmetry [Fig. 2 (e)] and 205 cm-1 in symmetry [Fig. 2 (c)] correspond to Se in-phase and Fe out-of-phase vibrations along the axis, respectively Zhang et al. (2019). The peak at 165 cm-1 in the spectra [Fig. 2 (a)] can be identified as a leakage from the phonon. The small line width and high intensity of the phonon lines underpin the excellent crystalline quality of the sample. Because of surface contamination, broad peaks at 240 cm-1 [Fig. 2 (a)], 224 and 256 cm-1 [Fig. 2 (c)], and 252 cm-1 [Fig. 2 (e)] in , and symmetry, respectively, appear in the spectra. These peaks probably originate from Fe oxide phonons since they disappear after cleaving and are discussed in more detail in Supplemental Material C.
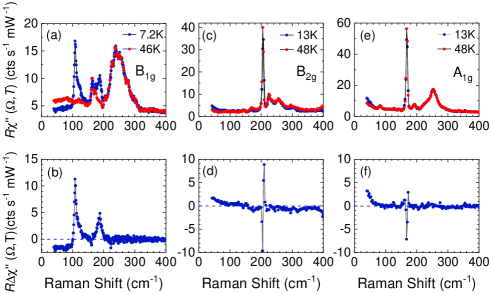
If the normal state spectra are subtracted from the superconducting spectra all phonons and extra lines disappear since they do not change appreciably upon crossing as shown in Figs. 2 (b), 2(d), and 2(f). However, due to the high spectral resolution even small changes of the phonon lines can be identified.
The small changes in the phonon lines are the only detectable effects of superconductivity in and symmetry. The increase toward zero energy is an artifact resulting from insufficient rejection of the laser line. The spectral changes in symmetry are resolved clearly since the extra peaks at approximately 110 cm-1 and 190 cm-1 have an intensity comparable to that of the phonons. In addition to the peaks, the continuum is suppressed below 90 cm-1 and is nearly energy independent. None of the excitations display appreciable resonance behavior, and the data can be reproduced in different regions of the sample, as shown in Supplemental Material D and E. The suppression and the additional peaks indicate a relation to superconductivity.
The most important observations include the following:
(i) There is no intensity redistribution below in and symmetry, as observed earlierKretzschmar et al. (2013); Muschler et al. (2009). The phenomenon can be understood qualitatively in terms of the related polarization-dependent Raman form factors, the Fermi surface topology of (Li1-xFex)OHFeSe as shown in Figs. 1(c1) and 1(c3), and screening effects.
(ii) The spectrum is suppressed below 90 cm-1. This indicates a nearly isotropic superconducting gap as already observed for Kretzschmar et al. (2013). The residual intensity of approximately 2-3 counts(s mW)-1 is not entirely clear but may either originate from the substrate, surface layers, or luminescence. In agreement with the scanning tunneling spectroscopy (STS) results Du et al. (2016), there is no reason to assume that there are states inside the gap. Similar residual Raman intensities are also observed in single crystals of pnictides and other chalcogenides Kretzschmar et al. (2013); Böhm et al. (2014); Jost et al. (2018) and can safely be assumed to be extrinsic.
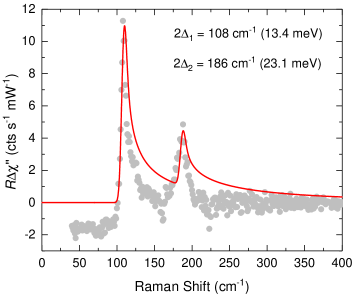
(iii) There are two superconductivity-induced features separated by some 80 cm-1. Gap features at a similar separation but slightly higher energies were observed by STS and ARPES as summarized in Table 1. The significant differences in the derived gap energies presumably have a real physical reason such as a substantial energy difference between the gap and collective modes Böhm et al. (2018). The line at 190 cm-1 is nearly symmetric and 10-12 wide while that at 110 cm-1 is rather sharp around the maximum but asymmetric.
(iv) The peak at 110 is nearly resolution-limited. For its width, it cannot result from pair breaking alone. Rather the symmetric line at 110 cm-1 having a FWHM of less than 5 cm-1 is a collective mode while the shoulder on the high-energy side originates from pair breaking. We will explore this possibility later by a phenomenological analysis.
| Raman (cm-1) | Raman (meV) | STS (meV) Du et al. (2016); Chen et al. (2019) | ARPES (meV) Zhao et al. (2016) | ||
|---|---|---|---|---|---|
| 1100.5 | 13.750.06 | 17.22.0 | – | ||
| 1900.5 | 23.750.06 | 28.44.0 | 26.04.0 | ||
| 3.800.02 | 4.750.55 | – | |||
| 6.560.02 | 7.841.10 | 7.181.10 | |||
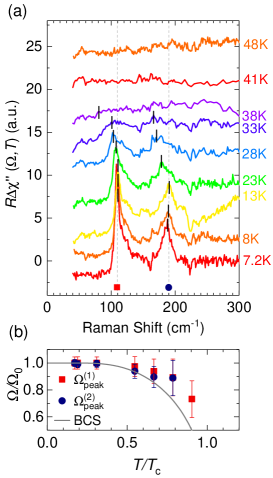
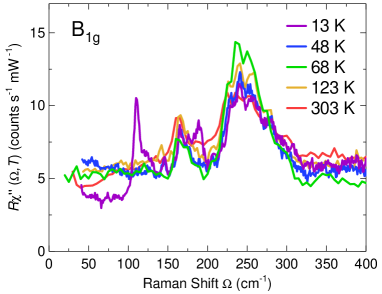
In Fig. 3, we show the variation with temperature of the difference spectra. With increasing temperature, the two peaks shift to lower energy and cannot be resolved any further above 38 K. Both peaks depend more weakly on temperature than expected from the BCS theory. As opposed to the results in Ba1-xKxFe2As2 Böhm et al. (2014) this temperature dependence does not allow us to clearly identify the origin of the superconducting structures. Whereas the pair-breaking peaks do not necessarily follow the BCS prediction, except in weakly interacting systems Devereaux and Einzel (1995), at least BS collective modes are expected to follow the related single-particle gap Monien and Zawadowski (1990). The temperature dependence of Leggett modes has not been analyzed yet, but is presumably more complicated since the coupling of at least two gaps has to be considered Suhl et al. (1959); Khodas and Chubukov (2012). Thus, the variation with temperature is not an identification criterion.
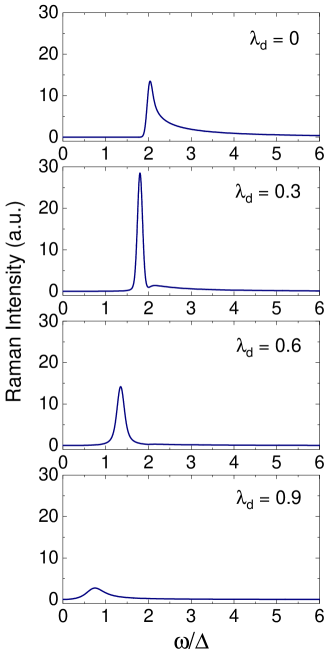
What are the possible explanations and the implications thereof for superconductivity in (Li1-xFex)OHFeSe? Given the STS and ARPES results a scenario with two isotropic -wave gaps appears to be natural and compatible with the Raman spectra. However, the gap energies observed by Raman scattering are significantly too small (Table 1), and the phenomenology returns poor agreement with the data (see Supplemental Material G) . Rather, the shape of the line at 110 cm-1 is strongly indicative of a collective mode. An undamped quadrupolar excitation inside the gap Thorsmølle et al. (2016) or a nematic resonance Gallais et al. (2016); Kang and Fernandes (2016) are not very likely since the related fluctuations above could not be observed (see Supplemental Material F). The distinction between a BS and a Leggett mode is less obvious. Since the mode is apparently below the edge of the smaller gap, the damping is small in either case.
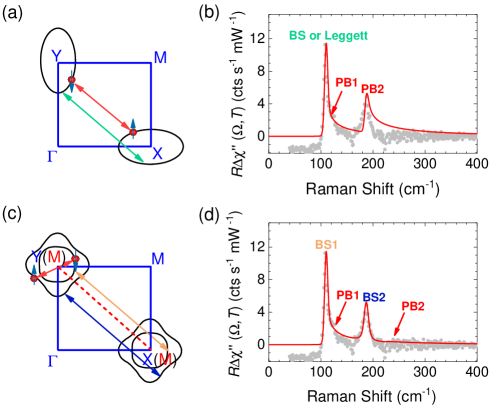
A BS mode indicates orthogonal pairing channels Bardasis and Schrieffer (1961). Given the possible interactions between the two electron bands at the and points, as shown in Fig. 4 (a), only a gap of lowest (first) order is possible if spin fluctuations are relevant. In this case the gaps on the two bands have opposite sign and, since there are no nodes on the Fermi surface, the gap is clean in agreement with the STS and Raman results. Then the BS mode would result from a interaction of second or higher order [for second-order symmetry, cf. Fig. 1(c5)], having a smaller coupling strength than the ground state. The description of the asymmetric maximum at 110 cm-1 is reasonable, as shown in Fig. 4 (b), and yields a coupling strength of approximately 0.16 for the subleading channel (see Supplemental Material G).
This interpretation favors pair breaking as a possible explanation for the high-energy peak at 190 cm-1. However, the symmetric shape is untypical for a pair-breaking feature and may only be explained by a broader gap distribution as suggested by the STS data for instance (see Table 1). Yet, the energy of 190 cm-1 (23.6 meV) is significantly below the single-particle gap. More importantly, it is difficult to explain why there should be two rather distinct gaps for this scenario of equivalent bands. It is, in fact, more likely that there is a reconstruction of the Fermi surface and a hybridization between the electron bands, as suggested by Khodas et al. Khodas and Chubukov (2012); Khodas et al. (2014). Then one expects two concentric Fermi surfaces with distinctly different gaps as seen here in the Raman data and also in the STS dataDu et al. (2016); Chen et al. (2019). ARPES Zhao et al. (2016) and STS Du et al. (2016) tell us that the outer Fermi surface has the larger gap. Superconductivity would then arise from the comparably strong interaction between these hybridized bands, inducing a repulsion of the gap energies Du et al. (2018) and either a collective Leggett mode in the channel Cea and Benfatto (2016) or a double-peak structure well below the gap for certain parameter ranges in the case of a sign change of the gap between the bands ( gap) Khodas et al. (2014).
Since only the channel displays a distinct redistribution of spectral weight below , scenarios which include other channels are less likely to explain the results. Thus, in addition to the strongly coupled ground state resulting from the interaction between the concentric bands there must be a weaker interaction leading to collective modes in symmetry, as shown in Fig. 4(c). In this scenario, the sharp mode is either a Leggett mode from a weak coupling between and on top of the strongly coupled ground state resulting from the strong coupling of the concentric bands or a BS mode having a similar origin. Huang et al. Huang et al. (2018) indeed argue that the distinction between Leggett and BS modes becomes obsolete here.
The only remaining issue concerns the positions of the Raman peaks that appear at smaller energies than in the single-particle spectroscopies. Whereas the energy of the Raman maximum at 110 cm-1 is naturally explained in terms of a BS mode appearing below the related single-particle gap at 136 (17 meV) and manifesting itself as a shoulder in the Raman spectrum, the position of the mode at 190 cm-1 is less obvious since there is no additional pair-breaking feature in the spectra. In principle it could be another BS mode pulled down by 10% from the gap edge at approximately 220 (27 meV) and suppressing the pair breaking almost entirely. Also in this case the ground state would be induced by a strong hybridization of the two electron bands. The resulting description of the experimental data is in fact much better in this case [see Fig. 4 (d)].
Finally, since the hole band is rather close to the Fermi surface, spin-fluctuation pairing between the incipient hole band and the electron bands can still be rather strong Linscheid et al. (2016); Mishra et al. (2016). Then the ground state is with all the electron bands having the same sign, and the modes are collective -wave modes from the hybridized electron bands. Whether or not the magnitudes of the gaps observed on the electron bands and the related subleading pairing strengths are compatible with these considerations needs to be worked out theoretically. The resulting spectra could be very similar to those in the previous case. However, due to the pairing-induced renormalization of the central hole band below one would not expect the spectra to be entirely insensitive to superconductivity. Thus the scenario of an incipient band is less supported by the present experiment.
In conclusion, we studied the polarization- and temperature-dependent Raman spectra in (Li1-xFex)OHFeSe. Superconductivity affects only the spectra. One of the observed modes is resolution limited arguing strongly for its collective character. For the surprisingly successful description of the data in terms of BS modes there are essentially two scenarios: (i) dominant pairing between the hybridized electron bands Khodas and Chubukov (2012) and subleading (, ) interactions between the electron bands. Then Leggett and BS modes cannot be distinguished Huang et al. (2018). (ii) If the ground state originates from the interaction between the incipient hole band and the electron bands a similar collective mode may be expected, but completely inert spectra are unlikely in this case making scenario (i) more likely. Yet, the distinction between the two scenarios requires quantitative theoretical studies.
Acknowledgements.
We thank L. Benfatto, P. Hirschfeld, T. Maier and L. Zhao for fruitful discussions. This work is supported by the Deutsche Forschungsgemeinschaft (DFG) through the coordinated programme TRR80 (Projekt-ID 107745057) and project HA2071/12-1. G. H. would like to thank the Alexander von Humboldt Foundation for support from a research fellowship. The work at China was supported by National Natural Science Foundation of China (No. 11834016), and the National Key Research and Development Program of China (Grant No. 2017YFA0303003) and Key Research Program of Frontier Sciences of the Chinese Academy of Sciences (Grant No. QYZDY-SSW-SLH001). ).Supplementary information
A. Sample characterization
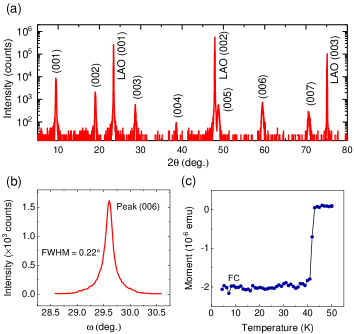
X-ray diffraction (XRD) measurements were carried out on a 9 kW Rigaku SmartLab x-ray diffractometer. Magnetization measurements were done using a Quantum Design MPMS-XL1 system with a measuring field of 1 Oe to characterize the superconducting state. Figure 5 (a) and (b) show the XRD characterizations of the (Li1-xFex)OHFeSe films. The XRD pattern exhibits a single preferred orientation of (00) for (Li1-xFex)OHFeSe, and the peaks of LaAlO3 substrates are marked with LAO. The corresponding full width at half maximum (FWHM) of the rocking curve for the (006) reflection is 0.22∘, indicative of the high crystalline quality. Figure 5 (c) presents the typical temperature dependent magnetization of a small piece of a (Li1-xFex)OHFeSe film. Sharp transition was reproduced for several small pieces (approximately 22 mm2) of thin films of the same batch and indicates that the sample is homogeneous. The , obtained from the onset temperature of diamagnetism, of optimal (Li1-xFex)OHFeSe films is 42 K. The transition width (10 to 90 % of the full signal) is less than 2 K. The film thickness is on the order of 100 nm as reported in Ref. Huang et al. (2017a).
B. Determination of the spot temperature
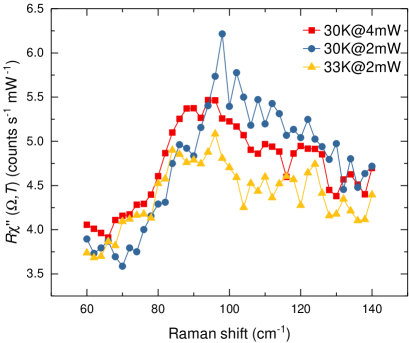
The real temperature in the illuminated spot is higher than the holder temperature due to the laser heating effect. In order to figure out the heating, we measure the spectra in symmetry at 30 K and 33 K with different laser power. As seen in Fig. 6, the peak positions measured at 30 K with an absorbed laser power of 4 mW and at 33 K measured with 2 mW are almost the same. Therefore, we can estimate that the laser induced heating is approximately 1.5 K/mW.
C. Surface quality
To clarify the origin of the additional peaks appearing in the range of 220-260 cm-1 in , and symmetry, we compared the spectra in cleaved and as-grown regions as shown in Fig. 7. It can be clearly seen that the additional peaks disappear in the cleaved region in both and symmetry. It means that they stem from surface contamination or degradation, and originate probably from the , (1), (2) and (3) phonons of Fe oxides Shim and Duffy (2002). We can rule out a luminescence effect since these peaks stay pinned and only change intensity for different laser lines (see SI.D) as shown in Fig. 9. Because the film is too thin, the and phonons of the substrate (LaAlO3) Sathe and Dubey (2007) become stronger after cleavage.
D. Resonances
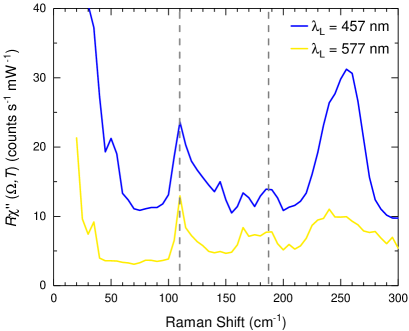
Figure 8 shows the Raman spectra in symmetry for the excitation lines at 457 and 577 nm. The peak at 250 cm-1 is enhanced for blue laser excitation. The peak at 50 cm-1 is a plasma line in the blue. The peak at 35 cm-1 with yellow excitation, is of unknown origin. However, neither of them is related to superconductivity since they also appear above the superconducting transition temperature. The superconductivity-induced peaks are located at the same positions for both yellow and blue laser (see dashed lines in Fig. 9), which means that resonance effects play a minor or no role.
E. Data reproducibility
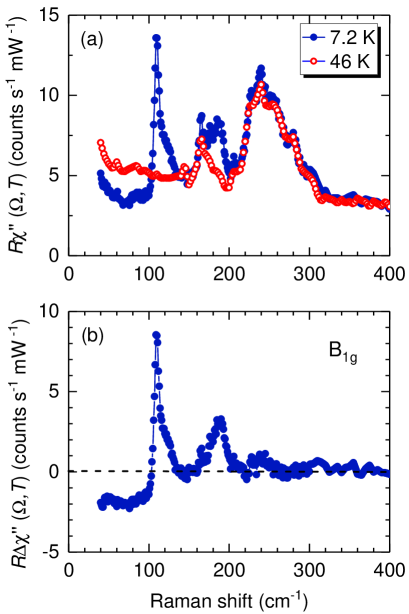
Figure 9 shows the Raman spectra in symmetry taken from the second spot on the same sample. The two superconductivity-induced peaks can be observed at 110 and 190 cm-1, which are consistent with the results of the first spot (Fig. 2 in the main text). The peaks at 165 cm-1 and 240 cm-1 are ascribed to a leakage of the phonon and phonons of Fe oxides respectively, as described in the main text and SI. C. All these features indicate that our data are well reproducible.
F. Fluctuations
Gallais et al. proposed that nematic fluctuations may enhance the pair-breaking peak resonantly Gallais et al. (2016). In fact, if there are fluctuations in the system, an extra contribution may be superimposed on the electronic continuum in the Raman spectra Kretzschmar et al. (2016). This contribution cannot be observed in the Raman spectra of (Li1-xFex)OHFeSe above as shown in Fig. 10. One could argue that the low-energy part is not as well resolved in (Li1-xFex)OHFeSe as in Ba(Fe1-xCox)2As2 as a consequence of the poor stray-light rejection. Yet, it is fair to say that there is no clear evidence for temperature dependence comparable to that in Ba(Fe1-xCox)2As2 (see, e.g. our recent paper in Phil. Mag. Lederer et al. (2020)). In addition, the spectra in (Li1-xFex)OHFeSe and optimally doped Ba(Fe1-xCox)2As2 look very different, and, although more work on (Li1-xFex)OHFeSe samples having better surfaces is necessary, we tend to conclude that fluctuations cannot be observed in (Li1-xFex)OHFeSe above . We note that the line shape of a nematic resonance cannot a priory be distinguished from a BS mode on the basis of just one doping level.
| Parameters | 2(cm-1) | 2(cm-1) | (cm-1) | ||||||
| BS or Leggett mode + PB peak | 112 | 186 | 0.16 | 0 | 1 | 0.1 | 0.53 | 0.30 | 3 |
| Two BS modes | 112 | 224 | 0.16 | 0.40 | 1 | 0.1 | 0.53 | 0.12 | 3 |
| Two PB peaks | 108 | 186 | 0 | 0 | 1 | 0.1 | 0.82 | 0.20 | 3 |
G. Phenomenology of collective modes
For describing the data we adopted the phenomenology proposed by Scalapino and Devereaux Scalapino and Devereaux (2009). In this theory, the -wave state pairing strength exceeds that of the -wave state. Therefore, except for the -wave ground state, there could be a -wave () collective excitonic mode. The Raman scattering is given by
| (1) |
Here, is the -wave ground-state gap. and are the -wave and -wave pairing strength respectively. A small damping term has been added to control the integrals. The function is defined by
| (2) |
Since the line at 110 cm-1 is very narrow the resolution of the spectrometer cannot be neglected and a convolution with a Gaussian is necessary for properly describing the Raman scattering intensity
| (3) |
where is the variance of the Gaussian.
Figure 11 shows plots of the Raman response for different coupling strength . With the increase of the , the pair breaking peak gets suppressed. In our case, there are two distinct superconducting energy gaps. To simplify, we treat them as two independent isotropic gaps on the different bands as suggested by the tunneling experiments, that contribute to Raman scattering separately. The total Raman intensity is expressed as
| (4) |
where is a dimensionless constant.
Based on this phenomenological model, we fit the difference Raman spectrum in symmetry by considering three situations, i.e. two pair-breaking peaks (see Fig. 11), one BS or Leggett mode plus one pairing-breaking mode (see Fig.4(b) in the main text) and two BS modes (see Fig.4(d) in the main text). The fitting parameters are listed in Table 2. It is obvious that the two peaks in spectrum can not be explained by only considering two isotropic s-wave gaps.
References
- Paglione and Greene (2010) J. Paglione and R. L. Greene, Nature Phys. 6, 645 (2010).
- Mazin et al. (2008) I. I. Mazin, D. J. Singh, M. D. Johannes, and M. H. Du, Phys. Rev. Lett. 101, 057003 (2008).
- Scalapino (2012) D. J. Scalapino, Rev. Mod. Phys. 84, 1383 (2012).
- Onari and Kontani (2009) S. Onari and H. Kontani, Phys. Rev. Lett. 103, 177001 (2009).
- Kontani and Onari (2010) H. Kontani and S. Onari, Phys. Rev. Lett. 104, 157001 (2010).
- Borisenko et al. (2016) S. V. Borisenko, D. V. Evtushinsky, Z. H. Liu, I. Morozov, R. Kappenberger, S. Wurmehl, B. Buchner, A. N. Yaresko, T. K. Kim, M. Hoesch, T. Wolf, and N. D. Zhigadlo, Nature Phys. 12, 311 (2016).
- Lederer et al. (2015) S. Lederer, Y. Schattner, E. Berg, and S. A. Kivelson, Phys. Rev. Lett. 114, 097001 (2015).
- Lu et al. (2015) X. F. Lu, N. Z. Wang, H. Wu, Y. P. Wu, D. Zhao, X. Z. Zeng, X. G. Luo, T. Wu, W. Bao, G. H. Zhang, F. Q. Huang, Q. Z. Huang, and X. H. Chen, Nature Mater. 14, 325 (2015).
- Burrard-Lucas et al. (2013) M. Burrard-Lucas, D. G. Free, S. J. Sedlmaier, J. D. Wright, S. J. Cassidy, Y. Hara, A. J. Corkett, T. Lancaster, P. J. Baker, S. J. Blundell, and S. J. Clarke, Nature Mater. 12, 15 (2013).
- Zhao et al. (2016) L. Zhao, A. J. Liang, D. N. Yuan, Y. Hu, D. F. Liu, J. W. Huang, S. L. He, B. Shen, Y. Xu, X. Liu, L. Yu, G. D. Liu, H. X. Zhou, Y. L. Huang, X. L. Dong, F. Zhou, K. Liu, Z. Y. Lu, Z. X. Zhao, C. T. Chen, Z. Y. Xu, and X. J. Zhou, Nature Communi. 7, 10608 (2016).
- Nekrasov and Sadovskii (2015) I. A. Nekrasov and M. V. Sadovskii, JETP Lett. 101, 47 (2015).
- Shi et al. (2017) X. Shi, Z.-Q. Han, X.-L. Peng, P. Richard, T. Qian, X.-X. Wu, M.-W. Qiu, S. C. Wang, J. P. Hu, Y.-J. Sun, and H. Ding, Nature Commun. 8, 14988 (2017).
- Du et al. (2016) Z. Y. Du, X. Yang, H. Lin, D. L. Fang, G. Du, J. Xing, H. Yang, X. Y. Zhu, and H. H. Wen, Nature Communi. 7, 10565 (2016).
- Du et al. (2018) Z. Y. Du, X. Yang, D. Altenfeld, Q. Q. Gu, H. Yang, I. Eremin, P. J. Hirschfeld, I. I. Mazin, H. Lin, X. Y. Zhu, and H. H. Wen, Nature Phys. 14, 134 (2018).
- Chen et al. (2019) C. Chen, Q. Liu, T. Z. Zhang, D. Li, P. P. Shen, X. L. Dong, Z. X. Zhao, T. Zhang, and D. L. Feng, Chin. Rev. Lett. 36, 057403 (2019).
- Devereaux and Hackl (2007) T. P. Devereaux and R. Hackl, Rev. Mod. Phys. 79, 175 (2007).
- Scalapino and Devereaux (2009) D. J. Scalapino and T. P. Devereaux, Phys. Rev. B 80, 140512(R) (2009).
- Maiti et al. (2016) S. Maiti, T. A. Maier, T. Böhm, R. Hackl, and P. J. Hirschfeld, Phys. Rev. Lett. 117, 257001 (2016).
- Kretzschmar et al. (2013) F. Kretzschmar, B. Muschler, T. Böhm, A. Baum, R. Hackl, H. H. Wen, V. Tsurkan, J. Deisenhofer, and A. Loidl, Phys. Rev. Lett. 110, 187002 (2013).
- Böhm et al. (2014) T. Böhm, A. F. Kemper, B. Moritz, F. Kretzschmar, B. Muschler, H. M. Eiter, R. Hackl, T. P. Devereaux, D. J. Scalapino, and H. H. Wen, Phys. Rev. X 4, 041046 (2014).
- Abrikosov and Fal’kovskii (1961) A. A. Abrikosov and L. A. Fal’kovskii, Zh. Eksp. Teor. Fiz. 40, 262 (1961), [Sov. Phys. JETP 13, 179 (1961)].
- Klein and Dierker (1984) M. V. Klein and S. B. Dierker, Phys. Rev. B 29, 4976 (1984).
- Bardasis and Schrieffer (1961) A. Bardasis and J. R. Schrieffer, Phys. Rev. 121, 1050 (1961).
- Leggett (1966) A. J. Leggett, Prog.Theor. Phys. 36, 901 (1966).
- Klein (2010) M. V. Klein, Phys. Rev. B 82, 014507 (2010).
- Blumberg et al. (2007) G. Blumberg, A. Mialitsin, B. S. Dennis, M. V. Klein, N. D. Zhigadlo, and J. Karpinski, Phys. Rev. Lett. 99, 227002 (2007).
- Huang et al. (2017a) Y. L. Huang, Z. P. Feng, S. L. Ni, J. Li, W. Hu, S. B. Liu, Y. Y. Mao, H. X. Zhou, F. Zhou, K. Jin, H. B. Wang, J. Yuan, X. L. Dong, and Z. X. Zhao, Chin. Rev. Lett. 34, 077404 (2017a).
- Huang et al. (2017b) Y. L. Huang, Z. P. Feng, J. Yuan, W. Hu, J. Li, S. L. Ni, S. B. Liu, Y. Y. Mao, H. X. Zhou, H. B. Wang, F. Zhou, G. M. Zhang, K. Jin, X. L. Dong, and Z. X. Zhao, arXiv: 1711.02920 (2017b).
- Zhang et al. (2019) A. Zhang, X. Ma, Y. Wang, S. Sun, B. Lei, H. Lei, X. Chen, X. Wang, C. Chen, and Q. Zhang, Phys. Rev. B 100, 060504(R) (2019).
- Muschler et al. (2009) B. Muschler, W. Prestel, R. Hackl, T. P. Devereaux, J. G. Analytis, J. H. Chu, and I. R. Fisher, Phys. Rev. B 80, 180510(R) (2009).
- Jost et al. (2018) D. Jost, J.-R. Scholz, U. Zweck, W. R. Meier, A. E. Böhmer, P. C. Canfield, N. Lazarević, and R. Hackl, Phys. Rev. B 98, 020504(R) (2018).
- Böhm et al. (2018) T. Böhm, F. Kretzschmar, A. Baum, M. Rehm, D. Jost, R. H. Ahangharnejhad, R. Thomale, C. Platt, T. A. Maier, W. Hanke, B. Moritz, T. P. Devereaux, D. J. Scalapino, S. Maiti, P. J. Hirschfeld, P. Adelmann, T. Wolf, H. H. Wen, and R. Hackl, Npj Quantum Mater. 3, 48 (2018).
- Devereaux and Einzel (1995) T. P. Devereaux and D. Einzel, Phys. Rev. B 51, 16336 (1995).
- Monien and Zawadowski (1990) H. Monien and A. Zawadowski, Phys. Rev. B 41, 8798 (1990).
- Suhl et al. (1959) H. Suhl, B. T. Matthias, and L. R. Walker, Phys. Rev. Lett. 3, 552 (1959).
- Khodas and Chubukov (2012) M. Khodas and A. V. Chubukov, Phys. Rev. Lett. 108, 247003 (2012).
- Thorsmølle et al. (2016) V. K. Thorsmølle, M. Khodas, Z. P. Yin, C. L. Zhang, S. V. Carr, P. C. Dai, and G. Blumberg, Phys. Rev. B 93, 054515 (2016).
- Gallais et al. (2016) Y. Gallais, I. Paul, L. Chauvière, and J. Schmalian, Phys. Rev. Lett. 116, 017001 (2016).
- Kang and Fernandes (2016) J. Kang and R. M. Fernandes, Phys. Rev. Lett. 117, 217003 (2016).
- Khodas et al. (2014) M. Khodas, A. V. Chubukov, and G. Blumberg, Phys. Rev. B 89, 245134 (2014).
- Cea and Benfatto (2016) T. Cea and L. Benfatto, Phys. Rev. B 94, 064512 (2016).
- Huang et al. (2018) W. Huang, M. Sigrist, and Z. Y. Weng, Phys. Rev. B 97, 144507 (2018).
- Linscheid et al. (2016) A. Linscheid, S. Maiti, Y. Wang, S. Johnston, and P. J. Hirschfeld, Phys. Rev. Lett. 117, 077003 (2016).
- Mishra et al. (2016) V. Mishra, D. J. Scalapino, and T. A. Maier, Sci. Rep. 6, 32078 (2016).
- Shim and Duffy (2002) S. H. Shim and T. S. Duffy, American Mineralogist 87, 318 (2002).
- Sathe and Dubey (2007) V. G. Sathe and A. Dubey, J. Phys.: Condens. Matter 19, 382201 (2007).
- Kretzschmar et al. (2016) F. Kretzschmar, T. Böhm, U. Karahasanović, B. Muschler, A. Baum, D. Jost, J. Schmalian, S. Caprara, M. Grilli, C. Di Castro, J. G. Analytis, J. H. Chu, I. R. Fisher, and R. Hackl, Nat. Phys. 12, 560 (2016).
- Lederer et al. (2020) S. Lederer, D. Jost, T. Böhm, R. Hackl, E. Berg, and S. A. Kivelson, Phil. Mag. 100, 2477 (2020).