Characterization of the gelation and resulting network of a mixed-protein gel derived from sodium caseinate and ovalbumin in the presence of glucono--lactone
Abstract
We investigated mixed-protein gels made from sodium caseinate and ovalbumin at different ratios with use of the acidification agent glucono--lactone. Dynamic viscoelastic measurements revealed that increasing the ovalbumin content decreased the mechanical properties of the gel but accelerated onset time of the phase transition. Ultrasound spectroscopy during gelation revealed that the relative velocity gradually decreased, whereas the ultrasonic attenuation increased during the whole acidification process until gelation was complete, although these changes were much smaller than those observed with heat-induced gelation. Confocal laser scanning microscopy along with scanning electron microscopy revealed that although uniform mixing of sodium caseinate and ovalbumin was observed, sodium caseinate is likely to mainly lead formation of the gel network, and the porosity of the resulting gel network depends on the ratio of these two components. The results demonstrate that confocal laser scanning microscopy is a useful tool for analyzing both the networks within mixed-protein gels and the contribution of each protein to the network and gelation.
I Introduction
The interactions between different proteins in mixed-protein gel systems are interesting because they are able to produce novel physicochemical properties of gels as shown in several reports [1, 2]. However, some details remain unknown—for example, how an individual protein contributes to the final gel network.
In the past two decades, food scientists have adopted ultrasound spectroscopy as a standard method for analysis of gelation mechanisms of food constituents. For example, Povey et al. [3] investigated the ultrasonic properties of mildly and severely denatured bovine serum albumin, namely, both the velocity and attenuation changes of ultrasound during the process were monitored. They found that mild heat treatment caused the albumin molecules to dimerize or trimerize without any change in velocity of sound-wave propagation, whereas severe heat treatment resulted in irreversible denaturation and gelation, which affected both ultrasound velocity and attenuation. We previously investigated the effects of sodium caprate, (a type of fatty-acid sodium salt) on the formation of mixed-protein gels of ovalbumin ultrasound spectroscopy, Fourier transform–infrared spectroscopy, and scanning electron microscopy (SEM) [4]. In the presence or absence of sodium caprate, heating the -casein–OVA mixture resulted in a transparent or translucent gel. (OVA) and -casein using rheological measurements, Furthermore, in other work, we reported that -casein contributes to sodium caprate–induced gelation with one type of heat-coagulable protein, namely milk whey protein, without heating [5]. These studies suggested that room-temperature, slow gelation facilitates the analysis of soluble aggregates during gelation. Ultrasound spectroscopy is a useful technique for studying the formation of soluble aggregates prior to the phase transition, i.e., from soluble proteins to gels. Using a mixed-protein system comprising casein and whey proteins, Vasbinder A. J. et al. [6] found that the final network structure differed depending on whether the whey protein was preheated or subjected to some other pretreatment. Their results suggested that mixing denatured whey protein with casein results in a specific three-dimensional gel network. Lopez et al. [7] investigated rennet-induced gelation of milk protein in the presence of high-methoxyl pectin. They observed that increasing the pectin content altered the microstructure of the gel and that skim milk containing no pectin (control) or only 0.04% pectin (in the presence of pectin at low concentration) could form a rennet-induced gel. The gel had a fine microstructure without pectin, whereas a more open network formed in the presence of pectin. They reported that confocal laser scanning microscopy (CLSM) techniques could be used to monitor the evolution of the network. However, their use of a single fluorescent dye physically absorbed in the network gave no detailed information on the composition (protein and polysaccharide mixture) of the resulting gel. Here, we studied the acid-induced gelation of a mixture of sodium caseinate (SC) and OVA at room temperature. Actually, their sources,namely milk and egg, are often used with flour as a dough for making flour-paste products such as hot cakes or doughnuts, and it is therefore of interest to know the interactions between both proteins. By adding a specific fluorescent probe to each of SC and OVA prior to mixing the proteins, we could visualize interactions between soluble aggregates using CLSM. We also performed several instrumental analyses (ultrasound spectroscopy, rheological measurement and SEM) with imaging analysis by CLSM. The addition of a different fluorescent probe to each of SC and OVA prior to mixing the proteins facilitated the visualization of interactions between the soluble aggregates using CLSM. The results were reinforced with several other instrumental analyses, namely ultrasound spectroscopy, rheological measurements, and SEM.
II Materials and Methods
II.1 Preparation of samples
Commercial SC (Alanate 180 made in New Zealand Milk Protein, Fontera Japan) was donated by Meiji Co. Ltd. (Japan) and used without further purification. OVA (A-5378 Grade III) was purchased from Sigma-Aldrich (USA), and glucono--lactone (GDL) was from Fujifilm Wako (Japan). Prior to the instrumental analysis, a solution of 10% (w/v) SC or OVA was prepared in distilled water containing 0.025% NaN3 . For the mixed-protein system, the two protein solutions were mixed at two different ratios: SC:OVA = 8:2 or 5:5. Finally, GDL powder (2.5%) was gradually added to the two-protein mixed solution with continuous mixing using a touch mixer.The pH of the solution was monitored continuously with a microprobe-equipped hand-held pH meter. Protein concentration was usually determined by gravimetric analysis except for the protein sample of CLSM (see 2.4 CLSM).
II.2 Rheological measurements
Dynamic modulus parameters (storage modulus (), loss modulus (), complex modulus () and loss tangent () were determined by dynamic viscoelastic measurement (Rheolograph Sol, Toyo-seiki Ltd., Tokyo, Japan). The sample solution was placed between parallel plates, and the gap between the blade and both sides of the plates was set to 1 mm. The sample solution (1.6 ml) was subjected to longitudinal (displacement magnitude ) of 1 Hz frequency at constant temperature () [8, 9]. At least three independent experiments were carried out for each sample. Data were analyzed and plotted using Microsoft Excel. shear oscillation
II.3 Ultrasonic spectroscopy
Ultrasonic spectroscopy was performed using an HR-US 102 instrument (Ultrasonic Scientific, Dublin, Ireland) provided by ST Japan (Tokyo, Japan). The data were processed with the manufacturer’s software (version 5.43). The spectrometer generates transverse sound waves that pass through both the sample and reference cells and measures both the velocity and attenuation of the transmitted sound wave. Solutions were prepared as described in 2.1. Sample solutions were degassed using a centrifuge (50 g , 3 min, ambient temperature of ) after adding GDL and equilibrated at . After loading 1 ml of each of the sample and reference (water) solutions into their respective cells, changes in both the velocity and attenuation of the sound waves at a selected frequency (2.5, 5, and 8 MHz) were continuously monitored in both the sample and reference cells with time. Prior to the experiments, the frequency was set to 2.5, 5, and 8 MHz, and calibrated with degassed water at . The velocity of sound waves through each of the sample and reference cells was recorded separately. The internal temperature of the solution was controlled via a circulator (Haake Phoenix II) with a bath (Haake C25P) (Thermo Fisher Scientific, Newington, NH, USA). At least three independent experiments were carried out for each sample. Data were analyzed and plotted using Microsoft Excel.
II.4 CLSM
The dyes used were amino-reactive N-hydroxysuccinimide esters that react with primary amines in proteins, resulting in a covalent amide bond and release of the N-hydroxysuccinimide group. From Thermo Scientific, we purchased two fluorescent dyes having different excitation and emission wavelengths: DyLight 405 (Ex/Em: 400 nm/420 nm) for SC, and DyLight 633 (Ex/Em: 638 nm/658 nm) for OVA. The labeling was performed according to the instruction manual provided by the company with a slight modification, namely, we dissolved each dye () in dimethyl formamide () and then mixed it with the protein (15% by weight) in 10 ml sodium borate, pH 8.5. The mixture was incubated at room temperature for 1 h and then dialyzed in the sodium borate buffer to clear any unreacted dye. The protein concentration was determined by the Lowry method [10]. When needed (less than 10%), each protein solution was concentrated using a centrifuge tube with a nonionic membrane (nonionic serve 010 type) which produced from GE healthcare life science. To prepare each sample, we mixed dye-treated SC and OVA solutions (total protein concentration 10%) with GDL powder (final concentration 2.5% by weight and at ambient temperature around ) and immediately placed the mixture () into the gap between the cover and slide glass using parafilm (thickness ), sealed the edges of the cover glass with manicure sealant, and monitored the pH change over time. CLSM images were obtained using a LSM 780 confocal microscope (ZEISS) alternating between 488nm and 543nm exitations at ambient temperature () with the following settings: DyLight 405 (excitation, 405 nm with a diode laser; detection range, 409–552 nm) and DyLight 633 (excitation, 633 nm with a He-Ne laser; detection range, 637–746 nm). Images were processed and analyzed with Zeiss ZEN 2012 software.
II.5 SEM
The gels were formed during acidification by GDL (2.5%) at ambient temperature (). Aliquots were taken at different pH values and rinsed immediately with 0.5% (w/v) glutaraldehyde to halt any further change in pH of the gel. Then, each gel sample was followed by chemical fixation using 0.5% osmium tetroxide in 0.1 M sodium phosphate buffer (pH 7), and then conductive staining was performed using 0.5% (w/v) filtered tannic acid. This double-fixation method followed by conductive treatment with 0.5% tannic acid was repeated according to methods by Yuno-Ohta et al. [11] to prevent solubilization of gels and ensure fixation. Gels were then dehydrated in a series of ethanol solutions of increasing concentration (50, 70, 80, 90, 95 and 100% and again 100%, v/v). Following dehydration, ethanol was completely replaced with tert-butyl alcohol by soaking in tert-butyl alcohol solutions of increasing concentration (20, 40, 70, and 100% and again in 100%, v/v). Samples were dried using a tert-butyl-alcohol dryer (Sinku Devices Co. Ltd., VFD-21S, Ibaraki, Japan) and then glued to Au (150-Å thickness) on a quick auto coater SC-701 (Sanyu Denshi Co. Ltd.). Microscopy was performed with a SEM (JSM-6010LA type, JEOL, Japan).
III Results
III.1 Rheology during gelation and the influence of OVA content
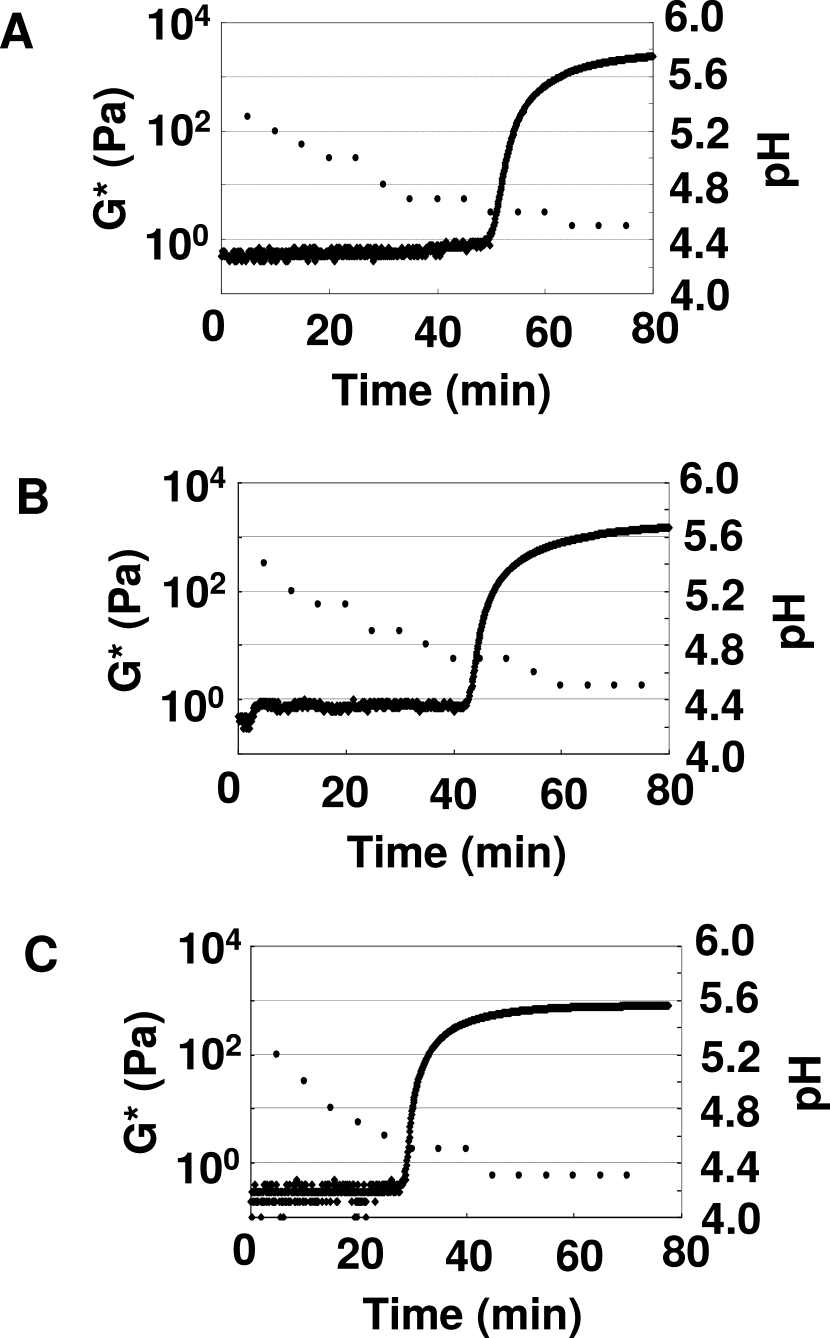
Figure 1 presents data concerning changes in the complex modulus () and pH with time after GDL was added to the protein solutions. The isoelectric point (pI) values for these proteins are similar, i.e., 4.44–4.76 for -casein, 4.83–5.07 for -casein [12], and 4.5–4.8 for OVA [13], and thus we expected that the response to a drop in pH should be independent of the mixing ratio. Indeed, started to increase when the pH reached 4.5, although the pH decreased more rapidly with higher OVA content.
Table 1 presents data for the , , the gap between and , , , and the time at which the increase in complex modulus started. Generally, the final value for was smaller than 0.5, indicating that it is roughly recognized as a gel. Furthermore, Ross-Murphy et al. [14] reported when the value of is ¿10-fold greater than that of , the gel is considered a true gel [14]. Therefore, the three protein systems we tested were considered dense suspensions or weak gels [15]. and decreased as the proportion of OVA increased. The dynamic modulus of the 5% SC +5% OVA system increased most rapidly among the three gel formulations, perhaps owing to the more rapid decrease of pH during gelation (Fig. S5).
| Composition | Rheology at 75min (Pa) | Starting time to increase of | |||||
| SC | OVA | ||||||
| 10% | 0% | 1960 | 748 | 1212 | 2099 | 0.38 | 51 min |
| 8% | 2% | 1320 | 444 | 876 | 1383 | 0.34 | 43 min |
| 5% | 5% | 752 | 240 | 512 | 789 | 0.32 | 30 min |
III.2 Ultrasonic velocity and attenuation during gelation
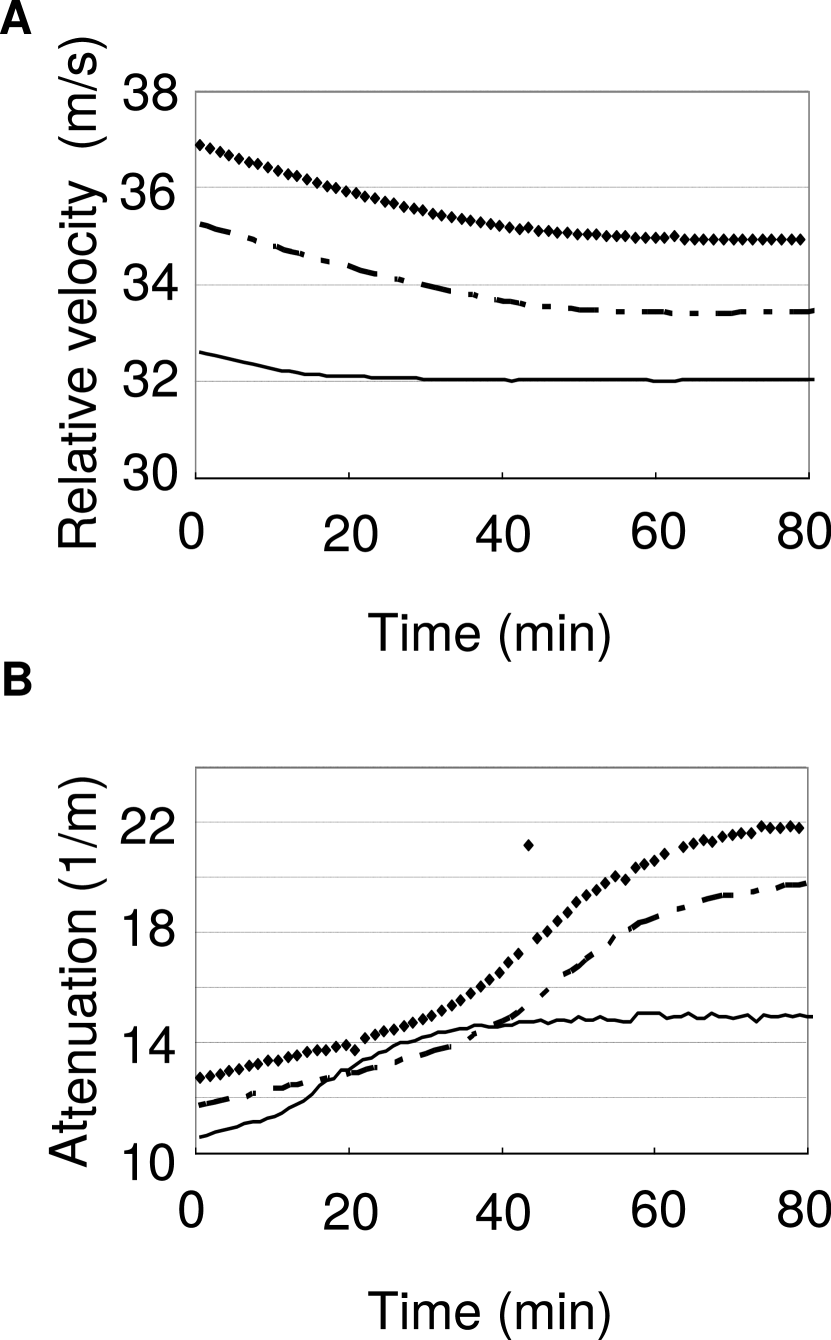
Figure 2A shows the change in ultrasonic velocity during GDL-induced acidification. The velocity began to decrease immediately for all ratios of mixed SC and OVA but plateaued sooner for the 5% SC + 5% OVA sample. The decrease in velocity occurred before gelation began, whereas the plateau in velocity corresponded to a gelled sample. The change was approximately 1.8 m/s after 60 min for each of the 10% SC and the 8% SC + 2% OVA mixed systems, whereas the change was 0.6 m/s for the 5% SC + 5% OVA system after 60 min, which initially decreased 0.6 m/s within the initial 20 min and remained constant thereafter. This implied that the magnitude of the velocity decrease diminished with higher OVA content. The extreme case was for 10% OVA, for which velocity did not decrease over the entire 80-min period (not shown), suggesting that SC is the primary cause of the velocity reduction.
Figure 2B presents data for the change in attenuation, which increased with time for all ratios but plateaued sooner for the 5% SC + 5% OVA sample. The overall change in attenuation was approximately for the 10% SC system and the 8% SC + 2% OVA mixed system and for the 5% SC + 5% OVA system.
The temporal velocity and attenuation changes were similar for the 10% SC sample and 8% SC + 2% OVA sample, whereas the increase in attenuation of the 5% SC + 5% OVA sample was 60% smaller than that of the 10% SC sample or 8% SC + 2% OVA sample and plateaued by 40 min. 258 We previously investigated the changes in ultrasonic velocity and attenuation during the formation of a sodium caprate–induced -lactoglobulin A gel at ambient temperature, revealing a velocity change of 1.5 m/s, whereas the attenuation change was throughout the experiment [16]. These changes were very small in comparison with heat-induced gelation, e.g., a 10 m/s decrease in velocity and increase in attenuation upon heating [17]. Thus, our previous and current results show that changes in the ultrasonic parameters in the SC system (with or without OVA) during acidification are induced with only a small change caprate–induced gelation and with relatively large attenuation changes despite the lack of heat treatment [16, 17].
III.3 Microstructure during gelation as assessed with CLSM imaging
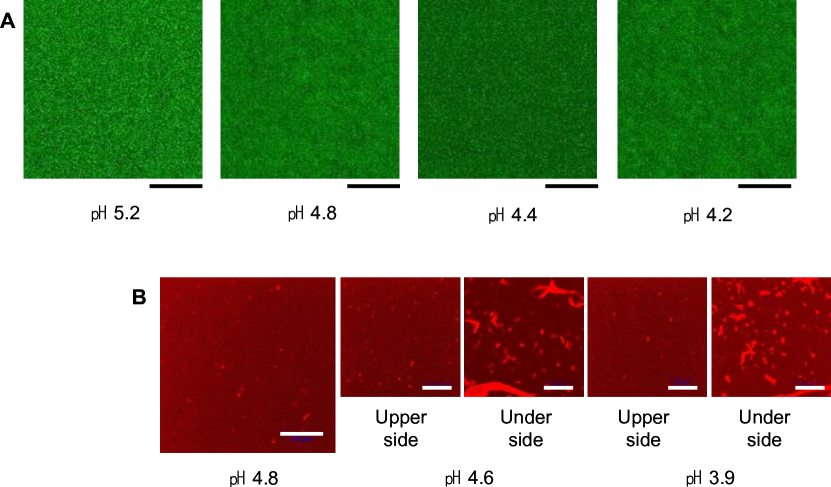
Figure 3 presents data for the changes in images of SC or OVA protein that coincided with the temporal decrease in pH owing to the addition of GDL. At pH 5.2, although the SC solution was still turbid, numerous small and sphere-shaped particles were observed but no interacting particles were observed among SC particles (Fig. 3A; upper images). As the pH continued to decrease over time, the SC underwent gelation, and faint amorphous structures were visible at pH 4.8 and pH 4.2. At these pH values, samples were gelled. Few or no structures were visible at pH 4.4, and no movement was observed, indicating that the sample had gelled. Given that pH 4.4 is the closest pH to the pI of SC, the gel particles became too small to be visible with CLSM. On the other hand, during acidification, OVA itself precipitated without gelling (Fig. 3B, lower images). Notably, CLSM revealed a continuous movement of the precipitates until gelation.
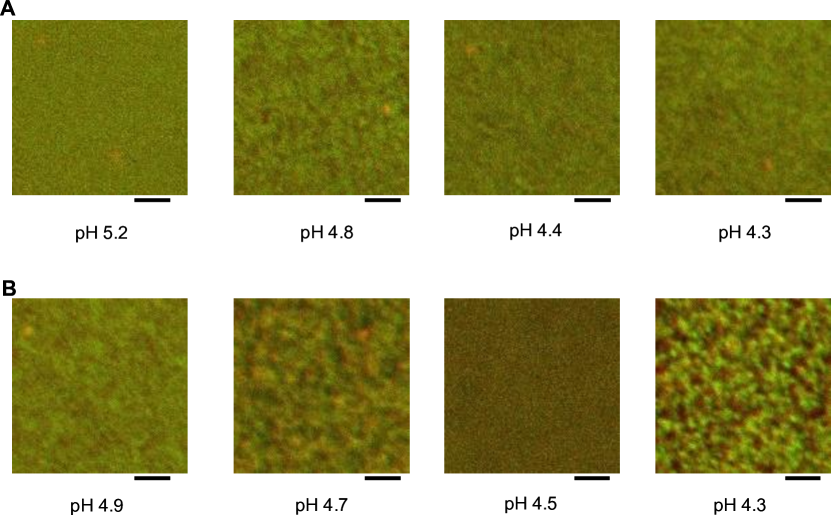
Figure 4 shows the acid-induced evolution of the structures of two mixed systems: 8% SC + 2% OVA (Fig. 4A, upper images) and 5% SC + 5% OVA (Fig. 4B, lower images). In general, the 5% SC + 5% OVA samples (Fig. 4B) had coarser structures than the 8% SC + 2% OVA samples, the exceptions being the pH 4.4 / 8% SC + 2% OVA sample and the pH 4.5 / 5% SC + 5% OVA sample, as both of these pH values are close to the pI. Interestingly, only very small particles were observed in the pH 4.5 / 5% SC + 5% OVA sample, although the lack of movement hinted that the sample had gelled. This result indicated that the particle size of the gels decreases substantially at pH values near the pI, even in mixed gels. Notably, both constituents were well mixed within optical resolution, as the network appeared uniformly yellow-green (equal parts green for SC and red for OVA), although several red (OVA) aggregates were observed (Fig. 4A, pH 4.8, 4.4, 4.3; Fig. 4B, pH 4.7, 4.3).
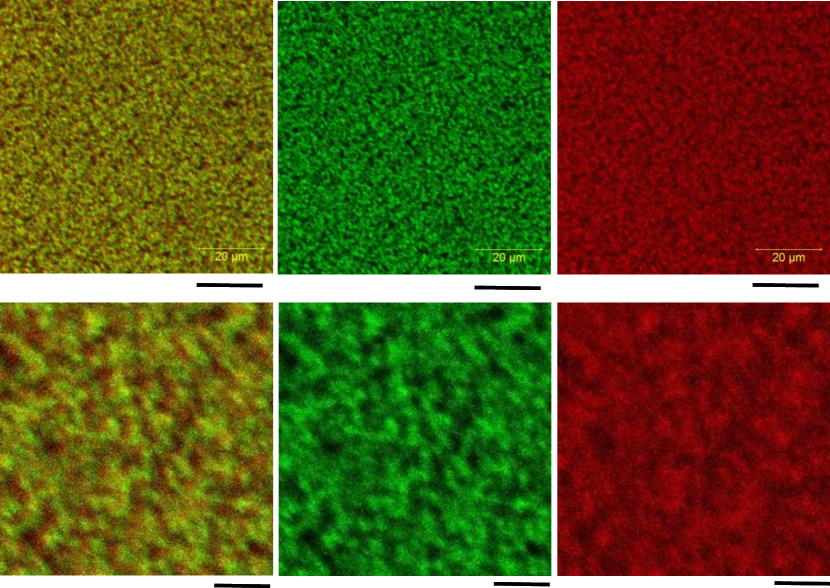
Figure 5 shows separate and merged images for the respective proteins in the 5% SC + 5% OVA gel at pH 4.2. The upper and lower images were acquired at different magnifications. Indeed, the red and green channels are superimposable, indicating that SC and OVA acted cooperatively during gel formation (upper images). However, the OVA aggregates were spread out a little broader around the SC network (lower images; also see Fig. S1, S2, S3 and S4).
III.4 Ultrastructure of the SC and OVA mixed-protein gel
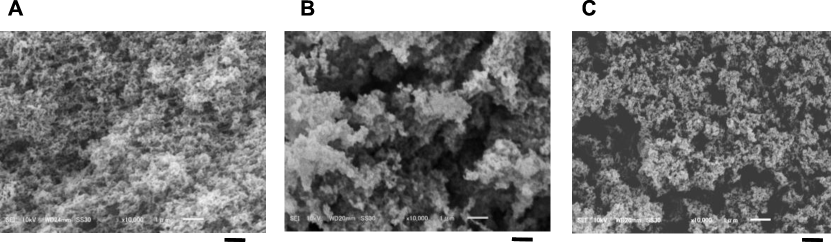
As mentioned above, we found that the SC system and the SC + OVA mixed-protein system at pH values near the pI had smaller particles than the systems at pH values above or below the pI. We therefore performed SEM to determine any differences in the network at pH values near the pI (4.5) with the increase in OVA ratio. SEM revealed that these gels had distinct ultrastructures at pH values near the pI (Fig. 6). The SC gel had a homogeneous structure with small pores, whereas the mixed gels with OVA had distinct microstructures with larger pores. In particular, the 8% SC + 2% OVA sample had larger aggregates, in agreement with the CLSM images that showed that the 8% SC + 2% OVA gel had larger particles than the 10% SC and 5% SC + 5% OVA gels.
IV Discussion
This study investigated the interaction between SC and OVA during GDL-mediated gelation using complementary instrumental analyses. CLSM and SEM revealed that both proteins were well mixed and cooperatively participated in gel formation. We suggest that SC and OVA can collaborate during gelation to make a well-developed three-dimensional structure when mixed at a 1:1 molar ratio, but it is likely that SC is mainly responsible for gel-network formation. High-resolution ultrasonic spectroscopy is a nondestructive means of elucidating structural changes that occur within proteins during acidification-induced gelation and can also detect protein aggregation during this process [18]. Furthermore, ultrasound spectroscopy is very sensitive and therefore can be used to help us understand the phase transitions within proteins, e.g., the transition [13] of a protein from the soluble to gelled state, and this technique can be combined with other rheological analyses. Kudryashov et al. [19] investigated the process by which milk gels form during acidification with GDL. They used 2% -LG or 3.3% milk protein (fresh milk) and 2% GDL, which is a higher proportion of GDL than that used in our experimental conditions. They found that the ultrasonic parameters changed along with the temporal decrease in pH from 5.6 to 4.6 owing to solubilization of colloidal calcium phosphate. In other work, Corredig et al. [20] compared ultrasonic properties during the gel-formation process using different methods of gelling fresh milk and commercial milk whey (renneting milk, acidifying milk, and heat-gelling whey protein). They found that formation of a gel in the acidified milk system caused very small changes in ultrasonic velocity and attenuation. They mentioned about the reason that the changes in the structures of casein micelles may occur in the system prior to gelation. Several studies have produced conflicting results. For example, McClements[21, 22] stated that changes in attenuation can arise from changes in particle size, whereas Dalgleish et al. [23] reported that although the attenuation increased at the early stage of acidification, the particle size decreased in direct measurements using diffusing wave spectroscopy. Our system differed from the systems used in those studies. For example, our material (SC) contained approximately one-tenth part minerals (Ca and P, etc.) of fresh milk. The velocity decreased and the attenuation increased in all three systems along with the decrease of pH, which generally reflected the trend of gel formation in these three systems, i.e., 10% SC, 8% SC + 2% OVA, and 5% SC + 5% OVA. Due to low mineral content of SC, it seems that colloidal calcium phosphate may not have had any effect at all on gelation in our experimental system. It seems that differences in components may be an important factor for the observed differences of ultrasound property changes between the Dalgleish et al. study (using fresh milk) and our present study (using SC). Our current study suggests that, although the differences in ultrasound properties between the 10% SC gel and the 8% SC + 2% OVA mixed-protein gel were not clear, the dynamic viscoelastic measurements revealed differences in their dynamic modulus—in other words, the gel network structure changed depending on the SC:OVA ratio. Furthermore, our CLSM results indicated that the observed differences in rheological properties are attributable to differences in gel networks in the mixed-protein systems. In those mixed systems, both proteins were well mixed at pH values near their pI, probably owing to loss of electrostatic repulsion. The pI for each of SC or OVA is 4.5, and thus it remains uncertain why the pH of samples containing more OVA decreased supplemental figure S5). However, it is very interesting that the mixed-protein systems formed gels although phase separation during acidification microstructures of 8% SC + 2% OVA and 5% SC + 5% OVA revealed that these proteins respond differently to acidification by GDL. more rapidly occurred than only for those 10% containing OVA. more Comparison SC of (see the Vasbinder et al. [6] investigated the role of whey in reconstituted skim milk, and the network that was formed was analyzed with CLSM via separate staining for casein and whey protein isolate (WPI). They found that whey protein aggregates were not linked to the casein micelles and formed without phase separation when mixed with casein. The WPI aggregates could interact with the casein fraction when the pH approached the pI values for WPI and casein, and the casein and whey formed a gel shortly thereafter. We conclude that the inclusion of OVA (like WPI three-dimensional network of the resulting gel depending on the proportion of OVA. [6]) in a SC-based gel modifies the texture and Whereas there are many experimental techniques for understanding the texture of biomolecular gels, the combined use of CLSM and SEM can help us visualize how the different components of a mixed-protein system contribute to the gel microstructure.
V Conclusion
We investigated the gelation and resulting gel network of a mixed-protein system derived from SC and OVA in the presence of GDL to determine how OVA affects the gelation process and the gel network. The results indicated that increased OVA content lessened the mechanical strength of the gel yet accelerated gelation. Although CLSM and SEM revealed that the SC and OVA solutions mixed uniformly, SC likely led to the formation of the gel network and governed the porosity of the resulting network depending on the SC:OVA ratio. Based on our results, it appears that the inclusion of OVA in a SC-based gel modifies the texture and three-dimensional network of the resulting gel depending on the proportion of OVA. Utilization of CLSM for analysis of a mixed-protein gel is useful for determining differences in the networks of mixed-protein gels and the contribution of each protein to gel formation.
Acknowledgements.
The authors would like to thank Meiji Co., Ltd. (Kanagawa, Japan) for providing sodium caseinate samples. This work was supported in part by a Grant-in-Aid for Scientific Research on Priority Areas (No. 16K00838) from the Ministry of Education, Culture, Sports, Science and Technology in Japan.References
- Matsudomi et al. [2003] N. Matsudomi, Y. Kanda, and H. Moriwaki, Journal of Agricultural and Food Chemistry 51, 7140 (2003).
- Mession et al. [2015] J.-L. Mession, M. L. Chihi, N. Sok, and R. Saurel, Food Hydrocolloids 46, 233 (2015).
- Povey et al. [2011] M. J. W. Povey, J. D. Moore, J. Braybrook, H. Simons, R. Belchamber, M. Raganathan, and V. Pinfield, Food Hydrocolloids 25, 1233 (2011).
- Yuno-Ohta et al. [2014] N. Yuno-Ohta, M. Endo, M. Sawaki, and M. Kishikawa, Nippon Shokuhin Kagaku Kogaku Kaishi = Journal of the Japanese Society for Food Science and Technology 61, 183 (2014).
- Yuno-Ohta and Corredig [2011] N. Yuno-Ohta and M. Corredig, Colloids and Surfaces B: Biointerfaces 84, 442 (2011).
- Vasbinder et al. [2004] A. J. Vasbinder, F. van de Velde, and C. G. de Kruif, Journal of Dairy Science 87, 1167 (2004).
- Lopez et al. [2009] A. A. Lopez, M. Corredig, and M. Alexander, Food Biophysics 4, 249 (2009).
- Nishinari et al. [1980] K. Nishinari, H. Horiuchi, K. Ishida, K. Ikeda, M. Date, and E. Fukada, Nippon Shokuhin Kogyo Gakkaishi 27, 227 (1980).
- Yuno-Ohta et al. [1998] N. Yuno-Ohta, T. Higasa, E. Tatsumi, H. Sakurai, R. Asano, and M. Hirose, Journal of Agricultural and Food Chemistry 46, 4518 (1998).
- Lowry et al. [1951] O. H. Lowry, N. J. Rosebrough, A. L. Farr, R. J. Randall, et al., J biol Chem 193, 265 (1951).
- Yuno-Ohta et al. [2016] N. Yuno-Ohta, T. Kato, S. Ashizawa, Y. Kimura, N. Maruyama, and T. Nishizu, Colloid and Polymer Science 294, 1065 (2016).
- Eigel et al. [1984] W. N. Eigel, J. E. Butler, C. A. Ernstrom, H. M. Farrell, V. R. Harwalkar, R. Jenness, and R. M. Whitney, Journal of Dairy Science 67, 1599 (1984).
- Powrie and Nakai [1986] W. Powrie and S. Nakai, Egg science and technology, (Avi Publishing, Westport, CT, 1986) Chap. The Chemistry of Eggs and Egg Products. Ch. 6.
- Ross-Murphy [2012] S. B. Ross-Murphy, Physical Techniques for the Study of Food Biopolymers (Springer, 2012).
- Ikeda and Nishinari [2001] S. Ikeda and K. Nishinari, Journal of Agricultural and Food Chemistry 49, 4436 (2001).
- Yuno-Ohta and Corredig [2007] N. Yuno-Ohta and M. Corredig, Biomacromolecules 8, 2542 (2007).
- Corredig et al. [2004a] M. Corredig, E. Verespej, and D. G. Dalgleish, Journal of Agricultural and Food Chemistry 52, 4465 (2004a).
- Buckin and Kudryashov [2001] V. Buckin and E. Kudryashov, Advances in Colloid and Interface Science 89-90, 401 (2001).
- Kudryashov et al. [2000] E. Kudryashov, C. Smyth, G. Duffy, and V. Buckin, in Trends in Colloid and Interface Science XIV, Progress in Colloid and Polymer Science, edited by V. Buckin (Springer, Berlin, Heidelberg, 2000) pp. 287–294.
- Corredig et al. [2004b] M. Corredig, M. Alexander, and D. G. Dalgleish, Food Research International Ultrasonics in Food (Physical Properties V), 37, 557 (2004b).
- McClements [1996] D. J. McClements, Langmuir 12, 3454 (1996).
- McClements [2006] D. J. McClements, in Encyclopedia of Analytical Chemistry (American Cancer Society, 2006).
- Dalgleish et al. [2004] D. Dalgleish, M. Alexander, and M. Corredig, Food Hydrocolloids 18, 747 (2004).