The evolution of the size-mass relation at =1-3 derived from the complete Hubble Frontier Fields data set
Abstract
We measure the size-mass relation and its evolution between redshifts 13, using galaxies lensed by six foreground Hubble Frontier Fields clusters. The power afforded by strong gravitation lensing allows us to observe galaxies with higher angular resolution beyond current facilities. We select a stellar mass limited sample and divide them into star-forming or quiescent classes based on their rest-frame UVJ colors from the ASTRODEEP catalogs. Source reconstruction is carried out with the recently-released lenstruction software, which is built on the multi-purpose gravitational lensing software lenstronomy. We derive the empirical relation between size and mass for the late-type galaxies with at 12.5 and at 2.53, and at a fixed stellar mass, we find galaxy sizes evolve as . The intrinsic scatter is dex at but increases to dex at higher redshift. The results are in good agreement with those obtained in blank fields. We evaluate the uncertainties associated with the choice of lens model by comparing size measurements using five different and publicly available models, finding the choice of lens model leads to a 3.7% uncertainty of the median value, and % scatter for individual galaxies. Our work demonstrates the use of strong lensing magnification to boost resolution does not introduce significant uncertainties in this kind of work, and paves the way for wholesale applications of the sophisticated lens reconstruction technique to higher redshifts and larger samples.
keywords:
galaxies: evolution – galaxies: fundamental parameters – gravitational lensing: strong1 Introduction
A fundamental evolutionary parameter of a galaxy is its size and the size distribution of galaxy populations can reveal important clues as to their assembly histories and underlying dark matter halos (Mo et al., 1998; Wechsler & Tinker, 2018). The comparison of galaxy structural properties such as sizes, stellar masses and luminosities further reveals tight scaling relations which likely dictate complex and diverse evolutionary pathways and afford the means to test the standard paradigm of galaxy formation and evolution. As an example, the size evolution of different galaxy types (i.e., early- and late-type galaxies) is found to be remarkably different, suggesting clearly distinct modes of stellar growth and dark matter halo assembly.
The empirical size-mass relationship, defined as , and its evolution with redshift, , have been investigated by several previous studies for both early- and late-type galaxies, sometimes with conflicting end results that can aid to test the basic theory of galaxy formation (Mo et al., 1998). For instance, setting the benchmark at “zero redshift” using a complete sample of 140,000 local galaxies (both early-type and late-type) from the Sloan Digital Sky Survey, Shen et al. (2003) found a power-law slope of 0.4 for late-type galaxies more massive than M), while below this characteristic stellar mass the slope flattens down further to 0.15, implying a less rapid size evolution with stellar mass. On average, they find more massive galaxies tend to be characterised by larger radii than their less massive counterparts, implying a degree of “inside out” galaxy growth. Comparing this to their samples of early-type galaxies, the authors found that the relation for early-type galaxies displays a significantly steeper slope at fixed stellar mass, with 0.55, indicating a potentially separate and much faster evolutionary pathway. Despite the narrow redshift range of their sample (0.050.15), the authors conclude a negligible change in their size-mass relations over redshift.
Further expanding the analysis to redshifts of 03 with 31,000 galaxies of M109M⊙ from CANDELS and 3D-HST, van der Wel et al. (2014) found values (0.2) for both early- and late-type galaxies which are consistent with those reported for the low-redshift Universe, however the size distributions of these galaxies are found to be significantly smaller - i.e., a factor of 2 and 4 for late- and early-type galaxies respectively - indicating some redshift evolution (0.75 and 1.48). These findings were reaffirmed by Morishita et al. (2014) and Mowla et al. (2019), who extended the work of van der Wel et al. (2014) to samples of higher mass galaxies at the same redshifts.
Despite the success of the aforementioned studies in characterising the size-mass relation from the local to the high-redshift Universe, importantly they are limited by the angular resolution of the Hubble Space Telescope (HST). To circumvent this issue, gravitational lensing serves as a powerful tool with which to extend the investigation of scaling relations to potentially fainter and smaller galaxies. The Hubble Frontier Fields (HFF) program (Coe et al., 2015; Lotz et al., 2017) has delivered significant samples of extremely faint galaxies, pushing down to unprecedented depths and out to very high redshift (6-8), allowing for more detailed characterisation of reionization-era objects. In particular, size measurements of the faintest such galaxies are crucial for understanding the contributions of galaxies to the reionization process of the universe: parameterisation of the faint-end (-15) of the galaxy luminosity functions (LFs) allow one to determine the prevalence of the most abundant star-forming sources that are likely to be responsible for driving the reionization process (Atek et al., 2015; Kawamata et al., 2015; Livermore et al., 2017). While extremely small sizes have been found for the faintest such galaxies (e.g., 200 pc; Bouwens et al. 2017), the associated uncertainty of these lensed measurements are driven by the assumed lens model and serve as the main source of uncertainty in the determination of the LF faint-end slope (Grazian et al., 2011; Oesch et al., 2015; Alavi et al., 2016; Bouwens et al., 2017; Atek et al., 2018). In addition to the detection of especially faint sources, gravitationally lensing also provides the chance to observe galaxies with high angular resolution. Pioneering works e.g., Marshall et al. (2007) presented study of super-resolving galaxies at 0.5. Newton et al. (2011) explored 46 strongly lensed galaxies from the Sloan Lens ACS Survey (SLACS) at lower redshift 0.40.8, and found sizes of 300pc for the lowest mass galaxies with the size-mass relation offset to smaller sizes w.r.t. blank fields. A similar result was found by Oldham et al. (2017) who studied a population of red lensed galaxies, demonstrating that they fall below the size mass relation, suggesting that they are the evolved version of the compact massive galaxies found at high redshifts. Recently, Vanzella et al. (2020) discovered a strongly lensed (magnification factor 40) Ly emission galaxy at , with intrinsic effective radius pc. However, those studies were focused on strongly lensed galaxies with magnification factor 10 or even larger, and thus possibly affected by magnification bias, which favors more compact sources.
Here, we build on these previous studies by studying the galaxies lensed by the HFF clusters, with the intrinsic stellar mass at 13. Respect to previous lensing works, we study a complete stellar mass selected sample with a range of magnification, thus providing a statistically equivalent counterpart to blank field studies, at higher effective angular resolution.
In the context of lensed galaxies, lens models are necessary to determine the intrinsic source properties. In the current state-of-art of lensing modeling technique in the cluster scale, lens models tend to reproduce the position of multiple images rather than hand a full source reconstruction. Several works (e.g.,Bouwens et al. (2017); Atek et al. (2018)) presented the impact of the choice of lensing models on scaling relation and LF, although Meneghetti et al. (2017) have confirmed the accuracy and precision of the different strong lensing methods to a certain degree. Therefore, we have to consider systematic uncertainties due to the selection of lens models when analysis lensed galaxies.
In this manuscript, we investigate the size-mass relation and size evolution of both early- and late-type galaxies with super-resolving galaxies derived from the HFF at 13, making use of package lenstruction 111https://github.com/ylilan/lenstruction developed by Yang et al. (2020), which is powered by lenstronomy222https://github.com/sibirrer/lenstronomy(Birrer et al., 2015; Birrer & Amara, 2018), a multi-purpose open-source gravitational lens modeling package. In Section 2, we describe the data and selection criteria. In Section 3, we describe the details of measuring the sizes of galaxies. Evolution of size-mass relation is presented in Section 4. Assessment of strong lensing uncertainties and discussion are in Section 5. Finally, we give our summary in Section 6. We assume the standard CDM cosmology with parameters , AB magnitude and the Chabrier (2003) stellar initial mass function.
2 Data
2.1 Multiwavelength photometric catalogues
We base our analysis on the v1.0 reductions of HFF imaging data and the latest publicly-available lens models333http://www.stsci.edu/hst/campaigns/frontier-fields/Lensing-Models. The HFF program provides ultra-deep observations over six lensing clusters, Abell 2744, MACS J0416.1-2403, MACS J0717.5+3745, MACS J1149.5+2223, Abell S1063 and Abell 370, and obtains images in HST ACS (F435W, F606W, F814W) and WFC3/IR (F105W, F125W, F140W, F160W) on both the main cluster and the parallel fields. We adopt the multiwavelength photometric catalogues of these images from the ASTRODEEP project 444http://www.astrodeep.eu/, which collects imaging from HST to ground-based -band and Spitzer/IRAC, and provides photometrically-derived global galaxy properties (e.g., redshift, stellar mass, star formation rate) from several studies derived with SED-fitting codes (Merlin et al., 2016; Castellano et al., 2016; Di Criscienzo et al., 2017; Shipley et al., 2018; Bradač et al., 2019). Prior to their use, we correct the observed stellar masses for magnification using our fiducial lens model (see Section 2.2 below) and convert them to a Chabrier (2003) IMF. Henceforth, we also refer to the F105W, F125W, F140W and F160W filters as , , and , respectively.
2.2 The HFF lens models
Lens models for each of the six HFF central clusters have been provided to the community by five independent groups (Bradač et al. 2005; Sebesta et al. 2016; Liesenborgs et al. 2007; Limousin et al. 2016; Zitrin et al. 2015; Johnson et al. 2014; henceforth, Bradač, Williams, CATS, Zitrin and Sharon, respectively), each of which adopted their own techniques (e.g., parametric and non-parametric method) to derive the lens models. Most such models are exclusive to the main cluster, however some extend to the associated parallel field. We assume the Bradač model as our fiducial model and adopt its magnification to correct the stellar mass derived from ASTRODEEP. We note and will show that the choice of fiducial lens model introduces only very small differences and thus does not affect any of our conclusions.
The initial cluster-scale lens models are known as not accurate enough for elaborate source reconstruction, but having multiple lensed images, we can constrain the relative lensing operators via information of relative morphology contained in observed lensed images (Yang et al., 2020). In our sample, we have a small number of galaxies that are from spectroscopically-confirmed multiply-imaged systems. We consult the multiply-imaged systems with high-confidence from from Mahler et al. (2018), Hoag et al. (2016), Schmidt et al. (2014), Treu et al. (2016), Strait et al. (2018) and Caminha et al. (2016) over each of the six clusters, and there are 8 multiply-imaged systems in our sample see Table 1.
2.3 Sample Selection
We obtain our sample of galaxies from the ASTRODEEP catalogs at redshifts 13 by selecting objects satisfying the following criteria:
-
•
has a reliable photometric redshift classified by RELFLAG=1 in the ASTRODEEP catalogs,
-
•
has an intrinsic stellar mass ,
-
•
has coverage by each of the central lens models derived by the five teams described above,
-
•
does not reside close to a particularly bright object or at the edge of the instrument detector,
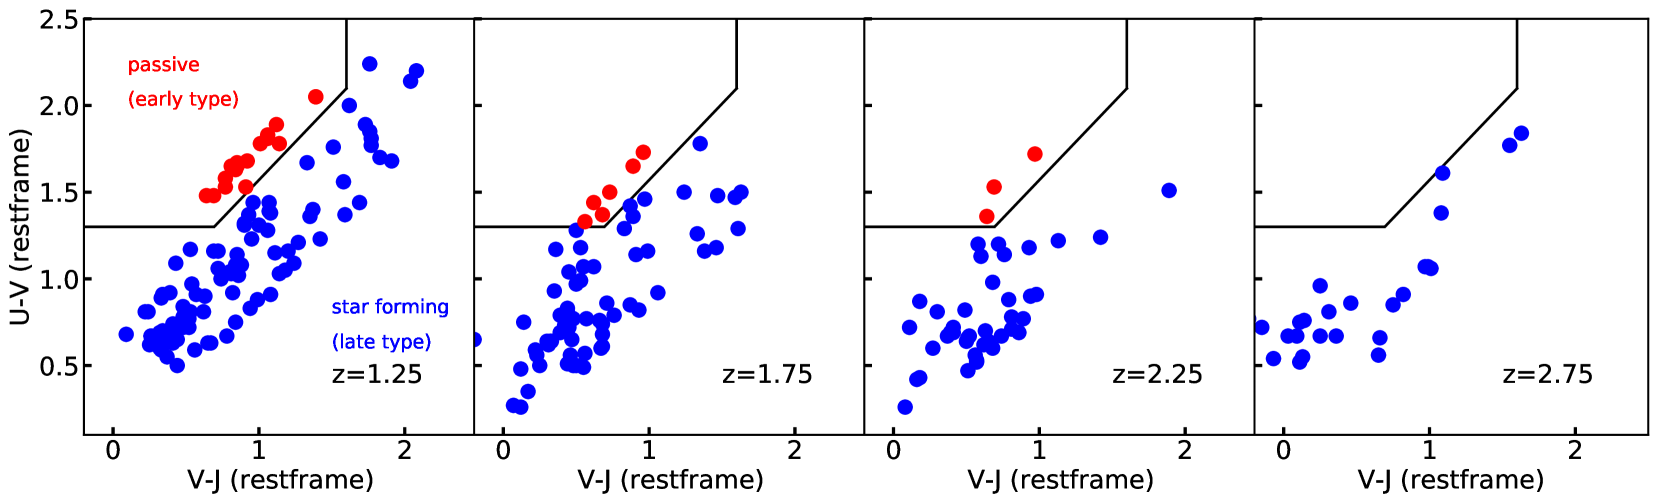
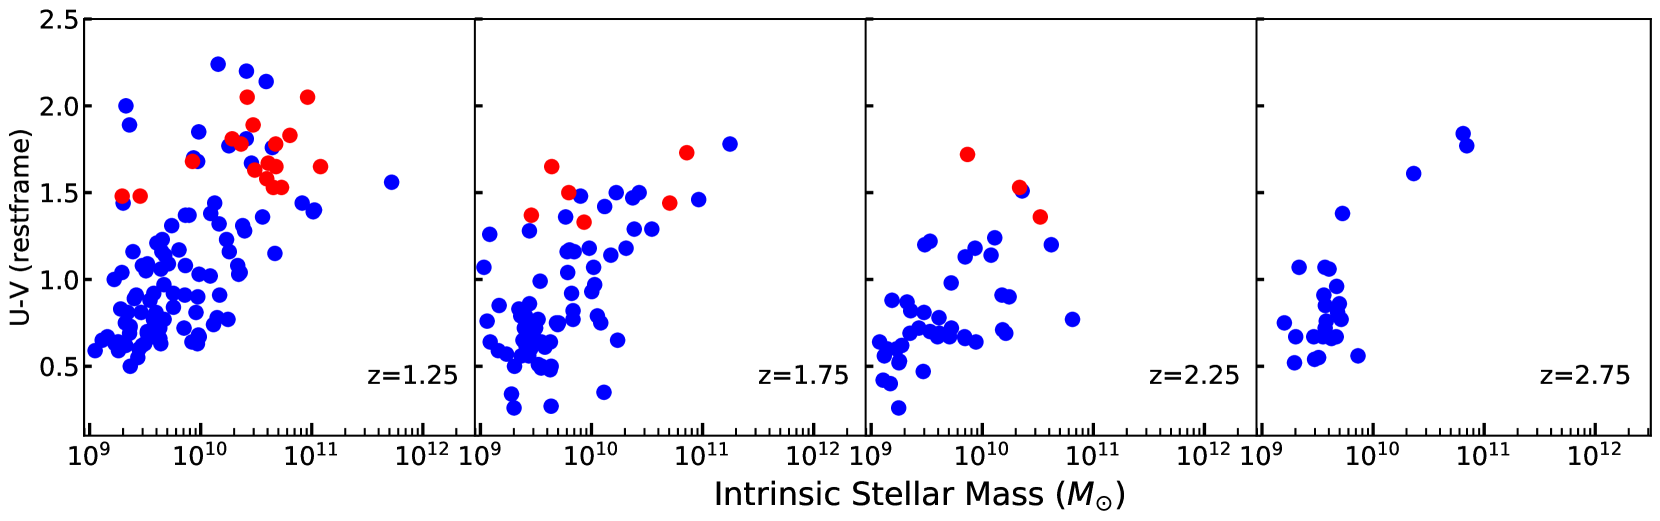
Applying the above set of criteria, we obtain a sample of 258 lensed galaxies at the aforementioned redshift, of which several objects have multiply-lensed images. In the later case, we count such galaxies only once, providing a final sample of 255 sources. We limit ourselves at this redshift range and leave the more complicated issue correlated with completeness at higher redshift to our future work. Following the criteria presented by Williams et al. (2009), we utilize rest-frame UVJ colors to distinguish between early-type (passive) and late-type (star-forming) galaxies, which we separate and present as a function of several redshift bins in Figure 1. This color space allows for a separation of the two galaxy types, although we note beyond a redshift of 1.5 there are only a handful of early-type galaxies. In Figure 2, we present the same samples as a function of rest-frame U-V color and magnification-corrected stellar mass, where it becomes clear that passive galaxies tend to be redder at all redshift bins compared to their star-forming counterparts.
| ID | RA | Dec | M∗ | multi-ID | Ref a | ||||
|---|---|---|---|---|---|---|---|---|---|
| (M☉) | (kpc) | ||||||||
| cluster Abell 2744 | |||||||||
| 75 | 3.5893 | -30.4159 | 2.730 | … | 3.79 | 0.79 | 1.39 | … | … |
| 147 | 3.5770 | -30.4134 | 1.240 | … | 12.19 | 2.27 | 1.00 | … | … |
| 161 | 3.5753 | -30.4128 | 1.390 | … | 1.69 | 6.55 | 1.62 | … | … |
| 163 | 3.5998 | -30.4139 | 1.680 | … | 3.32 | 3.76 | 4.00 | … | … |
| 273 | 3.5746 | -30.4123 | 1.372 | … | 2.30 | 2.43 | 3.50 | … | … |
| 370 | 3.5789 | -30.4100 | 1.274 | … | 1.45 | 1.40 | 1.00 | … | … |
| 438 | 3.5708 | -30.4102 | 2.540 | … | 2.92 | 1.20 | 1.03 | … | … |
| 442 | 3.5767 | -30.4102 | 1.664 | … | 2.03 | 1.71 | 1.42 | … | … |
| 451 | 3.5862 | -30.4100 | 1.498 | 1.688 | 3.29 | 7.08 | 1.93 | 1.3 | M18 |
| 501 | 3.6062 | -30.4085 | 1.355 | … | 26.23 | 1.81 | 2.52 | … | … |
| … | |||||||||
-
•
a References M18, H16, S14, T16, S18 and C16 represent category in Mahler et al. (2018) (see their Table A1), category in Hoag et al. (2016) (see their Table 2), GLASS project in Schmidt et al. (2014) (see their Table 1), category in Treu et al. (2016) (see their Table 3), Strait et al. (2018) (see their Table 2), and Caminha et al. (2016) (see their Table 1), respectively. (This table is available in the online journal. A portion is shown here for guidance regarding its form and content.)
3 Intrinsic size determination
In order to measure the size of the lensed galaxies, we make use of the recently published Python package lenstruction (Yang et al., 2020), which is built on the strong lensing software lenstronomy (Birrer et al., 2015; Birrer & Amara, 2018). lenstronomy provides the core functionalities of the modeling, including the reconstruction of the source light profile while simultaneously considering both lensing and blurring effects, and the Bayesian inference formalism. lenstronomy is the work horse underneath through which those tasks are executed. lenstruction is the wrapper around lenstronomy that provides the interface to the specific cluster data products and sets up the specific tasks required to achieve reliable source reconstructions and lens model corrections in the cluster lensing regime. We refer the reader to the GitHub repository for more general information about lenstruction and lenstronomy. Throughout this section we first describe the suitability of lenstruction for source reconstruction, describe our modeling procedures and the handling of multiply-lensed systems in Section 3.1, and finally provide a comparison with previous results found with the popular GALFIT tool in Section 3.2.
3.1 Modelling procedure
Photometric data capture only a portion of the underlying spectrum of a galaxy and thus stellar and gaseous content. Thus, in order for a consistent comparison across our redshift bins, we apply our size measurements over the image for sources at redshifts 11.5, over the image for 1.52, over the image for 22.5, and over the image for 2.53. For measurements of the point-spread function (PSF), we select a stellar object in the field of the cluster. In order to measure the reconstructed 2D light profile of the source in each image, we parameterise the profile as an elliptical Sérsic profile. The free parameters of an elliptical Sérsic profile include a surface brightness amplitude, effective radius (or half-light radius; ), Sérsic index (n), axis ratio (q), position angle, and the central position of the source. We assume a Sérsic index range between 1 to 4 and an axis ratio between 0.1 and 1. While the light profile shape changes dramatically as the n changes from 1 to 4, there is no such obvious change in the light profile shape from 4 to higher values (Graham, 2013).
Most of our sources are singly-imaged galaxies, and we fix the initial lens model due to the degeneracy between the image and the lens model. For a given lens model, we simulate each of the lensed images and convolve with the PSF in the image place. By comparing the simulated image with the observation and estimating the noise in each pixel in the image plane as a combination of a Gaussian background rms, and the Poisson term scaled with the exposure time, we are able to derive the best-fit free parameters of the applied Sérsic profile. lenstruction can automatically estimate and remove the background flux level making use of Background2D in package photutils. We note the potentially significant impact of intra-cluster light (ICL) on the size estimation due to the complexity of obtaining an ICL-subtracted image (see details in Merlin et al. (2016); Castellano et al. (2016); Di Criscienzo et al. (2017); Shipley et al. (2018); Bradač et al. (2019)). To test the validity of the routine used in lenstruction, we compare the effective radius obtained from ICL-subtracted images and the raw images, and find an excellent agreement within the errors.
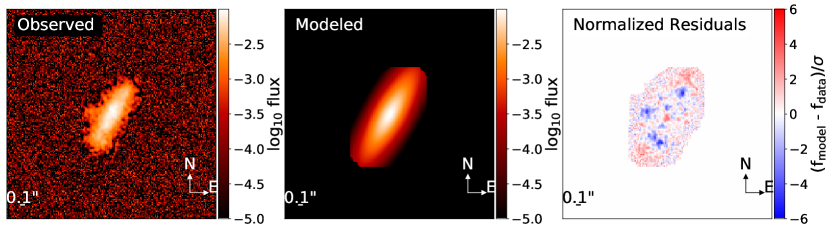
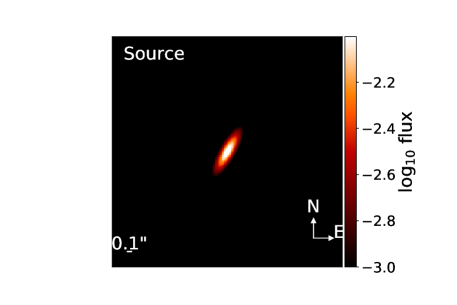
We present an example of modeling procedures in Figure 3. The uncertainties on are taken as 16th and 84th values of the MCMC results. The best fits are visually inspected and a small number of fits are discarded based on catastrophic failures induced by nearby bright emission. We summarize the results of our fitting in Table 1.
As mentioned in Section 2.2, there are 8 multiply-imaged systems in our sample (see Table 1). When multiple images are available for a given source, one can obtain important constraints on the relative lensing operators. As such, in cases of a multiply-imaged galaxy, we fist correct the initial lens model before applying it: we fix the lens parameters of the least magnified image while allowing them to vary over the other images of the same object. In some cases, it is necessary to adopt a light profile of the source with high complexity, namely a shapelet with order up to 10 or even higher (for full details see Yang et al. (2020)). Finally, equipped with the corrected lens model, we perform the same modeling procedure as described above to obtain the size of the source. The multiply-imaged systems offer an additional opportunity to quantify the uncertainty of the lens model itself, as discussed in our previous paper (Yang et al., 2020).
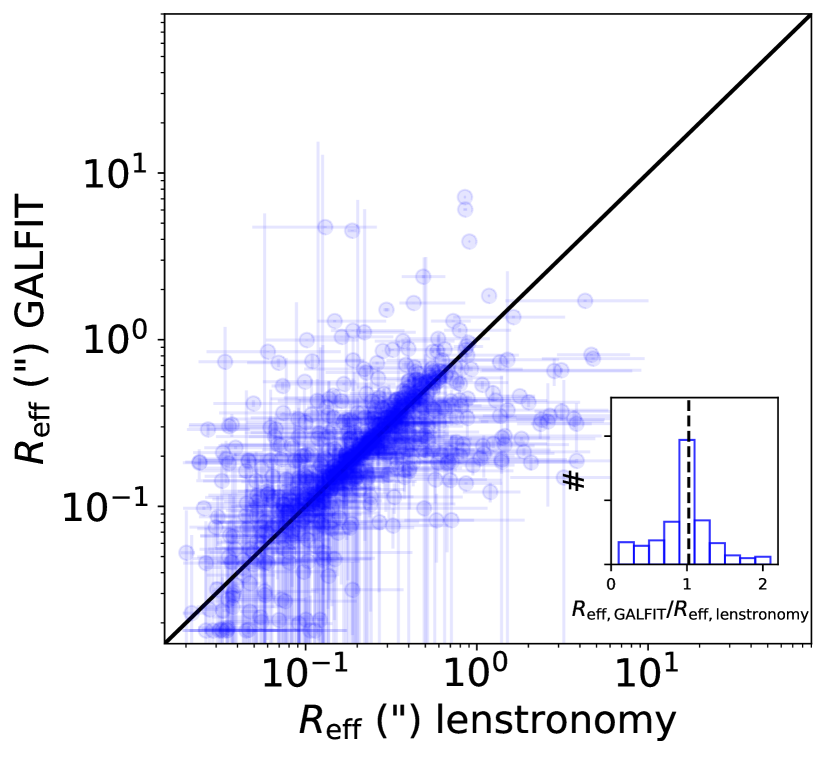
3.2 Comparing size measurements: lenstruction/lenstronomy vs GALFIT
As a consistency and reliability test of our measured galaxy sizes with performed by lenstronomy through lenstruction, we compare the size measurements between our code and GALFIT over a test sample of 1000 randomly-selected field galaxies at same redshift range , where the sizes for each of these galaxies was derived and presented by van der Wel et al. (2012) using the image (see their Table 2). To make a faithful comparison, we adopt a similar set of parameters as van der Wel et al. (2012), e.g., Sérsic index between 0.2 and 8, and axis ratio between 0.0001 and 1. We thus re-derive the sizes of the sample using the band and the same light profile model, and compare the results in Figure 4. We find the size derivations between the two software yields very similar results, with a median size ratio of 1.020.10 for two samples (see the inner panel of Figure 4). We conclude that our size derivations are thus robust and that such a comparison validates the use of lenstruction/lenstronomy.
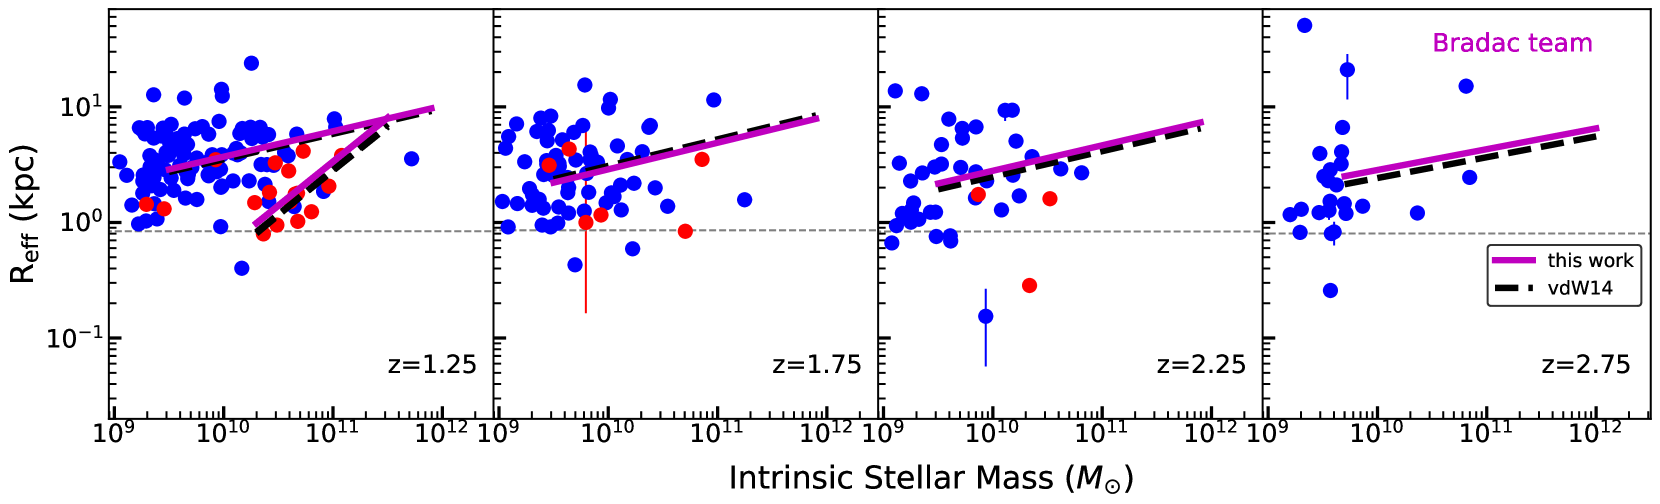
4 Evolution of size-mass distribution
We show the intrinsic size-mass distribution of resolved, lensed galaxies from the FF as a function of redshift in Figure 5. Intuitively, we see that the well-known size-mass relation exists at all redshift bins for both early- (red color) and late-type galaxies (blue color) with large intrinsic scatter. Additionally, the early-type galaxies are on average smaller than the late-type galaxies. We perform a careful analytical description of the size-mass distribution in Section 4.1 and provide an analysis of the size evolution in Section 4.2.
4.1 Analytical Description
Following works by Shen et al. (2003), van der Wel et al. (2014) and Mowla et al. (2019), we assume the effective radius obeys a log-normal distribution and parameterize the size-mass scaling relation as,
| (1) |
where A is the intercept, is the slope, and is intrinsic scatter.
Given the small numbers of our sample of early-type galaxies, we only fit the galaxies at redshift , and intrinsic stellar mass , so that we avoid the potentially flatter part of the size-mass distribution at lower stellar mass. For the late-type galaxies, where our sample size is larger, we fit galaxies with intrinsic stellar mass at , and at . We believe that our mass-limited samples are likely to be complete. Since several studies have found a lack of significant evolution of the slope, , with 0.7 for early-type and 0.2 for late-type galaxies (Newman et al., 2012; van der Wel et al., 2014), we opt to keep this parameter fixed at each redshift bin, as done in van der Wel et al. (2014). With this assumption, we subsequently use a standard Bayesian approach to derive the posterior distribution of the parameters log(A) and , while assigning 0.3 dex as the typical error in stellar mass throughout the fitting. The fitting results for both galaxy types are shown in Figure 5 as magenta solid lines, adopting the fiducial lens model of the Bradač team, while we also include a black dashed line to represent the results of van der Wel et al. (2014). For comparison, the fitting results are repeated for each of the five lens models used in this study and the resulting parameters are presented in Table LABEL:table:size-mass. In each panel, the grey dash lines demonstrate the angular resolution limitation of WFC3/IR.
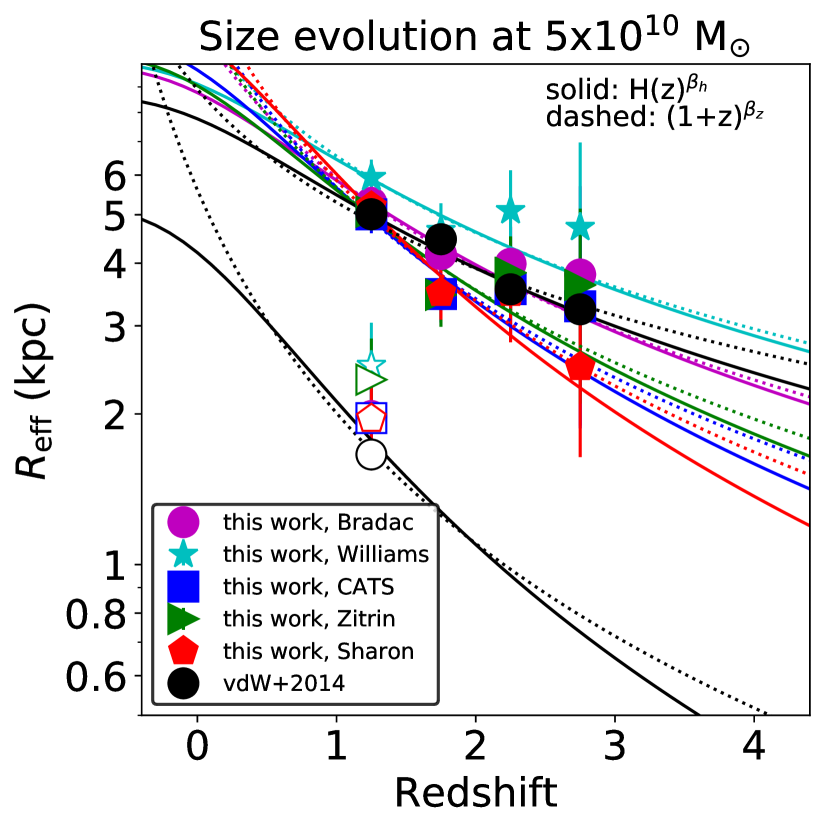
4.2 The redshift evolution of galaxy sizes and intrinsic scatter
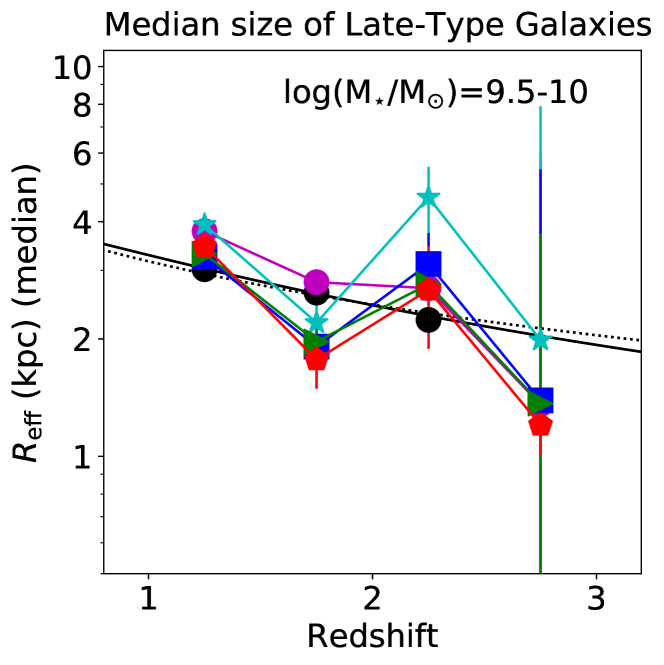
The evolution of our measured galaxy sizes and their associated scatter as a function of redshift is presented in Figure 6. In the left panel, the intercept indicates the size evolution at a fixed stellar mass of , with filled and open symbols representing late-type and early-type galaxies, respectively. Empirically, we parameterize the evolution of the y-axis intercept as a function of the cosmological scale factor, . From a more physical standpoint, since the size of a galaxy correlates with the underlying dark matter halo, we also parameterize it as function of the Hubble parameter . The results of these parameterizations yield =-1.050.37 and =-0.800.37 for our fiducial lens model. We show these results and those for the other lens models as colored solid and dash lines, while summarizing them in Table LABEL:table:size-evo. As in previous figures, for reference we show the results of field analyses from van der Wel et al. (2014) as black lines. In comparison, considering the larger uncertainties which due to the limitation of sample size, our results are consistent with van der Wel et al. (2014) for both early- and late-type galaxies. We discuss the uncertainties of the and parameterizations as a function of lens model in Section 5.1. So far, we have presented the size evolution for a fixed stellar mass. For a range of stellar mass log(M∗/M☉)=9.5-10, we show the evolution of the median resulting size in Figure 7, again as a function of lens model. The trend in this figure shows similar behavior as the trends shown in the left panel of Figure 6 and in each case is also consistent with the results from van der Wel et al. (2014).
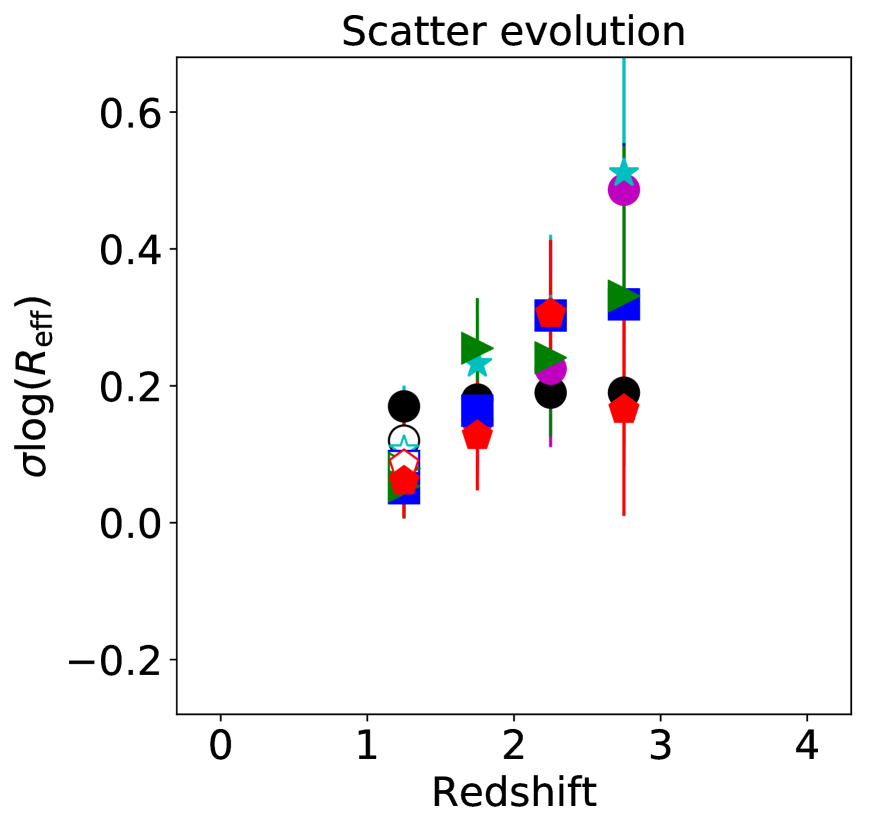
A possible evolution of the intrinsic scatter of late-type galaxies is investigated in the right panel of Figure 6. We notice a potential trend with the intrinsic scatter spanning only 0.1 dex at 1<<1.5, increasing to 0.24 dex at 1.5<<2.5, and finally reaching dex for the majority of the lens models at 2.53. However it is not significant given our uncertainties. For reference, van der Wel et al. (2014) found little or no evolution for either late- or early-type galaxies, with a constant scatter of 0.16-0.19 dex and 0.1-0.15 dex respectively. A larger sample of galaxies is required to detect a trend, if present.
| Late-type | Early-type | |||||||
|---|---|---|---|---|---|---|---|---|
| log(A) | log() | log(A) | log() | Lens model | ||||
| 1.25 | 0.72 0.04 | 0.22 | 0.06 0.05 | 0.29 0.09 | 0.76 | 0.09 0.08 | Bradač | |
| 1.75 | 0.62 0.05 | 0.23 | 0.14 0.08 | |||||
| 2.25 | 0.60 0.08 | 0.22 | 0.21 0.11 | |||||
| 2.75 | 0.58 0.21 | 0.18 | 0.50 0.23 | |||||
| 1.25 | 0.73 0.04 | 0.22 | 0.06 0.05 | 0.40 0.09 | 0.76 | 0.11 0.09 | Williams | |
| 1.75 | 0.61 0.06 | 0.23 | 0.23 0.07 | |||||
| 2.25 | 0.60 0.09 | 0.22 | 0.31 0.11 | |||||
| 2.75 | 0.58 0.21 | 0.18 | 0.51 0.22 | |||||
| 1.25 | 0.77 0.04 | 0.22 | 0.05 0.04 | 0.29 0.09 | 0.76 | 0.08 0.08 | CATS | |
| 1.75 | 0.67 0.05 | 0.23 | 0.16 0.08 | |||||
| 2.25 | 0.71 0.09 | 0.22 | 0.30 0.11 | |||||
| 2.75 | 0.67 0.19 | 0.18 | 0.32 0.24 | |||||
| 1.25 | 0.77 0.04 | 0.22 | 0.05 0.04 | 0.37 0.09 | 0.76 | 0.08 0.07 | Zitrin | |
| 1.75 | 0.67 0.06 | 0.23 | 0.25 0.07 | |||||
| 2.25 | 0.71 0.08 | 0.22 | 0.24 0.12 | |||||
| 2.75 | 0.67 0.18 | 0.18 | 0.33 0.22 | |||||
| 1.25 | 0.70 0.04 | 0.22 | 0.06 0.05 | 0.29 0.09 | 0.76 | 0.08 0.08 | Sharon | |
| 1.75 | 0.54 0.05 | 0.23 | 0.13 0.08 | |||||
| 2.25 | 0.55 0.09 | 0.22 | 0.31 0.11 | |||||
| 2.75 | 0.52 0.15 | 0.18 | 0.17 0.16 |
| Lens model | ||
|---|---|---|
| Bradač | -1.05 0.37 | -0.80 0.37 |
| Williams | -0.84 0.40 | -0.64 0.38 |
| CATS | -1.27 0.35 | -1.03 0.40 |
| Zitrin | -1.17 0.37 | -0.91 0.39 |
| Sharon | -1.36 0.28 | -1.18 0.36 |
5 Discussion
5.1 Assessment of strong lensing uncertainties
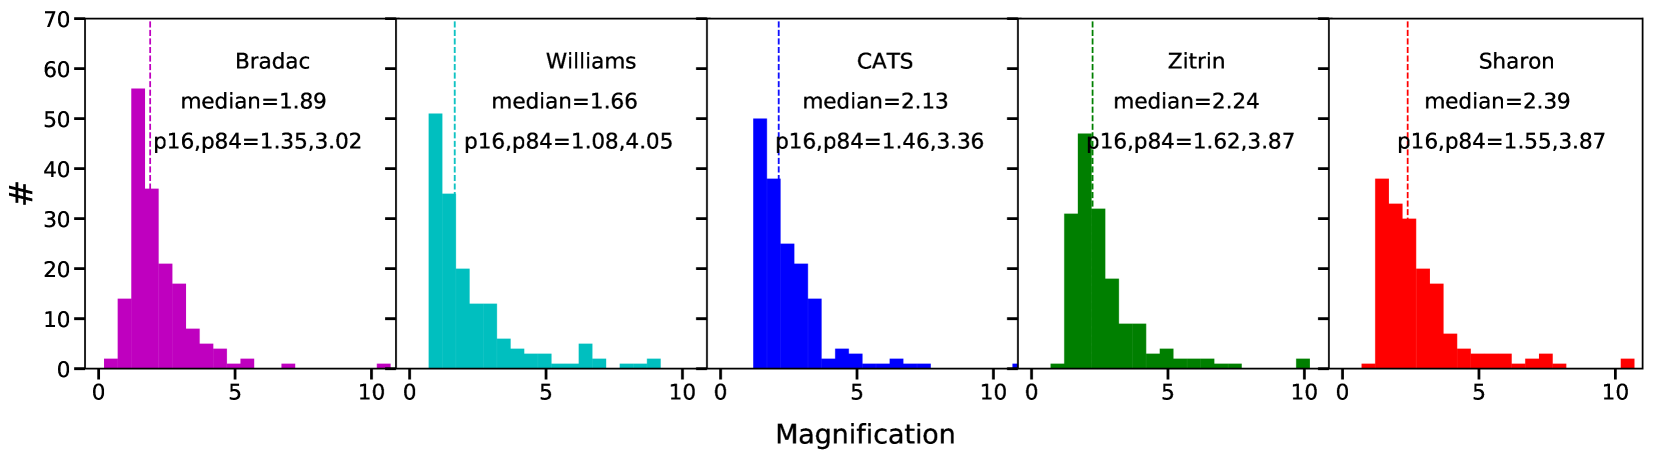
There are discrepancies among selected five lens models, although those models are generally in agreement with each other (Meneghetti et al., 2017). The choice of the lens model affects the size measurement of the intrinsic source, hence, the evolution of the size. The magnification evaluated from five lens models differ, as presented in Figure 8. We characterize the distributions of the magnification by their median and of their 16th and 84th percentiles, p16 and p84. The median magnification values of 4/5 models peak around 2, although the Williams model has a skewed distribution with smaller median value 1.66.
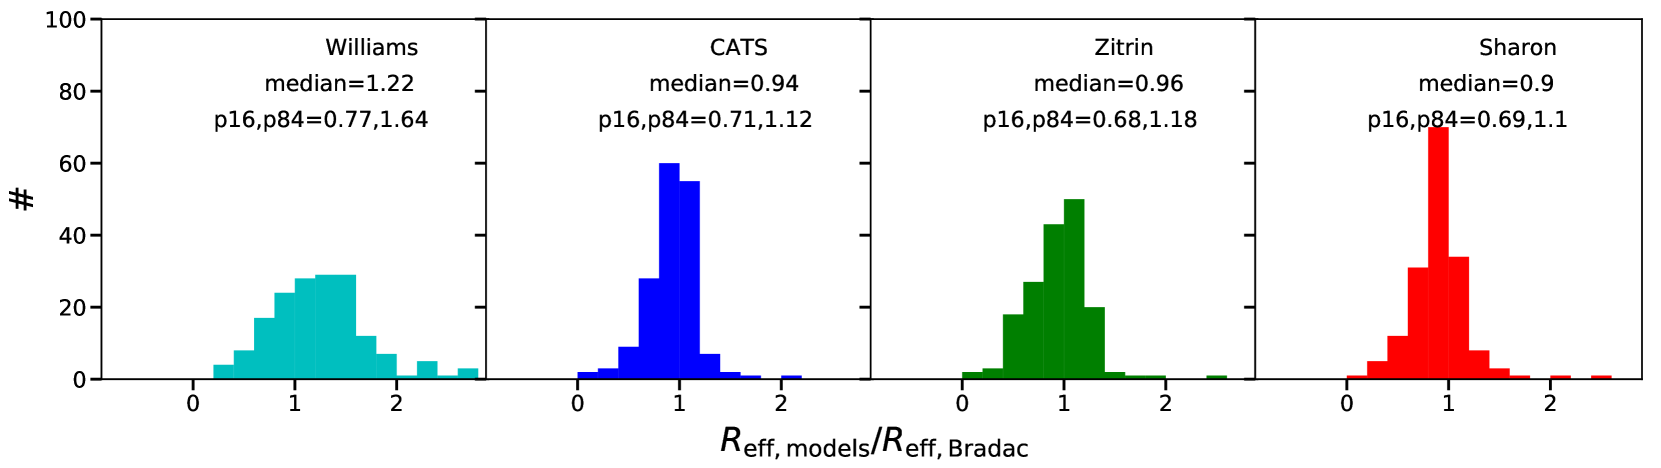
We show the distribution of the ratio between size measured from Bradač model and from other lens models in Figure 9. We characterize the distributions in the same manner as Figure 8. The results show that the median value of ratios are nearly around 1, but Williams model have larger median value1.22. The size reconstructed of same source from the Williams model is larger than from others models also shown in Yang et al. (2020). The scatter in median value across models is approximately 3.7% for 4/5 models and goes up to 11.1% when including the Williams model. CATS, Zitrin, and Sharon models are quite in good agreement with the Bradač model. For example, the inter-percentile ranges (p16-p84) found among those models are 0.41, 0.50 and 0.41 respectively. The Williams model has more scatter than the others with an inter-percentile 0.92.
For each lens model, the results of size evolution in form of and are slightly different, see Figure 6 and Table LABEL:table:size-evo. The and are -1.2 and -1.0 across models. Considering the large uncertainties in both and , i.e., 0.35, we did not observe the evident difference of evolution among models.
5.2 Comparison with previous work
Figure 5 shows that our results are in excellent agreement with previous studies based on blank fields (van der Wel et al., 2014; Mowla et al., 2019). The agreement is important for two reasons. First, compared with the higher angular resolution afforded by lensing magnification, HST has allowed us to measure the size of essentially all resolved galaxies at 13. In this context, our work provides a test of the robustness of the results in blank fields. Second, our results show that the uncertainties associated with the lensing models do not add significant bias or scatter, as indicated in Figure 9. Therefore, we conclude that lensing is a valuable and well calibrated tool for the study of more compact galaxies at higher redshift.
The same agreement cannot be said, however, for results based on galaxies selected to be strongly lensed. For instance, Newton et al. (2011) and Oldham et al. (2017) both found that their sources where significantly more compact that those found in blank fields. Their sample of strongly lensed galaxies with typical magnification 10 evidently favoured more compact galaxies which are more likely to have high magnification ("magnification bias"). Future work applying a lensing selection may be able to discover higher redshift counterparts of similarly compact galaxies to those seen by Newton et al. (2011) and Oldham et al. (2017), which are perhaps overlooked by general purpose catalogs at early selection stages when a star/galaxy separation is performed.
5.3 Implications for the high-redshift luminosity function
Characterizing the size distribution of galaxies is of great importance for understanding cosmic reionization (e.g. Grazian et al., 2012). Galaxies are believed to be the main source of photons responsible for reionizing the intergalactic medium, provided that the luminosity function has a steep faint-end and extends to luminosities fainter than what can currently be probed by HST in blank fields. The measurement of the faint-end slope depends critically on the size distribution of galaxies, through the corrections for incompleteness approaching the detection limit. Gravitational telescopes help reach fainter intrinsic luminosities than in blank fields (Kawamata et al., 2018), provided that magnification is correctly accounted for in the cosmic volume estimates (e.g. Atek et al., 2018), and the intrinsic source size can be modeled or measured simultaneously (e.g. Kawamata et al., 2015, 2018). Bouwens et al. (2017) showed that the difference in the faint-end slope between smaller (7.5mas) and larger mean size (120mas) can be as dramatic as 0.7.
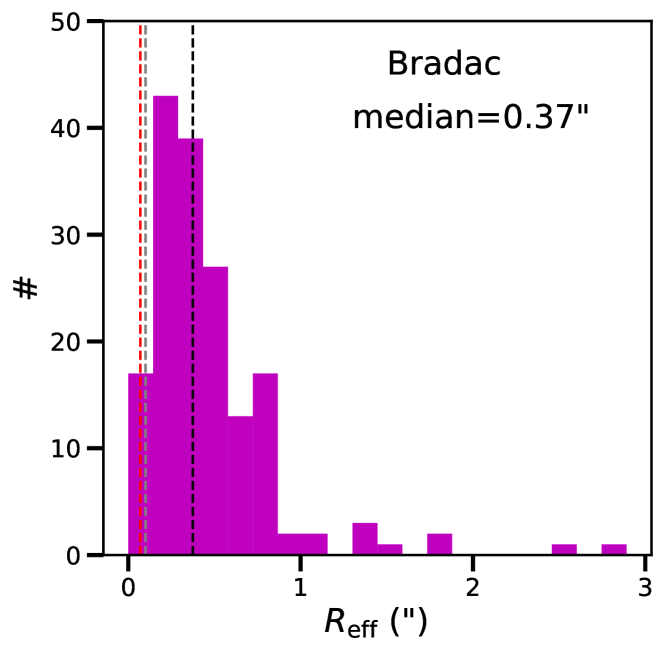
Figure 10, shows our inferred size distribution at redshifts well below cosmic reionization. Our results are robust to the choice of initial lens model, and are the necessary stepping stone for carrying out a joint study of the galaxy size luminosity relation and luminosity function beyond the HFF and in the near future with the James Webb Space Telescope (JWST). The angular resolution of JWST (0.07 arcsec at 2m; Gardner et al. 2006), coupled with gravitational telescopes should be able to pin down both the size distribution and faint-end of the luminosity function to sufficient precision to establish whether galaxies can in principle provide enough photons to reionize the universe (setting aside escape fraction uncertainty).
6 Summary
We have studied the size-mass relation and size evolution of galaxies lensed by six HFF clusters with intrinsic (corrected for magnification) stellar mass at 12.5 and at 2.53. The sample is selected using multi-wavelength photometric catalogs from ASTRODEEP, and includes spectroscopically-confirmed multiply-imaged systems. We also evaluate the uncertainties related to the choice of lens models. We summarize our main results as follows:
-
•
We utilized the rest-frame UVJ color diagram to separate our sample into early- and late-type galaxies and build a size-mass plane for the two populations. For both populations we find results in excellent agreement with previous studies from blank fields (e.g., van der Wel et al., 2014).
-
•
We describe the size evolution of late-type galaxies at fixed stellar mass with the form of and , and for the fiducial lens model we find =-1.050.37 and =-0.800.37.
-
•
We quantify the uncertainties arising from the lensing correction by comparing 5 different publicly available models. The sizes (and size-mass relation) based on the 5 lens models agree well with each other. Four of the models are quite in good agreement with each other: the median value of size ratio is 1, the scatter of the median is3.7% holistically, and the scatter per galaxy is approximately 25%. One of the models produces sizes that are approximately 20% larger than the other four. Including that model, the scatter of the median size ratio between models increases to 11%.
The agreement between the inferred size-mass relation with and without foreground lensing is encouraging for both endeavors. On the one hand, the lensing work provides a higher resolution confirmation of the blank field studies, suggesting any population of ultra-compact galaxies is not a significant fraction of the total. On the other hand, the agreement with the blank field works increases the confidence that magnification corrections are sufficiently accurate and precise for the purpose of determining the size-mass relation of galaxies. Building on this successful comparison, in future work we plan to apply lenstruction , and hence lenstronomy, to the determination of the size-luminosity relation of galaxies at , and its implication for the faint-end slope of the galaxy luminosity function.
Acknowledgements
This work utilizes gravitational lensing models produced by PIs Bradač, Natarajan & Kneib (CATS), Merten & Zitrin, Sharon, Williams, Keeton, Bernstein and Diego, and the GLAFIC group. This lens modeling was partially funded by the HST Frontier Fields program conducted by STScI. STScI is operated by the Association of Universities for Research in Astronomy, Inc. under NASA contract NAS 5-26555. The lens models were obtained from the Mikulski Archive for Space Telescopes (MAST). LY is supported from the China Scholarship Council. LY and TT acknowledge support by NASA through grant JWST-ERS-1324. The authors thank Marco Castellano, Adriano Fontana, Karl Glazebrook, Danilo Marchesini for several discussions that helped shaped the manuscript.
Data Availability
The data underlying this article are available in the article itself and in its online supplementary material.
References
- Alavi et al. (2016) Alavi A., et al., 2016, ApJ, 832, 56
- Atek et al. (2015) Atek H., et al., 2015, ApJ, 814, 69
- Atek et al. (2018) Atek H., Richard J., Kneib J.-P., Schaerer D., 2018, MNRAS, 479, 5184
- Birrer & Amara (2018) Birrer S., Amara A., 2018, Physics of the Dark Universe, 22, 189
- Birrer et al. (2015) Birrer S., Amara A., Refregier A., 2015, ApJ, 813, 102
- Bouwens et al. (2017) Bouwens R. J., Illingworth G. D., Oesch P. A., Atek H., Lam D., Stefanon M., 2017, ApJ, 843, 41
- Bradač et al. (2005) Bradač M., Schneider P., Lombardi M., Erben T., 2005, A&A, 437, 39
- Bradač et al. (2019) Bradač M., et al., 2019, MNRAS, 489, 99
- Caminha et al. (2016) Caminha G. B., et al., 2016, A&A, 587, A80
- Castellano et al. (2016) Castellano M., et al., 2016, A&A, 590, A31
- Chabrier (2003) Chabrier G., 2003, PASP, 115, 763
- Coe et al. (2015) Coe D., Bradley L., Zitrin A., 2015, ApJ, 800, 84
- Di Criscienzo et al. (2017) Di Criscienzo M., et al., 2017, A&A, 607, A30
- Gardner et al. (2006) Gardner J. P., et al., 2006, Space Sci. Rev., 123, 485
- Graham (2013) Graham A. W., 2013, Elliptical and Disk Galaxy Structure and Modern Scaling Laws. p. 91, doi:10.1007/978-94-007-5609-0_2
- Grazian et al. (2011) Grazian A., et al., 2011, A&A, 532, A33
- Grazian et al. (2012) Grazian A., et al., 2012, A&A, 547, A51
- Hoag et al. (2016) Hoag A., et al., 2016, The Astrophysical Journal, 831, 182
- Johnson et al. (2014) Johnson T. L., Sharon K., Bayliss M. B., Gladders M. D., Coe D., Ebeling H., 2014, ApJ, 797, 48
- Kawamata et al. (2015) Kawamata R., Ishigaki M., Shimasaku K., Oguri M., Ouchi M., 2015, ApJ, 804, 103
- Kawamata et al. (2018) Kawamata R., Ishigaki M., Shimasaku K., Oguri M., Ouchi M., Tanigawa S., 2018, ApJ, 855, 4
- Liesenborgs et al. (2007) Liesenborgs J., de Rijcke S., Dejonghe H., Bekaert P., 2007, MNRAS, 380, 1729
- Limousin et al. (2016) Limousin M., et al., 2016, Astronomy and Astrophysics, 588, A99
- Livermore et al. (2017) Livermore R. C., Finkelstein S. L., Lotz J. M., 2017, ApJ, 835, 113
- Lotz et al. (2017) Lotz J. M., et al., 2017, ApJ, 837, 97
- Mahler et al. (2018) Mahler G., et al., 2018, MNRAS, 473, 663
- Marshall et al. (2007) Marshall P. J., et al., 2007, ApJ, 671, 1196
- Meneghetti et al. (2017) Meneghetti M., et al., 2017, MNRAS, 472, 3177
- Merlin et al. (2016) Merlin E., et al., 2016, A&A, 590, A30
- Mo et al. (1998) Mo H. J., Mao S., White S. D. M., 1998, MNRAS, 295, 319
- Morishita et al. (2014) Morishita T., Ichikawa T., Kajisawa M., 2014, ApJ, 785, 18
- Mowla et al. (2019) Mowla L. A., et al., 2019, ApJ, 880, 57
- Newman et al. (2012) Newman A. B., Ellis R. S., Bundy K., Treu T., 2012, ApJ, 746, 162
- Newton et al. (2011) Newton E. R., Marshall P. J., Treu T., Auger M. W., Gavazzi R., Bolton A. S., Koopmans L. V. E., Moustakas L. A., 2011, ApJ, 734, 104
- Oesch et al. (2015) Oesch P. A., Bouwens R. J., Illingworth G. D., Franx M., Ammons S. M., van Dokkum P. G., Trenti M., Labbé I., 2015, ApJ, 808, 104
- Oldham et al. (2017) Oldham L., et al., 2017, MNRAS, 465, 3185
- Schmidt et al. (2014) Schmidt K. B., et al., 2014, The Astrophysical Journal, 782, L36
- Sebesta et al. (2016) Sebesta K., Williams L. L. R., Mohammed I., Saha P., Liesenborgs J., 2016, MNRAS, 461, 2126
- Shen et al. (2003) Shen S., Mo H. J., White S. D. M., Blanton M. R., Kauffmann G., Voges W., Brinkmann J., Csabai I., 2003, MNRAS, 343, 978
- Shipley et al. (2018) Shipley H. V., et al., 2018, ApJS, 235, 14
- Strait et al. (2018) Strait V., et al., 2018, The Astrophysical Journal, 868, 129
- Treu et al. (2016) Treu T., et al., 2016, The Astrophysical Journal, 817, 60
- Vanzella et al. (2020) Vanzella E., et al., 2020, MNRAS, 494, L81
- Wechsler & Tinker (2018) Wechsler R. H., Tinker J. L., 2018, ARA&A, 56, 435
- Williams et al. (2009) Williams R. J., Quadri R. F., Franx M., van Dokkum P., Labbé I., 2009, ApJ, 691, 1879
- Yang et al. (2020) Yang L., Birrer S., Treu T., 2020, MNRAS, 496, 2648
- Zitrin et al. (2015) Zitrin A., et al., 2015, The Astrophysical Journal, 801, 44
- van der Wel et al. (2012) van der Wel A., et al., 2012, ApJS, 203, 24
- van der Wel et al. (2014) van der Wel A., et al., 2014, ApJ, 788, 28