A framework for digital trace data collection through data donation
Abstract
A potentially powerful method of social-scientific data collection and investigation has been created by an unexpected institution: the law. Article 15 of the EU’s 2018 General Data Protection Regulation (GDPR) mandates that individuals have electronic access to a copy of their personal data, and all major digital platforms now comply with this law by providing users with “data download packages” (DDPs). Through voluntary donation of DDPs, all data collected by public and private entities during the course of citizens’ digital life can be obtained and analyzed to answer social-scientific questions – with consent. Thus, consented DDPs open the way for vast new research opportunities. However, while this entirely new method of data collection will undoubtedly gain popularity in the coming years, it also comes with its own questions of representativeness and measurement quality, which are often evaluated systematically by means of an error framework. Therefore, in this paper we provide a blueprint for digital trace data collection using DDPs, and devise a “total error framework” for such projects. Our error framework for digital trace data collection through data donation is intended to facilitate high quality social-scientific investigations using DDPs while critically reflecting its unique methodological challenges and sources of error. In addition, we provide a quality control checklist to guide researchers in leveraging the vast opportunities afforded by this new mode of investigation.
1 Introduction
Digital traces left by citizens during the natural course of modern life hold an enormous potential for social-scientific discoveries [57], because they can measure aspects of our social life that are difficult or impossible to measure by more traditional means [79]. For example, classic sociological theory describes citizens’ interactions [31], but large-scale data on such interactions are only now becoming available from digital platforms [101, e.g.]. Similarly, experiments show that news reports can produce different opinions depending on the consumer’s political motivations [22, e.g.], but only through digital media we can now observe the simultaneous dynamics of consumed (mis)information, motivation, and opinion. With increased datafication and digitalization of our societies, the study of digital traces gains even more relevance. As more and more of our social lives happens on platforms, the digital traces we leave behind on those platforms become an important object of study [77]. Further examples of digital traces’ potential abound, and indeed, digital trace data collected through Application Programming Interfaces (APIs) and web scraping have been used in many applications, including network analysis from mobile phone data [19]; price indexing from online shop prices [33]; political opinion and electoral success prediction from Twitter data [91, 53]; and personality profiling from Facebook “likes” ([60]; see also [93] for an overview of similar studies).
In recent times, however, the faucet of social science data from APIs and web scraping has been decisively turned off by the relevant tech companies [26, 80, 41]. Through mutual agreement and negotiation between academia and industry, new efforts to make such data available to social scientists are underway, for example through “Social Science One” [58]. These data are now becoming available in aggregated form under strict privacy protections [36, 70]. While this new collaborative model is useful for social-scientific investigation of certain research questions, it does not fit all purposes mentioned above and has raised concerns about the role of platforms (for an overview, see [47]). First, by their very definition, the imposed data protection regulations ensure these data cannot address questions of individual (user-level) dynamics or networks [76]. Second, APIs provide public data only; much of digital trace data’s putative power, however, lies in private data that is too sensitive to share, such as location history, browsing history, or private messaging [83]. Third, the available data generally pertain to a nonrandom subset of the digital platform’s user group (e.g. Facebook or Twitter) which is not representative of many populations of social-scientific interest [69, 81]. Fourth, for both approaches, the researcher is entirely dependent on the private company that holds the data; sudden retractions of this collaborative spirit can, and have, occurred, posing a risk to the research process [26]. In addition. there is no possibility to independently verify that the data is complete and checked for measurement errors. Finally, even when a data processing company decides to share data for scientific purposes, the citizens who actually generated those data are generally impossible to contact for their consent, in some cases putting a firm legal basis for further data analysis in question (for example, following article 6, EU General Data Protection Regulation, or similar laws in other jurisdictions). Issues two and three regarding private data and nonrandom subsets can be overcome by collecting data via the installation of a tracker, plugin or app, such as performed by [4, 84, 46, 5] and [89].
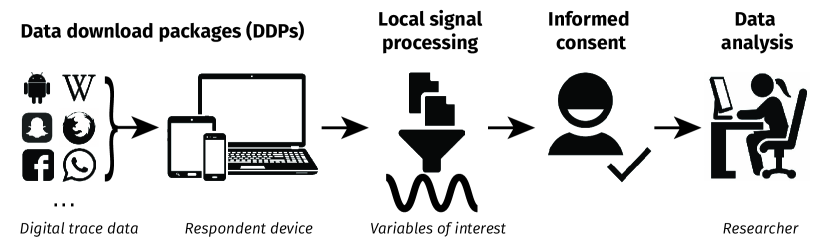
In this paper, we present an alternative workflow to collect and analyze digital traces, based on data download packages (DDPs). As of May 2018, any entity, public or private, that processes the personal data of citizens of the European Union is legally obligated by the EU General Data Protection Regulation [40, GDPR] to provide that data to the data subject upon request, and in digital format (GDPR Article 15; [7]). Most major private data processing entities, comprising social media platforms as well as smartphone systems, search engines, photo storage, e-mail, banks, energy providers, and online shops comply with this right to data access by providing DDPs to the data subjects. To our knowledge, most large companies that operate internationally provide the same service to their users outside European Union. Our proposed workflow consists of five steps (see Figure 1). First, data subjects are recruited as respondents using standard survey sampling techniques [104] and the researcher determines which DDPs are relevant for the particular research question under investigation. Second, respondents request their DDPs with the various selected providers, storing these locally on their own device. Third, stored DDPs can then be locally processed to extract relevant research variables, after which consent is requested of the respondent (step four) to send these derived variables to the researcher for analysis (step five). To aid researchers in planning, executing, and evaluating studies that leverage the richness of DDPs, we discuss the steps involved our proposed workflow. The short explanation of our proposed workflow already illustrates that in this process, decision should be made regarding both measurements and representation. In such cases, traditional survey research has benefited greatly from the “total survey error” framework [43]; here we therefore present DDP data collection in a “total error” framework [15] adapted specifically to this new mode of data collection [2, see also].
The aim of this paper is to introduce and discuss the idea of data donation for scientific research. As processing DDPs in such a way that high quality research can be performed is complex and challenging, a total error framework is introduced to guide researchers through this process. We first briefly discuss the right of access in the GDPR in the next section. We then present an example research question that might be addressed using Instagram DDPs collected from Dutch adolescents in the “Adolescents, Well-being & Social Media” (AWeSome) study [12]. Subsequently we present our total error framework for DDPs, and discuss the steps involved in answering such a research question in the context of this framework. Finally, we discuss limitations of our approach, as well as future directions for methodological investigation. Appendix A provides a ready-to-use checklist as a guideline for researchers evaluating or conducting DDP studies.
2 The right of access in the GDPR
In recent years, jurisdictions around the world have enacted or are in the process of enacting new data protection legislation. Examples outside the EU include the 2017 Japanese Amended Act on the Protection of Personal Information (AAPI 2016), the 2020 Brazilian General Data Protection Law (LGDP 13.709/2018), the 2020 California Consumer Privacy Act (375/2018), the 2019 New York SHIELD act (S5575B/2019), and the proposed Personal Data Protection Bill (PDP Bill 2019) in India. Many of these laws have been designed specifically for their compatibility with the European Union’s wide-reaching data protection legislation [100, 96], the General Data Protection Regulation (GDPR), which has applied across the EU and the UK since May of 2018. Together, these jurisdictions alone comprise about 2.2 billion people, over a quarter of the world’s population.
The GDPR grants all natural persons (“data subjects”), whatever their nationality or residence, certain rights regarding their “personal data” with respect to “data controllers”, such as tech companies, governments, mobile phone providers, etc. Although the GDPR is currently likely best known among data analysts for restricting what data controllers can do with personal data, the GDPR also grants data subjects the right of access (Article 15). This entails “the right to obtain from the controller confirmation as to whether or not personal data concerning him or her are being processed, and, where that is the case, access to the personal data…” (Article 15.1; emphasis added). Note that Article 15 also enables access to information regarding data recipients and sources, retention periods and data derived from your personal data. Article 15.3 further specifies the obligation for controllers to provide a copy of personal data, requiring them to do so “in a commonly used electronic form” whenever the data subject made their request by electronic means. The GDPR further grants the right to data portability in the closely related article 20, which states: “The data subject shall have the right to receive the personal data concerning him or her, which he or she has provided to a controller, in a structured, commonly used and machine-readable format and have the right to transmit those data to another controller without hindrance from the controller to which the personal data have been provided”.
In practice, most large “data controllers” currently comply with the right of access to one’s personal data and the right to data portability by providing users with the option to retrieve an electronic “data download package” (DDP). For example, at the moment of writing, Google provides a “takeout” option111https://support.google.com/accounts/answer/3024190, and Facebook222https://www.facebook.com/help/1701730696756992, WhatsApp333https://faq.whatsapp.com/general/account-and-profile/how-to-request-your-account-information/, Instagram444https://help.instagram.com/181231772500920?helpref, Uber555https://help.uber.com/riders/article/request-a-copy-of-your-uber-data?nodeId=2c86900d-8408-4bac-b92a-956d793acd11, Apple666https://privacy.apple.com/, Netflix777https://www.netflix.com/account/getmyinfo, and Microsoft888https://support.microsoft.com/en-us/help/4468251/microsoft-account-view-your-data-on-the-privacy-dashboard provide similar tools. Compliance with the right of data portability has sometimes been less straightforward for other data-controllers [109]. To our knowledge, with the exception of WeChat, none of the large global data controllers limit use of these tools to the European Union. Indeed, all other legislation mentioned above – including the California Consumer Privacy Act – grant some right of access, though often more limited than that found in the GDPR. Pursuant to GDPR article 20, data controllers cannot arbitrarily limit the data they provide in this package, or prevent their users from sharing its contents with third parties, such as social scientists. Third parties may freely process such packages, for example for scientific purposes, on the basis of user consent (articles 20 and 6). The right of access is limited in that it cannot be invoked to infringe on the rights or freedoms of others, particularly on other natural persons’ data protection rights, or on trade secrets; thus, the provided data should not a priori include personal data pertaining to other people [107]. For example, Facebook’s data download packages do not include information on the user’s “friends” (only the interactions these “friends” have with the data subject), nor does it provide details regarding Facebook’s proprietary algorithms. In this sense, data included in DDPs are limited. Furthermore, in keeping with other rights granted by the GDPR, data subjects may also request deletion of their own data.
In spite of the limitations of the right of access, a wealth of information is contained in data download packages offered as its direct consequence. At the time of writing it appears likely that a large proportion of persons globally who use a smartphone or the internet will have some data in their DDPs. In the following section, we discuss how this fact can be leveraged for novel social-scientific research, as well as the pitfalls and errors that must be controlled along the way.
3 Using data-download packages (DDPs) for scientific research
To illustrate the considerations relevant when using DDPs for social-scientific research and thereby showing it potential, we will take the example of one hypothetical research question that may be of interest to social scientists, and that we think could be answered using DDP collection. However, many other research questions can very well be answered by using DDP collection. For example research questions recently investigated using APIs and webscraping, such as the previously discussed network analysis from mobile phone data [19], price indexing from online shop prices [33], political opinion and electoral success prediction from Twitter data [91, 53], and personality profiling from Facebook “likes” ([60] can be investigated while being more explicit regarding the generalizability of the findings. Alternatively, research questions typically investigated using surveys, such as energy consumption [45], time spent [39] or budget research [25] can be executed without suffering from issues such as recall bias or bias due to social desirability.
Our exemplary research question is inspired by the “Adolescents, Well-being & Social Media” (AWeSome) project [12]. In a first study, adolescents (ages 14–15) in Dutch classrooms, as well as their parents and teachers, were approached by the researchers to participate in a series of surveys. Study participants were asked to answer a single survey question regarding their well-being six times per day on their mobile phone for a week. In addition, at a separate occasion they were asked to complete a survey regarding their use of WhatsApp and Instagram; in this small study, it appeared that Instagram was the most widespread social network. Furthermore, the use of self-reporting of well-being in this study may be a limitation because of recall bias [12].
Here, we anticipate a larger follow-up study in which adolescents’ emotions are investigated using information obtained from their Instagram DDPs. For illustration purposes, we will work with a simple, descriptive, example research question:
Example RQ: How do emotions of Dutch adolescents differ when they are at home compared to when they are not?
To answer this question, we must obtain (1) the consent and participation of a larger group of Dutch adolescents and their parents, and (2) measurements of the participants’ emotions, as well as a measure of whether they are at home or not.
Here we will discuss the steps that would be required to obtain these data using DDPs. At each of these steps, errors can occur. In order to obtain useful answers to our research question, we must therefore take account of, and, where possible, control such errors. To enumerate the error sources associated with each step in a data collection, a highly convenient framework is the total error framework [52, 15]. In a total error framework, each step of the data collection process is described, together with the errors that might arise from that step. The final “total” error in the analysis or statistics produced is then a combination of the sequence of preceding errors. The concept of “total error” arose from the survey methodology literature [43], where “total survey error” (TSE) is the standard framework for designing, evaluating, and optimizing data collection [16, 13]. [2] extended this framework to generic “big data” studies, [92] extended this framework to digital trace data and [9] extended the framework to sensor data.
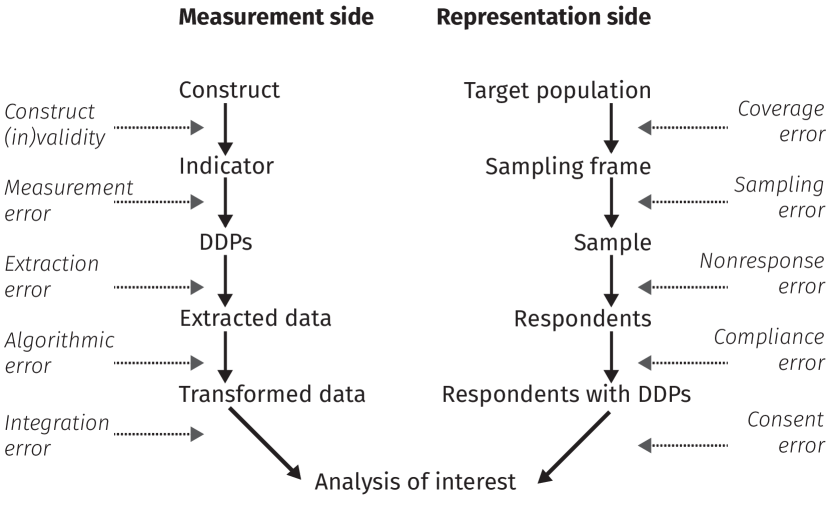
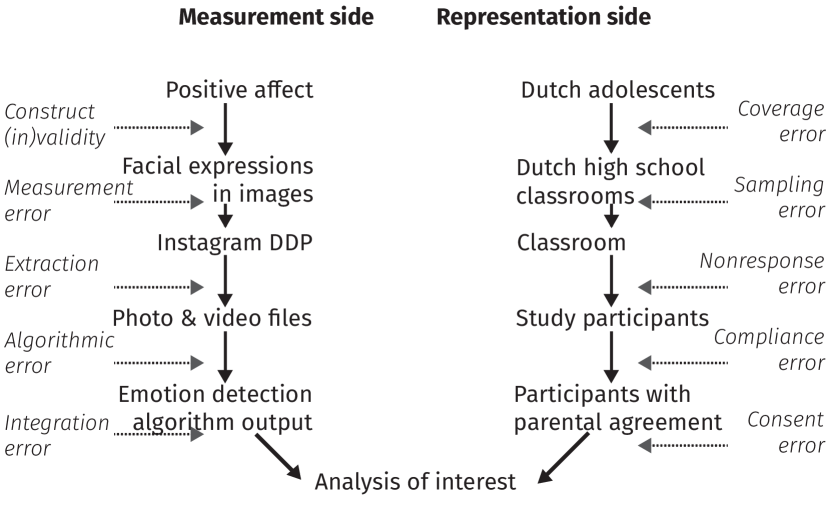
Here, we aim to aid future researchers in performing high-quality studies using DDPs by presenting a total error framework targeted specifically at DDP collection. Figure 2 presents a generic overview of our framework. In addition, Figure 3 applies the framework from Figure 2 to our example research question above. As shown in Figures 2 and 3, and following the standard TSE formulation, data collection consists of a “measurement side” and a “representation side”. The measurement side deals with the extent to which the construct of theoretical interest is adequately measured by the procedure performed in the study. In a survey, this amounts to the extent to which answers to a survey question correspond to the construct of interest (e.g. well-being). With DDP collection, several additional steps are necessary, including definition of the construct, routine registration in the DDP, and extraction and transformation of the DDP into a variable to be analyzed. On the representation side, as with a standard survey, a population must defined, a sampling frame obtained, and respondents invited to participate. With DDP collection, additional steps are involved, which will lead to further respondent attrition.
The following describes the steps of the framework in more detail. Throughout, we refer to Figure 2 and our hypothetical example illustrated (in part) by Figure 3.
3.1 Measurement side
3.1.1 Construct
On the measurement side of the framework, the first step is to consider how the constructs (concepts) of interest can potentially be measured using indicators (proxies) found in DDPs. Following our example, it would appear reasonable to presume that it is possible to determine whether a person is at home using location data, and indeed [39] showed that this can be done relatively reliably. Similarly, the existence of the field of “affective computing” suggests it may be possible to determine a person’s emotions from their facial expressions in photos and videos [34, 55, 63].
At this stage, errors can occur due to a mismatch between the chosen concept and the chosen indicator. For example, Instagram is often described as a “storytelling” device to assert the user’s desired identity in contrast to the user’s true identity [68, e.g.]. In other words, Instagram photos and videos are likely to measure how adolescents wish to be seen by others – a construct that, as attested by popular culture, centuries of literature, and many readers’ personal experience, may differ from their genuine emotional state.
Construct error is especially important since it enters at the very first step of measurement and has the potential to invalidate all downstream efforts unless controlled [87]. Methods of controlling construct error might include: careful elaboration of the theory underlying the research question, expert evaluation of the proposed indicator, and “triangulation” [71] – for example, comparison of research results between DDP and other types of measurement, or simultaneous DDP-survey measurement followed by multitrait-multimethod modeling [75, 85]. Because construct validity is such a crucial issue, we would suggest that simultaneous measurement using a combination of sources, including DDPs, is advisable; this idea is in line with similar advice given by [52] and [59]. Our proposed workflow foresees in this need explicitly, by embedding the DDP collection step within a larger, more traditional, survey data collection effort.
3.1.2 Indicator
Once the researcher has identified valid indicators for the construct(s) of interest, the next step is to determine from which “data controller(s)” the DDP(s) is/are most useful to answer the research question. For our example research question, we are interested in whether adolescents feel different emotions when they are at home compared to when they are not. As individuals typically switch locations multiple times a day, a DDP that registers location only once a day would not be sufficient to make the distinction we are interested in. The location history listed in the Instagram DDP only logs a location when it is selected by the user while sharing media on the “timeline” or in the “stories” [67] and would therefore not be sufficiently dense to appropriately distinguish between being home or not for every location the respondent visits throughout a day. Alternatively, Google Location History passively logs visited locations by combining internal phone GPS with connected WiFi devices and cell towers [86] and is therefore much more appropriate for the research question under evaluation. In terms of measuring emotions via social platforms [61], adolescents frequently use Instagram [103], where emotions can be shared through both images and text [23], which can be shared both publicly and privately.
At this stage, errors can occur when the measurements collected in the DDP diverge for some reason from what they intend to measure. For example, when satellites are temporarily out of order [3], the measurements logged in Google Location History might diverge more from the user’s true location.
Measurement error is particularly relevant because all measurements can be prone to error [24] and it can distort all relationships under evaluation [16]. A way to control for measurement error is by collecting multiple independent measurements of the construct of interest and investigate the variance of these measurements [28] or their correlations [18]. Furthermore, these independent measurements can be used to estimate the unobserved “true” variable [14]. In practice, this can be accounted for similarly as construct error, namely to supplement DDPs with survey measurements. In addition, measurement and construct error can be simultaneously estimated and accounted for using the previously discussed multitrait-multimethod modeling [75]. To investigate positive affect using images in Instagram DDPs, a way to account for measurement error here can be to measure facial expression from other sources, such as self reports, sharing of selfies through ESM or using another DDP. The information extracted from these different sources can then be used as indicators of the construct of interest by means of a latent variable model.
3.1.3 DDPs
Once a specific set of DDPs has been chosen to answer the research question of interest, the next step is to think more specifically which files of these DDPs are essential and how these relevant files are going to be extracted from the DDPs. For our example research question, we are interested in determining the emotional expressions of faces on images. The extraction step here would be to identify all images in the Instagram DDP.
Extraction error occurs when errors are made by the extraction algorithm, the image detection algorithm for example. A simple example of such an error is when the image detection algorithm only selects files with a .jpg extension, while the DDP of interest also contains images with a .png extension. Another example of this type of error is that images might be stored under different directories, and some are systematically missed. Moreover, controllers might also differentiate in their responses over time/location as well as file formats/structures[6]. To minimize the possibility of extraction error, researchers should extensively investigate the content of the DDPs of interest, and how the structures and data type might differ over different users.
3.1.4 Extracted data
Once the relevant files have been extracted, an algorithm can be applied transforming the extracted files into data that can be used to answer the research question. In some cases, this step is very simple as data can be extracted from the files directly without further processing. For example, if the researcher is merely interested in seeing how often a person is home, this information is directly available in Google DDPs, at the time of writing in the file ”Location History.json”. However, even with direct measures such as these, some degree of transformation might be needed; for example, as Google is not always certain of a person’s location, multiple semantic locations are typically listed with corresponding probabilities. A predefined transformation rule can for example select the semantic location with the highest probability and the transformed data only contains these selected locations. A more complex set of transformations may also be needed, for example in the form of a pretrained supervised prediction model. Following the example, a face detection algorithm [49, 50] followed by an emotional expression detection algorithm could be applied to the images in the Instagram DDP, for example using pretrained models or by models further developed my means of transfer learning, such as by [54].
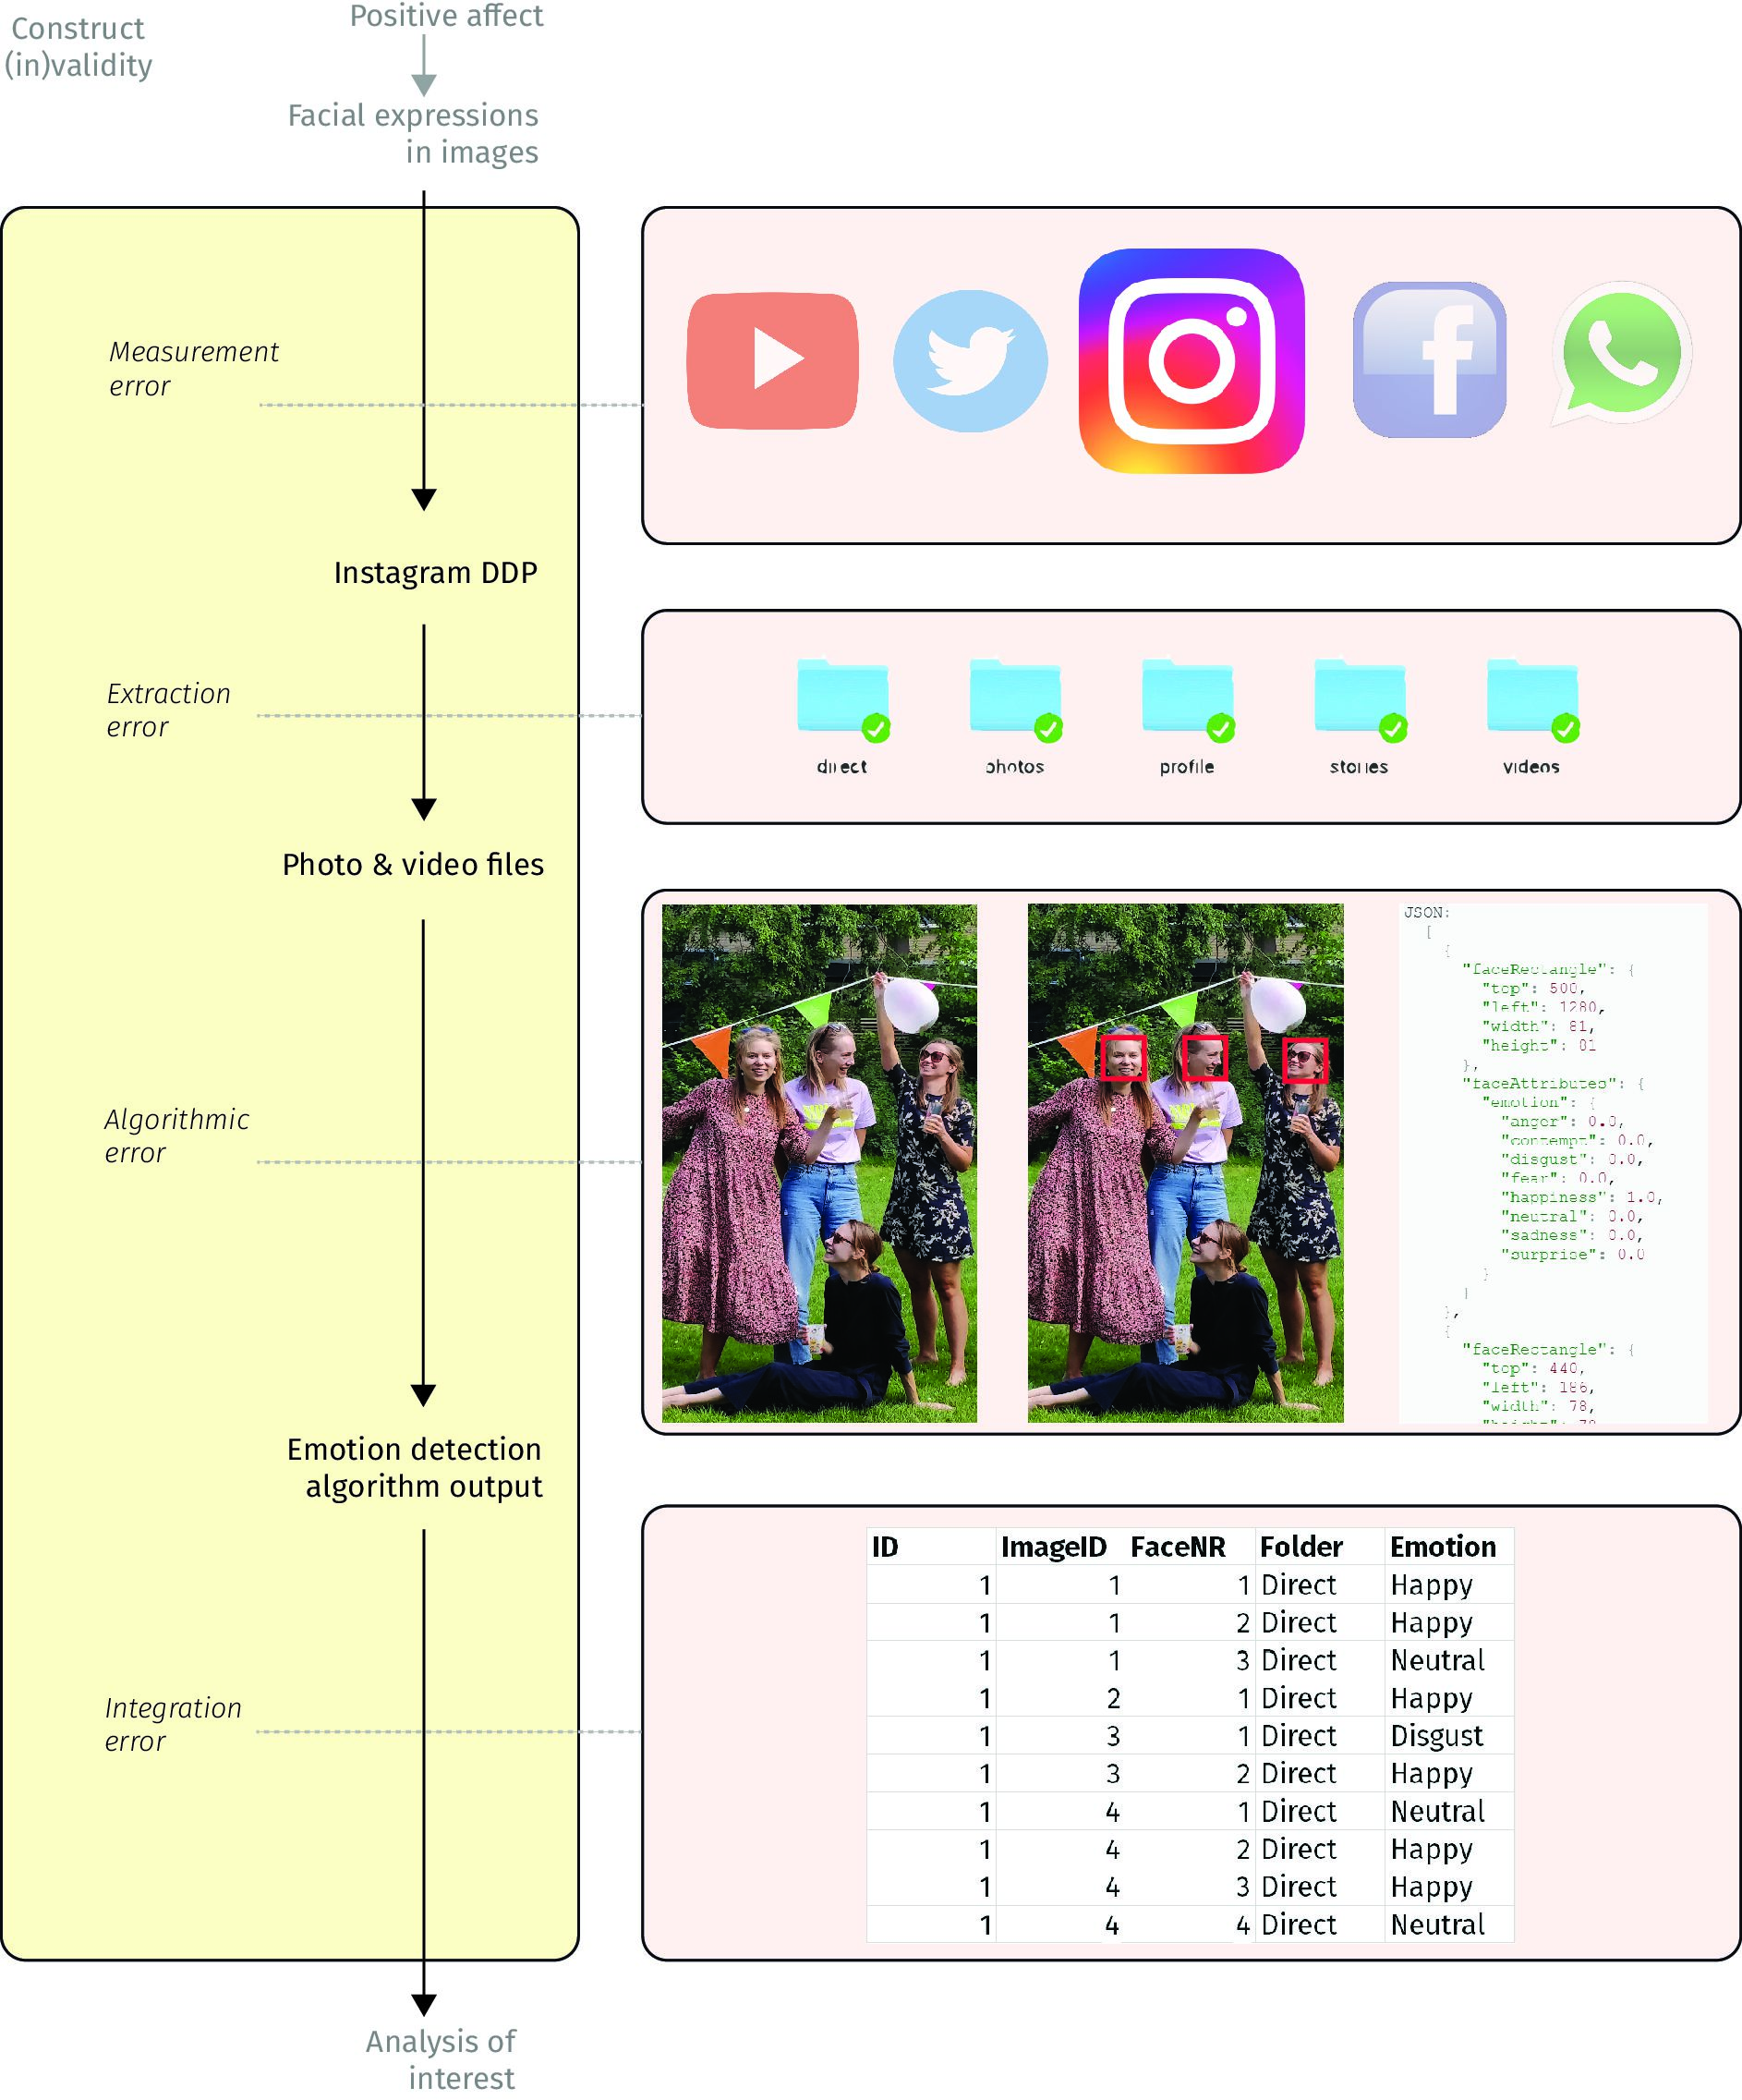
Algorithmic error occurs when errors are made while generating transformed data from the extracted DDP files. When classifying emotions from faces, algorithmic error can be due to a face not being detected (as can be seen in Figure 4, a face incorrectly being detected, an incorrect emotional classification, or because the algorithmic uncertainty is lost once a classification is made. In other words, algorithmic error is the typical classification or prediction error in predicting social variables using found data, which is the focus of a large body of literature [60, 19, 53, 93, 39]. In line with our exemplary research question, research has also illustrated that algorithmic error can influence outcomes of computer vision algorithms [27]. In the current work, we emphasize that, while this type of error is certainly important, it constitutes only one type of error within the total error framework. In other words, the “ground truth” employed by supervised modeling exercises is, within our framework, an error-prone and potentially partially invalid proxy of the concept of interest.
Algorithmic error in the current framework is essentially prediction error on an (error-prone) measure of some socially relevant variable. As such, it is among the most studied errors within the framework at the time of writing. As emphasized in every basic textbook on machine learning, a proper evaluation of the likely amount of error is key, and can be accomplished by separating training and test observations, whether this is using data splits or resampling techniques [17, 72, 10]. When applying pretrained models as an extraction method, the researcher should ideally evaluate whether the error incurred within the DDP dataset at hand is indeed similar to that within the test set of the original model. For example, the type of photographs taken by teenagers might be different from standard benchmark datasets on which image recognition models were trained. Obtaining an accurate estimate of the algorithmic error rate also makes it possible to handle downstream decisions more adequately, by using standard measurement error models. For example, when we know that a classification model has a 90% sensitivity and 75% specificity, a simple table of predicted counts from this model can be corrected by multiplying it by the inverse of a matrix with these rates on the diagonal [20, 8]. However, the difficulty of obtaining appropriate estimates of algorithmic errors should not be underestimated, particularly if pre-trained models are used for which training occurred using a different data-set.
3.1.5 Transformed data
After the transformed data files from all respondents are received and safely stored by the researcher, an integrated dataset can be generated containing data from all respondents, and linking the measurements received from possibly multiple DDPs to, for example, survey outcomes. As typically measurements at different time-points are collected through DDPs, attention should be paid to appropriately integrating the multiple datasets by linking on both person and time level [48, 110]. For our example research question, we should link the collected emotions to collected locations on time-level per person.
While linking the multiple sources on subject level and linking the subjects, integration error can occur [56], for example when time-stamps are not appropriately matched or when information collected from multiple sources is not appropriately linked on subject level [35]. Such errors can be prevented to an extent by creating software tests and other checks [73] at every stage of the linkage process that create reports which can be compared with sensible expectations. For example, the time period should not suddenly extend into unseen years, outliers should be detected, etc. In addition, the procedures used should be computationally reproducible, so that any errors can be detected in the future and easily corrected [99, 98].
See Figure 4 for a visual representation of how errors can affect outcomes on the measurement side of the framework. In addition, see the first part of Appendix A for guidance on how severe bias due to measurement errors can be prevented.
3.2 Representation side
3.2.1 Target population
On the representation side, researchers have in mind to what population their results should be generalized, a target population. For the example research question, the target population is Dutch adolescents. Furthermore, researchers investigate how a sample or participants can be selected from that target population, this is the sampling frame. If your target population is Dutch adolescents, it can be infeasible to randomly select a set of respondents out of that complete population directly. A practical approach can be to first select a sample of high schools and then select a number of adolescents here. Such a sampling scheme is known as clustered sampling [64, 11].
The discrepancy between the target population and the sampling frame is denoted as (under)coverage error, as certain subgroups are not covered by the sampling frame. Coverage error can result in the problem that the obtained results cannot be generalized to the population of interest. For example, when Dutch high schools are used for the sampling frame, the subgroup of adolescents not going to high school have no probability of being included in the sample and obtained results can therefore not be generalized to Dutch adolescents, but only to Dutch adolescents going to high school. A solution can be to use multiple sampling frames [65].
3.2.2 Sampling frame
When the sampling frame has been determined, the sample can be selected using traditional sampling theory [30], for example a simple random sample can be selected by randomly selecting a number of adolescents from the high school registers and invite them to participate in the research. Alternatively, using strata or clusters can be more convenient here, for example to first select a number of high schools and approach a sample of adolescents via these schools.
Failing to select a representative sample results in sampling error, failure to generalize results to the target population. Many large studies use model-based approaches [29], combining several stages of stratification and clustering to minimize sampling error [32]. Alternatively, adaptive designs can be used to minimize sampling error [11] and to for example increase the sampling probability for certain subgroups if their response rate is relatively low. Stratification has also been listed by [52] as an important contribution to the goal of generalizability in big data research.
3.2.3 Sample
Once the sample has been determined, its members can be invited to participate in the research. As with any type of research, part of the sampled subjects will not or only partly respond. This can be due to multiple reasons. First, the subject is not willing to participate at all. Second, the subject is willing to participate in the overall project, but is not willing to provide her DDP. Third, the subject is willing to participate, but does not use the platform from which the DDP is requested.
Regardless of the reason for not participating in the research, this will lead to nonresponse error an can lead to bias in results [44]. To minimize bias caused by respondents not willing to participate or only willing to partly participate, it is recommended to accompany data-download research with questionnaires. This provides the researcher with substantive information regarding the non-responders in terms of data-download packages. When viewed as a missing data problem, this means that once more information is known about the non-respondents, the likelihood increases that the Missingness is At Random (MAR), as variables are observed through which the missingness can be explained. This is in contrast to a situation when nothing is known about the nonrespondents, so that the missingness cannot be explained (Missing Not At Random, MNAR) [88]. When the missingness can be explained, it can be accounted for by method such as multiple imputation or weighting [21]. To minimize the number of respondents that are willing to participate but to not use the platform under investigation, the researcher should also focus on how often the target population makes use of the platform under investigation when determining which platform to use for research. When considering the example research question, existing research showed that YouTube, WhatsApp, Instagram and Snapchat were used most frequently by adolescents in 2019 [106]. Furthermore, Android had a market share of 86.1% in 2017 [1].
3.2.4 Respondents
If a respondent decides to participate in the research, she still needs to work through a process of multiple stages. The packages should be requested and downloaded. A piece of software should be installed and the packages should be opened and processed with this software, as can be seen in Figure 1. Next, the output is generated by the software and the respondent determines whether she is willing to share this output with the researcher and, if so, actually approve the sharing.
These steps are not straightforward. Therefore, clear guidelines, reminders and assistance are required to guide the respondents through this process [94]. Some attrition is likely to occur due to the fact that respondents are not willing or able to invest the time and effort in this procedure, resulting in compliance error. For example, when a respondent requests her Instagram DDP, it typically takes several hours to days for Instagram to prepare this DDP, so the respondent needs to reserve multiple moments throughout several days to successfully participate in this research, and the researchers should probably build in several reminders throughout this process to nudge the respondent into successfully completing the process. Furthermore, by processing and visualizing locally, the respondent has control over the data and is truly informed.
3.2.5 Respondents with DDPs
Once the respondent complied with all the steps required to complete the process, the transformed data is collected in a file. For our example research question, a respondent will for example review a csv file containing timestamps, classified emotions and supplementary information describing whether it was text or an image that was classified (as can be seen at the bottom of Figure 4.
This file should be reviewed by the respondent in order to give informed consent regarding sharing this information with the researchers. If the respondent decides to not or only partly share this file, this results in consent error. Consent error may be substantial, and could be related to topics of interest measured within the DDPs. Without any further information about the respondent, for example for a survey, this would lead to missingness “not at random” [88, MNAR;], which is difficult to account for. With information from surveys or other sources, it may be reasonable to assume the missingness is “at random” (MAR), especially when survey variables are strongly related to the study outcomes.
“Local signal processing” may alleviate the consent error considerably. First, local processing will allow researchers to avoid requesting sensitive information, perhaps making respondents more willing to share [95]. For example, respondents could be more likely to give consent to share the datum of “looking unhappy” in a photograph than sharing all their private images. Second, the respondent can see that the only information that is requested is directly related to their interaction with the researcher: a scientific study. Most adolescents will intuit that, to study well-being, the researcher does not need to know their study habits, for instance. In other words, local signal processing is designed to comply with key data protection principles such as ‘data minimization’ and ‘data protection by design’ as well as more generally preserve the interaction’s “contextual integrity” [74]. Some studies have suggested that preserving contextual integrity can help improve consent [51].
Once the integrated data-set is finalized, it can be used to perform the final analyses to answer the research question of interest. For example, the researcher can investigate what type of emotions are more often detected while being at home and while being at other locations, and it can be investigated how these differences in emotional outings differ within and between persons.
See the second part of Appendix A for guidance on how severe bias due to representation errors can be prevented.
4 Discussion
Data-download packages (DDPs) allow us to study known phenomena in a novel manner, or even to study new social phenomena. Using DDPs for scientific research is attractive for multiple reasons. First, the existence of DDPs, and the right of the data subject to pass on information to social scientists, is guaranteed by EU law. Second, participants can easily investigate the data they share to give informed consent. Third, by starting off with a traditional random sample, the approach suggested in this paper allows researchers to generalize to populations of interest more easily than could be achieved with “found samples”. This approach also allows for longitudinal data collection in parallel with the DDPs. More generally, fourth, DDPs do not only provide a very diverse set of available digital traces, but they can also easily be combined with other data, such as other DDPs, surveys, register data, and so forth. Finally, the approach suggested in this paper allows for experimental designs using digital trace outcomes, but under the same scrutiny as regular social-scientific experiments and with true informed consent that respects the contextual integrity of the research-participant interaction.
Of course, use of DDPs is also challenging. We have focused on summarizing some of the challenges to inference within our error framework, and hope this framework can serve as a guide to preventing errors where possible, and mitigating their effects otherwise. At the same time, the suggested approach also has several drawbacks that are unrelated to inference per se.
First, researchers should have good faith in not only respondents, but also in data controllers, as both have the opportunity to omit data during the process. Data controllers can fail to provide respondents their complete DDPs, and respondents can choose to remove parts of the DDP they are not willing to share with the researcher. As data not shared with the researcher can differ from shared data, this can bias results. A second challenge is that the world of DDPs changes rapidly. The structure and content changes continuously and individuals can be triggered to delete their own packages making them useless as research subjects. A third challenge is that, to safeguard participants’ privacy and for scientists to comply with data protection requirements themselves, most research infrastructure should be set up in advance. For example, it should be clear which parts of which data-download packages are selected and an algorithm should be prepared to make transformations to a pre-defined format. A fourth disadvantage is that available and free pre-trained algorithms are not always available for the specific research purposes, requiring the researcher to collect raw data and train an algorithm. Fifth, digital skills of participants are a major challenge. To address them an easy to use front end of the data collection tool is key. A sixth challenge is that data-download packages are not consistently formatted over different data controllers. For example, there are already many ways to provide timestamps [38] so software should be adjusted to appropriately handle such differences. A seventh challenge is that a DDP itself is not formatted as a typical data set with respondents as rows and variables as columns. Instead, it typically comes as a zip file containing json files, images and videos, and processing should take place in order for it to be used for statistical analyses. A last challenge is that conducting research of this type should be carried out by a multidisciplinary team of social scientists, data scientists, computer scientists and data management experts.
Researchers can minimize the influence of issues such as the rapidly changing environment of DDPs and the inconsistency in DDPs by focussing their processes on structural characteristics such as for example usernames and timestamps. Issues such as setting up the infrastructure in advance and training algorithms without access to the complete data have been overcome before [66], however ensuring that the usability of such infrastructures meets the level of digital skills of the participant remains an important challenge here. For challenges regarding data protection, informed consent, reproducibility and replicability, extensive research has been performed and guidelines have been developed on which we reflect in the following subsections.
4.1 Data protection and informed consent
Before a DDP of a respondent is shared, it is unknown what kind of information the package exactly contains. Social researchers will only be interested in the specific parts of the DDP that help to answer their research question, but a DDP possibly contains sensitive personal information. By using distributed local computation at the respondent’s device to extract only the relevant information, it can be prevented that a researcher stores sensitive information. For example, an Instagram DDP can contain sensitive images. The researcher is not interested in the sensitive content, but in the emotional expressions of the faces on these images. Therefore, an emotional detection algorithm could be run locally and only the classifications of the emotional expressions are shared with the researcher.
During this privacy preserving transformation step, three aspects should be carefully considered. First, respondents store their DDPs locally on a device. After participating, respondents should be informed of this and should have the option to either preserve the packages under their own responsibility, or to permanently delete the packages from the device in use. Second, to maximize informed consent, respondents should be shown an example illustrating what information is extracted from the data-download package. In the case of transforming faces on pictures into classifications of emotional expressions, the example should show a picture as input and the classifications of emotional expressions per detected face at output, as can be seen in Figure 4. Such an example makes clear what information from the data-download package is shared with the researcher exactly. In addition, respondents should have access to output of the transformations applied to their own DDP to explicitly approve or reject sharing the transformations with the researcher. Existing research on successful informed consent can be consulted, see for example [62].
To ensure that sensitive information is not shared with the researcher and to ensure that the procedure of obtaining the transformed data occurs in a privacy preserving and ethical way, it is important that researchers consult ethical review boards of their universities in this process and obtain ethical approval for the research. Furthermore, researchers should consult data managers to develop a solid plan to receive the transformed data in a safe environment from the respondents and to generate an integrated database built with an architecture that can be accessed by the researchers, such as SURFsara in the Netherlands [90].
4.2 Reproducibility and replicability
Although reproducibility and replicability are essential for scientific research [78, 99], these criteria are challenging to meet when using DDPs [42]. The field of digital trace data in general is a rapidly changing environment [97], and this holds for DDPs as well. When using local computation, reproducibility may only be feasible on the level of the transformed data received by the researchers, not on the raw DDPs, as they were never in the possession of the researcher in the first place.
To support replicability, tools and analysis code should depend on structures specific for particular data controllers as little as possible, and should be easily updatable and extendable as structures of DDPs from specific data controllers will inevitably change. To help achieve this goal, the highest standards of software engineering for architecture design, testing, documentation, version control and support should be applied and software engineers should be involved during all stages of the process [73]. In addition, FAIR principles [108] should be used for data archiving, documentation and long-term storage. As these go beyond the expertise of most social scientists, Research Data Management Offices should be involved or at least consulted, see for example [102]. Frameworks such as differential privacy [37] are relevant to guarantee reuse.
5 Conclusion
If researchers interested in using DDPs for scientific research follow the proposed workflow, improvements can be made regarding generalizability of findings. This holds for the exemplary research question discussed, but also for example for the research questions discussed in the introduction such as the network analysis from mobile phone data [19], price indexing from online shops [33], political opinion and electoral success prediction from Twitter data [91, 53], and personality profiling from Facebook “likes” ([60]. Furthermore, research questions typically investigated using surveys can be executed without suffering from issues such as recall bias or bias due to social desirability, such as the examples discussed in the introduction regarding such as energy consumption [45] time spent [39] or budget research [25].
To summarize, it is clear that our proposal is no silver bullet for solving all problems associated with modern social science. In spite of these challenges, however, we believe that leveraging the advantages of DDP collection can become an important tool in the social scientist’s arsenal.
Appendix A Checklist for social scientific research using Data Download Packages
Measurement side
(determine per construct separately)
Construct
-
The construct of interest is clearly defined
-
The construct of interest matches the scope of the research
Indicator(s)
-
All aspects of the construct can be sufficiently represented through observable indicators (proxies)
-
The indicators can be measured by data controllers
DDPs
-
Data controllers are selected in which the indicators of interest are measured
-
The denseness of the measured indicators matches the research purpose
-
The credibility of the data controller is positively evaluated
-
The number of different data controllers is minimized to reduce response burden
Extracted data
-
Presence of the indicator is evaluated for all file formats present in the DDP
-
Relevant files are extracted using validated scripts with known accuracy rates
Transformed data
-
A transformation method is selected that extracts the outcome values for each indicator
-
The transformation method is trained on a sample similar to the data collected by means of DDPs
-
The transformation method has a known accuracy rate estimated on a comparable data-set
-
The transformation method does not systematically include, exclude or misclassifies specific (identifiable) cases
-
The outcome values sufficiently represent all indicators identified
Analysis of interest
-
The shared data is linked on person level, such that different sets of transformed data are represented by different columns in one data-set
-
Individual respondents can be clearly identified, for example by means of an anonymized identification number
-
The variables are clearly identified for each respondent
Representation side
Target population
-
A target population is identified that matches the research purpose
-
All identifiable subgroups can in theory be included in the study
Sampling frame
-
All identifiable subgroups of the target population are present in the sampling frame
-
Evaluate whether the available sampling frame matches the research purpose
Sample
-
All subgroups in the sampling frame have a probability to be included in the sample
-
All subgroups in the sampling frame have an equal or known probability to be included in the sample
Respondents
-
The communication towards the sample is clear and simple
-
Communication is possible in the respondent’s language
-
The procedure is explained in a step-by-step manner for informed consent at the start of the procedure
Respondent’s DDPs
-
The software’s usability has been validated on an independent validation sample
-
The software is available for different types of devices and different versions of operating systems
-
24 hour assistance is available during the data collection period
Analysis of interest
-
The respondents can see the final data-set containing the transformed data before it is shared with the researcher for informed consent
Appendix B Definitions
-
•
Personal data: Information relating to an identified or identifiable natural person [105] Data subject: The person that the personal data refer to Data processing entity / Data controller: The person or organization responsible for processing personal data. In this paper we refer to the online platforms providing data download packages as data controllers. However, note that as a researcher collecting DDPs, you are a data controller as well [105]
-
•
Data controller: The person or organization responsible for processing personal data. The controller decides which data will be processed, how and why [105].
-
•
Data download package (DDP): Because of the right of data access, data subjects are always allowed to retrieve their personal data from data controllers. Here, data controllers are obliged to comply with such a request and because of the right of data portability, provide the requested data in a machine readable format. To comply with these rules, social media platforms typically provide data subjects with a .zip file containing the personal data requested [105]
-
•
Consent: When data subject provide researchers their DDPs, consent should be provided. This means that the data subject confirms that the data provided given freely; that the data subject is informed regarding what data are shared exactly and how the data will be processed by the researcher. Consent can be provided via a written, electronic or oral statement [105]
-
•
Target population: The population to be investigated, and about which conclusions are to be drawn [11]
-
•
Sampling frame: A list, map, or other specification of units in the target population from which a sample of data subjects may be selected [32]
-
•
Sample: The set of data subjects within the sampling frame selected for participation in the research in practice
-
•
Respondents: Data subjects within the sample who complied with participation in the research
-
•
Responses: Data collected from the data subjects who complied with participation in the research
-
•
Construct: A conceptual variable that is known to exist but cannot be directly observed [82]
-
•
Indicator: Variables (constructed by means of measurement instruments) that aim to measure either the construct of interest or are closely related to the construct of interest
-
•
Transformation method: Algorithm that is used to transform the data obtained from the DDPs into features and classifications that can be used for further research
-
•
Transformed data: The features or classification extracted using transformation method which can be used for further research
-
•
Data integration: The theory and techniques used for data linkage and micro integration. Here, data linkage techniques vary from record linkage to statistical matching. Micro integration techniques vary from harmonization of measures in concept to actual adjustments of data [110].
References
- [1] Milad Taleby Ahvanooey, Qianmu Li, Mahdi Rabbani and Ahmed Raza Rajput “A survey on smartphones security: Software vulnerabilities, malware, and attacks” In arXiv preprint arXiv:2001.09406, 2020
- [2] Ashley Amaya, Paul P. Biemer and David Kinyon “Total Error in a Big Data World: Adapting the TSE Framework to Big Data” In Journal of Survey Statistics and Methodology 8.1, 2020, pp. 89–119 DOI: 10.1093/jssam/smz056
- [3] Constantin-Octavian Andrei, Jan Johansson, Hannu Koivula and Markku Poutanen “Signal performance analysis of the latest quartet of Galileo satellites during the first operational year” In 2020 International Conference on Localization and GNSS (ICL-GNSS), 2020, pp. 1–6 IEEE
- [4] Sally Andrews, David A Ellis, Heather Shaw and Lukasz Piwek “Beyond self-report: tools to compare estimated and real-world smartphone use” In PloS one 10.10 Public Library of Science, 2015, pp. e0139004
- [5] Theo Araujo, Anke Wonneberger, Peter Neijens and Claes Vreese “How much time do you spend online? Understanding and improving the accuracy of self-reported measures of Internet use” In Communication Methods and Measures 11.3 Taylor & Francis, 2017, pp. 173–190
- [6] J Ausloos, M Veale and R Mahieu “Getting Data Subject Rights Right: A submission to the European Data Protection Board from international data rights academics, to inform regulatory guidance” In Journal of Intellectual Property, Information Technology and Electronic Commerce Law 10, 2019
- [7] Jef Ausloos “GDPR Transparency as a Research Method”, 2019 DOI: 10.2139/ssrn.3465680
- [8] E. Beauxis-Aussalet and L. Hardman “Extended Methods to Handle Classification Biases” In 2017 IEEE International Conference on Data Science and Advanced Analytics (DSAA), 2017, pp. 765–774
- [9] Lukas Beinhauer, Ger Snijkers and Jeldrik Bakker “Towards a total error framework for sensor and survey data” In BigSurv20, 2020
- [10] Yoshua Bengio, Ian Goodfellow and Aaron Courville “Deep learning” MA: MIT press, 2017
- [11] Jelke Bethlehem, Fannie Cobben and Barry Schouten “Handbook of nonresponse in household surveys” John Wiley & Sons, 2011
- [12] Ine Beyens et al. “The effect of social media on well-being differs from adolescent to adolescent” In Scientific Reports 10.1, 2020, pp. 10763 DOI: 10.1038/s41598-020-67727-7
- [13] Paul P. Biemer “Total Survey Error: Design, Implementation, and Evaluation” In Public Opinion Quarterly 74.5, 2010, pp. 817–848 DOI: 10.1093/poq/nfq058
- [14] Paul P. Biemer “Latent class analysis of survey error” John Wiley & Sons, 2011
- [15] Paul P. Biemer “Errors and Inference” In Big data and social science: A practical guide to methods and tools CRC press, 2016, pp. 266–297
- [16] Paul P. Biemer and Lars Lyberg “Introduction to survey quality”, Wiley series in survey methodology Hoboken, NJ: Wiley, 2003
- [17] Christopher M Bishop “Pattern recognition and machine learning” springer, 2006
- [18] J Martin Bland and Douglas G Altman “Measurement error and correlation coefficients.” In BMJ: British Medical Journal 313.7048 BMJ Publishing Group, 1996, pp. 41
- [19] Vincent D. Blondel, Adeline Decuyper and Gautier Krings “A survey of results on mobile phone datasets analysis” Number: 1 Publisher: SpringerOpen In EPJ Data Science 4.1, 2015, pp. 1–55 DOI: 10.1140/epjds/s13688-015-0046-0
- [20] Laura Boeschoten, Daniel L Oberski, Ton De Waal and Jeroen K Vermunt “Updating latent class imputations with external auxiliary variables” In Structural Equation Modeling: A Multidisciplinary Journal 25.5 Taylor & Francis, 2018, pp. 750–761
- [21] Laura Boeschoten, Gerko Vink and Joop JCM Hox “How to Obtain Valid Inference under Unit Nonresponse?” In Journal of Official Statistics 33.4 Sciendo, 2017, pp. 963–978
- [22] Toby Bolsen, James N. Druckman and Fay Lomax Cook “The Influence of Partisan Motivated Reasoning on Public Opinion” In Political Behavior 36.2, 2014, pp. 235–262 DOI: 10.1007/s11109-013-9238-0
- [23] Catherine Bouko “Emotions through texts and images: A multimodal analysis of reactions to the Brexit vote on Flickr” In Pragmatics 30.2 International Pragmatics Association (IPrA), 2020, pp. 222–246
- [24] Timo B Brakenhoff et al. “Measurement error is often neglected in medical literature: a systematic review” In Journal of clinical epidemiology 98 Elsevier, 2018, pp. 89–97
- [25] Koen Breedveld, Andries Van Den Broek and Frank Huysmans “Background to the methods used in the Time Budget Survey (TBO)” In Social and Cultural Planning Office of the Netherlands. Disponible en internet via: http://www. scp. nl/onderzoek/tbo/english/achtergronden/history. pdf Citeseer, 2002
- [26] Axel Bruns “After the ‘APIcalypse’: social media platforms and their fight against critical scholarly research” In Information, Communication & Society 22.11 Taylor & Francis, 2019, pp. 1544–1566
- [27] Joy Buolamwini and Timnit Gebru “Gender shades: Intersectional accuracy disparities in commercial gender classification” In Conference on fairness, accountability and transparency, 2018, pp. 77–91
- [28] Raymond J Carroll, David Ruppert, Leonard A Stefanski and Ciprian M Crainiceanu “Measurement error in nonlinear models: a modern perspective” CRC press, 2006
- [29] Ray L Chambers and Chris J Skinner “Analysis of survey data” John Wiley & Sons, 2003
- [30] William G Cochran “Sampling techniques” John Wiley & Sons, 2007
- [31] James Samuel Coleman “Foundations of social theory” Cambridge, Mass.: Belknap Press of Harvard Univ. Press, 1990
- [32] Edith D De Leeuw, Joop J Hox and Don A Dillman “International handbook of survey methodology.” Taylor & Francis Group/Lawrence Erlbaum Associates, 2008
- [33] Jan Haan and Rens Hendriks “Online data, fixed effects and the construction of high-frequency price indexes” In Economic Measurement Group Workshop, 2013, pp. 28–29
- [34] Hamdi Dibeklioğlu, Albert Ali Salah and Theo Gevers “Recognition of Genuine Smiles” In IEEE Transactions on Multimedia 17.3, 2015, pp. 279–294 DOI: 10.1109/TMM.2015.2394777
- [35] James C Doidge and Katie L Harron “Reflections on modern methods: linkage error bias” In International Journal of Epidemiology 48.6 Oxford University Press, 2019, pp. 2050–2060
- [36] Vito D’Orazio, James Honaker and Gary King “Differential Privacy for Social Science Inference” In SSRN Electronic Journal, 2015 DOI: 10.2139/ssrn.2676160
- [37] Cynthia Dwork “Differential privacy: A survey of results” In International conference on theory and applications of models of computation, 2008, pp. 1–19 Springer
- [38] Curtis E Dyreson and Richard T Snodgrass “Timestamp semantics and representation” In Information Systems 18.3 Elsevier, 1993, pp. 143–166
- [39] A. Elevelt et al. “Where You at? Using GPS Locations in an Electronic Time Use Diary Study to Derive Functional Locations” In Social Science Computer Review, 2019 DOI: 10.1177/0894439319877872
- [40] European Union “Regulation (EU) 2016/679 of the European Parliament and of the Council of 27 April 2016 on the Protection of Natural Persons with Regard to the Processing of Personal Data and on the Free Movement of Such Data, and Repealing Directive 95/46/EC (General Data Protection Regulation)” In OJ 59 (L 119), 2016, pp. 1–89
- [41] Deen Freelon “Computational research in the post-API age” In Political Communication 35.4 Taylor & Francis, 2018, pp. 665–668
- [42] Daniel Gayo-Avello “No, you cannot predict elections with Twitter” In IEEE Internet Computing 16.6 IEEE, 2012, pp. 91–94
- [43] R.. Groves and L. Lyberg “Total Survey Error: Past, Present, and Future” In Public Opinion Quarterly 74.5, 2010, pp. 849–879 DOI: 10.1093/poq/nfq065
- [44] Robert M Groves and Emilia Peytcheva “The impact of nonresponse rates on nonresponse bias: a meta-analysis” In Public opinion quarterly 72.2 Oxford University Press, 2008, pp. 167–189
- [45] Olivia Guerra-Santin and Laure Itard “Occupants’ behaviour: determinants and effects on residential heating consumption” In Building Research & Information 38.3 Taylor & Francis, 2010, pp. 318–338
- [46] Katherine Haenschen “Self-reported versus digitally recorded: Measuring political activity on Facebook” In Social Science Computer Review 38.5 SAGE Publications Sage CA: Los Angeles, CA, 2020, pp. 567–583
- [47] Alexander Halavais “Overcoming terms of service: a proposal for ethical distributed research” In Information, Communication & Society 22.11 Taylor & Francis, 2019, pp. 1567–1581
- [48] Katie Harron, Harvey Goldstein and Chris Dibben “Methodological developments in data linkage” John Wiley & Sons, 2015
- [49] Erik Hjelmaas and Boon Kee Low “Face detection: A survey” In Computer vision and image understanding 83.3 Elsevier, 2001, pp. 236–274
- [50] Rein-Lien Hsu, Mohamed Abdel-Mottaleb and Anil K Jain “Face detection in color images” In IEEE transactions on pattern analysis and machine intelligence 24.5 IEEE, 2002, pp. 696–706
- [51] Luke Hutton and T. Henderson ““I Didn’t Sign Up for This!”: Informed Consent in Social Network Research” In ICWSM, 2015
- [52] Lilli Japec et al. “Big data in survey research: AAPOR task force report” In Public Opinion Quarterly 79.4 Oxford University Press US, 2015, pp. 839–880
- [53] Andreas Jungherr “Analyzing Political Communication with Digital Trace Data: The Role of Twitter Messages in Social Science Research”, Contributions to Political Science Springer International Publishing, 2015 DOI: 10.1007/978-3-319-20319-5
- [54] Heysem Kaya, Furkan Gürpinar and Albert Ali Salah “Video-based emotion recognition in the wild using deep transfer learning and score fusion” In Image and Vision Computing 65 Elsevier, 2017, pp. 66–75
- [55] Heysem Kaya, Furkan Gürpınar and Albert Ali Salah “Video-based emotion recognition in the wild using deep transfer learning and score fusion” In Image and Vision Computing 65, 2017, pp. 66–75 DOI: 10.1016/j.imavis.2017.01.012
- [56] Jae-kwang Kim and Siu - Ming Tam “Data integration by combining big data and survey sample data for finite population inference” In arXiv preprint arXiv:2003.12156, 2020
- [57] G. King “Ensuring the Data-Rich Future of the Social Sciences” In Science 331.6018, 2011, pp. 719–721 DOI: 10.1126/science.1197872
- [58] Gary King and Nathaniel Persily “A New Model for Industry–Academic Partnerships” In PS: Political Science & Politics, 2019, pp. 1–7 DOI: 10.1017/S1049096519001021
- [59] Tobias Konitzer et al. “Measuring News Consumption With Behavioral Versus Survey Data” In SSRN Electronic Journal, 2020 DOI: 10.2139/ssrn.3548690
- [60] M. Kosinski, D. Stillwell and T. Graepel “Private traits and attributes are predictable from digital records of human behavior” In Proceedings of the National Academy of Sciences 110.15, 2013, pp. 5802–5805 DOI: 10.1073/pnas.1218772110
- [61] Adam DI Kramer, Jamie E Guillory and Jeffrey T Hancock “Experimental evidence of massive-scale emotional contagion through social networks” In Proceedings of the National Academy of Sciences 111.24 National Acad Sciences, 2014, pp. 8788–8790
- [62] Frauke Kreuter, Joseph W Sakshaug and Roger Tourangeau “The framing of the record linkage consent question” In International Journal of Public Opinion Research 28.1 Oxford University Press, 2016, pp. 142–152
- [63] Shan Li and Weihong Deng “Deep Facial Expression Recognition: A Survey” In IEEE Transactions on Affective Computing, 2020, pp. 1–1 DOI: 10.1109/TAFFC.2020.2981446
- [64] Sharon L Lohr “Coverage and sampling” In International handbook of survey methodology Lawrence Erlbaum Associates New York, 2008, pp. 97–112
- [65] Sharon L Lohr “Multiple-frame surveys” In Handbook of statistics 29 Elsevier, 2009, pp. 71–88
- [66] Simon Lovestone and EMIF Consortium “The European medical information framework: A novel ecosystem for sharing healthcare data across Europe” In Learning Health Systems 4.2 Wiley Online Library, 2020, pp. e10214
- [67] Lydia Manikonda, Yuheng Hu and Subbarao Kambhampati “Analyzing user activities, demographics, social network structure and user-generated content on Instagram” In arXiv preprint arXiv:1410.8099, 2014
- [68] Ángeles Martínez-García “La imagen en la era digital” Universidad de Sevilla: Egregius, 2017 URL: https://idus.us.es/handle/11441/91571
- [69] Jonathan Mellon and Christopher Prosser “Twitter and Facebook are not representative of the general population: Political attitudes and demographics of British social media users” In Research & Politics 4.3, 2017, pp. 205316801772000 DOI: 10.1177/2053168017720008
- [70] Solomon Messing et al. “Facebook Privacy-Protected Full URLs Data Set” type: dataset Harvard Dataverse, 2020 DOI: 10.7910/DVN/TDOAPG
- [71] Marcus R. Munafò and George Davey Smith “Robust research needs many lines of evidence” In Nature 553.7689, 2018, pp. 399–401 DOI: 10.1038/d41586-018-01023-3
- [72] Kevin P Murphy “Machine learning: a probabilistic perspective” MA: MIT press, 2012
- [73] Glenford J Myers, Tom Badgett, Todd M Thomas and Corey Sandler “The art of software testing” Wiley Online Library, 2004
- [74] Helen Nissenbaum “Privacy as contextual integrity” In Wash. L. Rev. 79 HeinOnline, 2004, pp. 119
- [75] Daniel L Oberski, Antje Kirchner, Stephanie Eckman and Frauke Kreuter “Evaluating the quality of survey and administrative data with generalized multitrait-multimethod models” In Journal of the American Statistical Association 112.520 Taylor & Francis, 2017, pp. 1477–1489
- [76] Daniel L. Oberski and Frauke Kreuter “Differential Privacy and Social Science: An Urgent Puzzle” In Harvard Data Science Review 2.1, 2020 DOI: 10.1162/99608f92.63a22079
- [77] Zizi Papacharissi “A networked self: Identity, community, and culture on social network sites” Routledge, 2010
- [78] Prasad Patil, Roger D Peng and Jeffrey T Leek “A statistical definition for reproducibility and replicability” In BioRxiv Cold Spring Harbor Laboratory, 2016, pp. 066803
- [79] Alex Pentland “Honest signals: how they shape our world” MIT press, 2010
- [80] Jessamy Perriam, Andreas Birkbak and Andy Freeman “Digital methods in a post-API environment” In International Journal of Social Research Methodology 23.3 Taylor & Francis, 2020, pp. 277–290
- [81] Jürgen Pfeffer, Katja Mayer and Fred Morstatter “Tampering with Twitter’s sample API” In EPJ Data Science 7.1 Springer Berlin Heidelberg, 2018, pp. 50
- [82] Gregory J Privitera “Research methods for the behavioral sciences” Sage Publications, 2018
- [83] Anabel Quan-Haase and Alyson L Young “Uses and gratifications of social media: A comparison of Facebook and instant messaging” In Bulletin of science, technology & society 30.5 SAGE Publications Sage CA: Los Angeles, CA, 2010, pp. 350–361
- [84] Byron Reeves et al. “Screenomics: A framework to capture and analyze personal life experiences and the ways that technology shapes them” In Human–Computer Interaction Taylor & Francis, 2019, pp. 1–52
- [85] Melanie Revilla, Carlos Ochoa and Germán Loewe “Using Passive Data From a Meter to Complement Survey Data in Order to Study Online Behavior” In Social Science Computer Review 35.4, 2017, pp. 521–536 DOI: 10.1177/0894439316638457
- [86] Nick Warren Ruktanonchai, Corrine Warren Ruktanonchai, Jessica Rhona Floyd and Andrew J Tatem “Using Google Location History data to quantify fine-scale human mobility” In International Journal of Health Geographics 17.1 Springer, 2018, pp. 28
- [87] Willem E. Saris and Irmtraud N. Gallhofer “Design, evaluation, and analysis of questionnaires for survey research” OCLC: ocm80358503, Wiley series in survey methodology Hoboken, N.J: Wiley-Interscience, 2007
- [88] Joseph L Schafer and John W Graham “Missing data: our view of the state of the art.” In Psychological methods 7.2 American Psychological Association, 2002, pp. 147
- [89] Michael Scharkow “The reliability and temporal stability of self-reported media exposure: A meta-analysis” In Communication Methods and Measures 13.3 Taylor & Francis, 2019, pp. 198–211
- [90] M Scheerman, L Voort and N Zarrabi “Secure Processing of Sensitive Data on shared HPC systems”, 2020 URL: https://www.compbiomed-conference.org/wp-content/uploads/2020/03/Fri_11_15_Narges_Zarrabi-slides-compbiomed-website_smaller.pdf
- [91] Harald Schoen et al. “The power of prediction with social media” In Internet Research 23.5, 2013, pp. 528–543 DOI: 10.1108/IntR-06-2013-0115
- [92] Indira Sen et al. “A total error framework for digital traces of humans” In arXiv preprint arXiv:1907.08228, 2019
- [93] Michele Settanni, Danny Azucar and Davide Marengo “Predicting Individual Characteristics from Digital Traces on Social Media: A Meta-Analysis” In Cyberpsychology, Behavior, and Social Networking 21.4, 2018, pp. 217–228 DOI: 10.1089/cyber.2017.0384
- [94] Kizito Shirima et al. “The use of personal digital assistants for data entry at the point of collection in a large household survey in southern Tanzania” In Emerging themes in epidemiology 4.1 BioMed Central, 2007, pp. 1–8
- [95] Eleanor Singer “Informed consent and survey response: a summary of the empirical literature” In Journal of Official Statistics 9.2 Statistics Sweden (SCB), 1993, pp. 361
- [96] Ram Govind Singh and Sushmita Ruj “A Technical Look At The Indian Personal Data Protection Bill” arXiv: 2005.13812 In arXiv:2005.13812 [cs], 2020 URL: http://arxiv.org/abs/2005.13812
- [97] Sebastian Stier, Johannes Breuer, Pascal Siegers and Kjerstin Thorson “Integrating survey data and digital trace data: key issues in developing an emerging field” SAGE Publications Sage CA: Los Angeles, CA, 2019
- [98] Victoria Stodden, Friedrich Leisch and Roger D Peng “Implementing reproducible research” CRC Press, 2014
- [99] Victoria Stodden and Sheila Miguez “Best Practices for Computational Science: Software Infrastructure and Environments for Reproducible and Extensible Research” In Journal of Open Research Software 2.1 Ubiquity Press, 2014
- [100] Yuko Suda “Japan’s Personal Information Protection Policy Under Pressure” In Asian Survey 60.3, 2020, pp. 510–533 DOI: 10.1525/as.2020.60.3.510
- [101] Michael Szell, Renaud Lambiotte and Stefan Thurner “Multirelational organization of large-scale social networks in an online world” Publisher: National Academy of Sciences Section: Social Sciences In Proceedings of the National Academy of Sciences, 2010 DOI: 10.1073/pnas.1004008107
- [102] “Utrecht University Research Data Management Support” Accessed: 2020-07-18, https://www.uu.nl/en/research/research-data-management
- [103] Patti M Valkenburg, Sindy R Sumter and Jochen Peter “Gender differences in online and offline self-disclosure in pre-adolescence and adolescence” In British Journal of Developmental Psychology 29.2 Wiley Online Library, 2011, pp. 253–269
- [104] Richard Valliant, Jill A Dever and Frauke Kreuter “Practical Tools for Designing and Weighting Survey Samples” Cham: Springer International Publishing : Imprint: Springer, 2018 URL: https://link.springer.com/10.1007/978-3-319-93632-1
- [105] Bart Sloot “The General Data Protection Regulation in Plain Language” Amsterdam University Press, 2020
- [106] Anne Eldik, Julia Kneer and Jeroen Jansz “Urban & online: Social media use among adolescents and sense of belonging to a super-diverse city” In Media and Communication 7.2, 2019, pp. 242–253
- [107] Sandra Wachter, Brent Mittelstadt and Chris Russell “Counterfactual Explanations without Opening the Black Box: Automated Decisions and the GDPR” In Harvard Journal of Law & Technology (Harvard JOLT) 31.2, 2017, pp. 841–888 URL: https://heinonline.org/HOL/P?h=hein.journals/hjlt31&i=860
- [108] Mark D Wilkinson et al. “The FAIR Guiding Principles for scientific data management and stewardship” In Scientific data 3.1 Nature Publishing Group, 2016, pp. 1–9
- [109] Janis Wong and Tristan Henderson “The right to data portability in practice: exploring the implications of the technologically neutral GDPR” In International Data Privacy Law 9.3 Oxford University Press, 2019, pp. 173–191
- [110] Li-Chun Zhang “Topics of statistical theory for register-based statistics and data integration” In Statistica Neerlandica 66.1 Wiley Online Library, 2012, pp. 41–63