Modifying PyUltraLight to model scalar dark matter with self-interactions
Abstract
We introduce a modification of the PyUltraLight code that models the dynamical evolution of ultralight axionlike scalar dark matter fields. Our modified code, PySiUltraLight, adds a quartic, self-interaction term to reflect the one which arises naturally in axionlike particle models. Using a particle mass of , we show that PySiUltraLight produces spatially oscillating solitons, exploding solitons, and collapsing solitons which prior analytic work shows will occur with attractive self-interactions. Using our code we calculate the oscillation frequency as a function of soliton mass and equilibrium radius in the presence of attractive self-interactions. We show that when the soliton mass is below the critical mass () described by Chavanis [Phys. Rev. D 94, 083007 (2016)] and the initial radius is within a specific range, solitons are unstable and explode. We test the maximum mass criteria described by Chavanis [Phys. Rev. D 94, 083007 (2016)] and Chavanis and Delfini [Phys. Rev. D 84, 043532 (2011)] for a soliton to collapse when attractive self-interactions are included. We also analyze both binary soliton collisions and a soliton rotating around a central mass with attractive and repulsive self-interactions. We find that when attractive self-interactions are included, the density profiles get distorted after a binary collision. We also find that a soliton is less susceptible to tidal stripping when attractive self-interactions are included. We find that the opposite is true for repulsive self-interactions in that solitons would be more easily tidally stripped. Including self-interactions might therefore influence the survival timescales of infalling solitons.
I Introduction
There is significant evidence to show that dark matter makes up the majority of the matter in the Universe and that this evidence suggests that dark matter is nonrelativistic and collisionless Buckley and Peter (2018); Ade et al. (2016); Schwabe et al. (2016); Armendariz-Picon and Neelakanta (2014). Strong evidence for this cold dark matter (CDM) picture comes from fluctuations in the cosmic microwave background Giesen et al. (2012); Aghanim et al. (2020). We still know very little about the microphysics of the particle or particles that comprise dark matter. One of the most successful and well-studied dark matter paradigms is weakly interacting massive particles (WIMPs). WIMPs are consistent with the statistics of large-scale structures formed in the Universe. However, at small scales, questions remain. Models, such as the WIMP model and other cold, collisionless models, with only dark matter predict dense cusps at the center of dark matter halos. Observations suggest that many dark matter halos have constant density cores. This apparent issue may be resolved with the inclusion of baryonic processes such as supernova feedback, tidal stripping, and dynamical friction Del Popolo and Pace (2016); Marsh (2015).
Traditional CDM models like WIMPs faced the missing satellite problem, which is the discrepancy between the few subhalos we observed and the number found in CDM simulations. There are several proposed theoretical solutions to the problem Buckley and Peter (2018); Spergel and Steinhardt (2000); Avila-Reese et al. (2001); Kamionkowski and Liddle (2000). As astronomers find more satellite galaxies, there is increasing confidence that the missing satellite problem is no longer a real problem. WIMPs also face the “too big to fail” problem, which comes from the most dense dwarf galaxy-hosting subhalos predicted by simulations being systematically denser than what we infer from the brightest Milky Way satellite galaxies Papastergis et al. (2015). This problem might also be solved by including baryonic effects such as supernova feedback and tidal stripping Del Popolo and Pace (2016); Marsh (2015).
Another possible solution is that an alternative to the CDM paradigm is needed. Axionlike particles (ALPs), which are motivated by open problems in QCD and also can come from string theory compactifications, are one such dark matter candidate Schwabe et al. (2016); Buckley and Peter (2018); Arvanitaki et al. (2010); Cicoli (2013). This class of scalar dark matter particles has its roots in the QCD axion, which is a consequence of the Peccei-Quinn mechanism that was developed to solve the CP problem in QCD. The axion arises in this model through spontaneous symmetry breaking as a psuedo-Nambu-Goldstone boson Peccei and Quinn (1977). The QCD axion potential is given by
| (1) |
where is the Peccei-Quinn symmetry breaking scale and Guth et al. (2015). Axion dark matter models can give the expected dark matter abundance we see in the Universe Dine and Fischler (1983); Preskill et al. (1983); Abbott and Sikivie (1983); Kim and Carosi (2010). From Guth et al. (2015), the abundance of QCD axion dark matter is given by:
| (2) |
In the literature, the QCD axion is typically theorized to be more massive than the ALPs that are motivated by string compactifications because the QCD cannot be trans-Planckian. From Di Luzio et al. (2020) the QCD axion mass is given by:
| (3) |
It is important to note that this relation only applies to the QCD axion and not necessarily to ALPs. The mass of the QCD axion has a range of values but is estimated to be between Alesini et al. (2019). The lower limit is set because the QCD cannot be trans-Planckian. This is because the shift symmetry for the axion would be unbroken if the decay constant were above the Planck scale Rudelius (2015).
In this paper, we focus on the physics of ultralight axions and not the QCD axion. ALPs are also sometimes referred to as ultralight axions (ULAs). Fuzzy dark matter is a ULA model where dark matter comprises ultralight bosons Hu et al. (2000); Hui et al. (2017); Ringwald (2012). Because the mass of fuzzy dark matter is very small, the de Broglie wavelength is large (on the order of a kiloparsec) which means that dense cusps would be suppressed by quantum pressure. Here, quantum pressure is a term used to describe the effective particle-particle interaction that is found in the Madelung formalism Madelung (1926). Due to the wavelike nature of ULA models, on small scales (on the order of a few kpc), we should observe interference patterns Schive et al. (2014a, b); Schwabe et al. (2016). ULA models have similar predictions to WIMP models on large scales. However, on small scales, ULA models have suppressed structure formation Peebles (2000). In particular, ULA models will not have dark matter halos on scales smaller than the Jeans scale Hu et al. (2000); Suárez and Chavanis (2018). Focusing on small-scale structures is therefore important to test the ULA hypothesis. ULAs leads to distinct phenomenological considerations from those with more massive ALPs, which can lead to miniclusters of cosmological interest, see e.g., Vaquero et al. (2019); Kavanagh et al. (2020).
ULA models that include self-interactions may diverge from those that are gravity only Chavanis (2016). If the self-interaction is attractive, as is the case with the QCD axion, virialized dark matter clusters of sufficient mass may collapse into black holes, explode, or oscillate in size. Supermassive black holes could be formed by ultralight particles such as ALPs with an attractive self-interaction. Meanwhile, the presence of a repulsive self-interaction guarantees the existence of a stable halo configuration in the Newtonian limit Chavanis (2016). This configuration occurs when the repulsive self-interaction and repulsive quantum pressure balance gravity’s attractive behavior. In the scenario where the scalar dark matter has a repulsive interaction, Chavanis (2016); Fan (2016) suggest that observations of the bullet cluster sets a limit on the repulsive self-interaction strength. This constraint combined with the mass of one of the lightest known dark matter halos, Willman I, we can estimate the mass of the boson to be on the order of which is too massive to fall into the category of ultralight dark matter Chavanis (2016).
To better quantitatively understand the effects of self-interactions on ULA models, we introduce PySiUltraLight, a modified version of PyUltraLight which simulates the dynamics of axion fields Edwards et al. (2018), which solves the Schrödinger-Poisson equations. Our code upgrades the original by including the self-interaction term which accounts for additional physics. We validate the code by verifying the analytic predictions made in Chavanis (2016). In particular, we confirm the oscillation behavior of solitons, the conditions under which exploding solitons will occur, and the existence of a maximum soliton mass given attractive self-interactions. Our code is also capable of including repulsive self-interactions. We explore the behavior of solitons in binary collisions and in orbits around a central potential when there are attractive or repulsive self-interactions.
The results of this paper are of interest because we show the phenomenological differences between ultralight dark matter models with and without self-interactions. Understanding these differences allows for more detailed simulations to better understand how ultralight dark matter models contrast with CDM models. Since there is no reason dark matter cannot have a self-coupling, it is unlikely the self-interaction strength is exactly zero. Most well-motivated particle physics models include a self-interaction. Since the coupling is typically small, astrophysicists tend to neglect the coupling in simulations. However, in this paper, we show that including the self-interactions affects the phenomenology of solitary and binary soliton systems, including mergers. Self-interactions are believed to affect the density-radius relationship of solitonic dark matter cores Eby et al. (2020). Understanding how solitons oscillate may also be important for understanding dark matter structure formation because for a range of axion masses, these objects may decay in the matter-radiation equality or matter dominated epochs Ollé et al. (2020); Kawasaki et al. (2020).
The contents of the paper are as follows. Section II outlines the physics of ULA models with the inclusion of self-interactions and describes the Gross-Pitaevskii-Poisson (GPP) equations in dimensional and adimensional forms. Section III shows how the equations of motion are implemented in PySiUltraLight. In Sec. IV, we discuss results found with PySiUltraLight. Using a Gaussian ansatz, we find the oscillation frequencies of a soliton with attractive self-interactions and test the conditions under which exploding solitons can occur. We also include an analysis for finding the maximum mass for a soliton with attractive self-interactions. In Sec. V, we discuss simulations of both binary soliton collisions and solitons rotating around a central potential with both repulsive and attractive self-interactions. Our conclusion that the self-interaction remains an important consideration—and future directions—are discussed in Sec. VI.
II ULA Equations of Motion
ULA dark matter in the high occupancy regime—e.g., Bose-Einstein condensate-like solitons—are normally described by the Schrödinger-Poisson equations Guth et al. (2015); Marsh (2016); Baldeschi et al. (1983); Ji and Sin (1994); Lee and Koh (1996); Matos et al. (2000); Peebles (2000); Lee (2016); Arbey et al. (2001); Alcubierre et al. (2002); Silverman and Mallett (2002); Arbey et al. (2003); Boehmer and Harko (2007); Fukuyama et al. (2008); Sikivie and Yang (2009); Lee and Lim (2010); Ruffini and Bonazzola (1969). When self-interactions are included, the Schrödinger-Poisson equations become the nonlinear Schrödinger-Poisson or Gross-Pitaevskii-Poisson equations Chavanis (2016); Chavanis and Delfini (2011). We use the term soliton to refer to self-localized axion dark matter which is near its ground state in the Newtonian limit Amin and Mocz (2019); Ruffini and Bonazzola (1969). We focus on the leading order self-interaction term which is a quartic term and do not consider higher order terms. Assuming a classical field with minimal coupling to gravity, the action takes the form:
| (4) |
Here, is the scalar field, is the mass of the scalar field, and is the dimensionless self-coupling strength.
The self-coupling strength, or self-interaction strength, is also directly proportional to the scattering length, . The scattering length is a measure of the interaction cross section. When is positive, the interaction is repulsive. When is negative, the interaction is attractive Bao and Cai (2012). may be written in terms of the scattering length . In Chavanis (2016), is given by
| (5) |
where is the Planck mass and is the scalar field mass. can also be defined in terms of the decay constant, , with the relation Desjacques et al. (2018). Constraints from observations require a very small ULA self-interaction strength. According to Fan (2016), constraints from the bullet cluster require that the repulsive coupling be
| (6) |
We find the equations of motion in the Newtonian gauge, and writing the real scalar field in terms of a complex field by
| (7) |
(see Kirkpatrick et al. (2020)), we arrive at the GPP equations:
| (8) |
and
| (9) |
Here, is the boson field, and is the gravitational potential. Using the process found in Edwards et al. (2018), the nondimensional form of the GPP equations is
| (10) |
and
| (11) |
Here we have introduced , a dimensionless coupling constant that will simplify our numerical efforts later. By definition,
| (12) |
where is the timescale given in Edwards et al. (2018) as
| (13) |
For the equilibrium solution for a system of self-gravitating bosons, we find the solution in the Newtonian limit. A general relativistic treatment can be found in Ruffini and Bonazzola (1969). It is important to note some differences in the general relativistic treatment. For instance, in the general relativistic treatment, there is always a maximum soliton mass, even when there are repulsive self-interactions Chavanis (2016). Validating that the Newtonian limit is a good assumption is important for our simulations. Appendix E in Chavanis (2016) shows that the Newtonian limit is valid for our regime. They show that the Newtonian limit is a good approximation except when a collapsing soliton is very close to the end of its collapse time.
The significance of including the self-interaction merits discussion, since as we described earlier, typically ULA models, and more generally scalar dark matter models, ignore self-interactions between the particles in favor of considering only their coupling through gravity. This is because the dimensionless coupling is on the order of Desjacques et al. (2018). However, even though the coupling is very small, to understand effective coupling strength, we must multiply this value by the phase space density of axions in the environment Desjacques et al. (2018). One way to have some intuition for this is to consider that the density associated with the field is given by . This means the nonlinear term . In other words, the effect of the nonlinear term is governed by the combination of and the density.
This is not a surprising conclusion since this result arises in other areas of physics. For example, in optical systems that are governed by nonlinear Schrödinger/Gross-Pitaevskii equation, the nonlinear term is responsible for inducing an intensity-dependent refractive index. This change in the refractive index is also known as the Kerr effect Agrawal (2019). Therefore, there is good reason to take seriously the presence of a self-interaction, even if it is small. Results in the following sections are consistent with this expectation.
III Implementation in PySiUltraLight
PyUltraLight is a Python solver for the evolution of solitonic dark matter and solves the Schrödinger-Poisson system of equations. The code uses a pseudospectral solver where the linear differential operators are computed in Fourier space whereas the nonlinear terms are computed in phase space. We made the following changes to the code to adapt it for a self-coupling term, creating a version we refer to as PySiUltraLight.
The original PyUltraLight paper Edwards et al. (2018) goes over how to implement the Schrödinger-Poisson equations as well as how to make a soliton profile used for simulations. PyUltraLight uses a soliton profile of self-gravitating bosons in equilibrium. The method used to get the profile can be found in more detail in Edwards et al. (2018) or Ruffini and Bonazzola (1969). Reference Edwards et al. (2018) then discusses several simulations of binary soliton collisions and solitons rotating around a central potential. We produce similar but distinct simulations which now include self-interactions. The results appear in Sec. V. Reference Edwards et al. (2018) also details how convergence tests were performed to verify energy conservation and to see how spatial and temporal resolutions affect the simulation results.
To find the dynamics of solitons, we follow a similar procedure as in Edwards et al. (2018). We rederived the evolution equations in the presence of self-interactions. First, we determined how changes when a small step in time is taken:
| (14) |
Here, is the time ordering operator. Next we use the following approximations for small time steps which come from the trapezoid rule
| (15) |
| (16) |
Substituting these into Eq. (14) gives
| (17) |
Using the Baker-Campbell-Hausdorf formula we verified that the error is . This is the same order of error as when there were no self-interactions (i.e. when ). The procedure to evolve the soliton uses the following equations:
| (18) |
| (19) |
Here, is the Fourier transform, is the inverse Fourier transform, and is the wave number in Fourier space. is the field at the half step. We checked energy conservation to verify the integrity of changes we made to the code. The Lagrangian density that yielded the GPP equations is
| (20) |
The energy of the system then becomes
| (21) |
PySiUltraLight follows PyUltraLight in using the following units. We will often refer to these units, which take the following form, as code units:
| (22) |
| (23) |
and
| (24) |
These are the code length, time, and mass respectively where is the present-day Hubble parameter and is the present-day matter fraction of the energy density of the Universe. One can get dimensionful quantities back by using dimensional analysis. One can recover the desired unit by taking a code unit and multiplying it by the proper code quantities. For example, to recover the dimensional form of the energy
| (25) |
To initialize PySiUltraLight, users must specify the initial soliton profiles by giving the solitons the desired masses, positions, velocities, and phases. PySiUltraLight additionally requires that the user choose the boson mass and the dimensionless coupling constant which are necessary parameters for determining the solitonic dynamics with self-interactions. Other parameters that must be specified that are also necessary in PyUltraLight are the box size (which is the size of the simulation), the duration of the simulation, and the time step. The time step used in the code is independent of the self-interaction strength. It is only dependent on the resolution but may also be adjusted with the step factor.
PySiUltraLight uses periodic boundary conditions from PyUltraLight which can, in principle, affect this code’s results. Using periodic boundary conditions means that the space in which the simulation runs is topologically equivalent to a torus. When mass travels through the boundary, unphysical affects can arise because angular momentum is not conserved. There may also be unwanted effects when the box size is too small relative to the radius of the soliton. When this happens, the soliton may interact with its neighboring images in an unphysical way. In all of our simulations, the solitonic bodies never cross the boundary. For the simulations presented in this paper, we also checked to see if increasing the box size made any changes to the results. In all cases, the differences were negligible.
IV Single Soliton Behavior in PySiUltraLight
There are noticeable differences between simulations with large attractive self-interactions and those without self-interactions, indicating that it can be physically important to account for the presence of self-interactions. We focus on simulations with attractive self-interactions in this section to test the analysis in Chavanis (2016). For portions of this work, we will employ a Gaussian ansatz for the soliton profile. The ansatz approximates the exact profile and is commonly used in studying Bose-Einstein-condensates (BECs) Chavanis (2016); Chavanis and Delfini (2011); Chavanis (2011), and it is an approximate solution to the Gross-Pitaevskii-Poisson equations Chavanis (2016). We are motivated to use the Gaussian ansatz in order to make direct comparisons with Chavanis (2016). This approximation involves defining a density profile for a self-gravitating BEC and then minimizing the total energy of the system with respect to the radius to find the equilibrium radius. This technique has also been used to describe the mass-radius relation in white dwarf stars Chavanis (2011). The form for the soliton using the Gaussian ansatz is
| (26) |
where is the measure of the size of the soliton, is the distance from the center of the soliton, and . This should not be confused with the Hubble parameter. The dependence on the self-interaction is included in . There are other profiles we could have used Eby et al. (2018), however, we wanted to compare our results with the claims in Chavanis (2016) which used a Gaussian ansatz. This profile is evolved using the GPP equations using the methods explained in Sec. III.
PyUltraLight makes a soliton profile by imposing spherical symmetry on the Schrödinger-Poisson equations and also requires that the radial density profile be time independent Edwards et al. (2018). This is thought to be a good approximation for undisrupted solitonic cores (see e.g. Edwards et al. (2018); Ruffini and Bonazzola (1969)). We use the ansatz when making comparisons to the analytical work found in Chavanis (2016). Specifically, we use the ansatz when looking at oscillating and exploding solitons. PySiUltraLight expands beyond its predecessor code by adding the ability for the user to specify the radius of the soliton when there are attractive self-interactions. This is necessary to implement the Gaussian ansatz and more broadly introduces the capability to change the radius of a soliton.
The first step to verify the newly adjusted program was working properly involved comparing PySiUltraLight with zero self-coupling to PyUltraLight. There were no differences between the new and old versions in the tests that we ran with this condition. The next step in verifying the code was to ensure the energy of the system was conserved. Energy was indeed conserved to a high degree, provided that the time step was sufficiently small. The degree to which energy was conserved also depended on the resolution of the simulation.
In this section, we will first show the oscillatory behaviors of single solitons. We will then describe the behaviors of exploding solitons and the conditions in which they should be observed. Lastly, we present numerical work on collapsing solitons, which requires going beyond the Gaussian ansatz and results available in earlier literature, e.g., Chavanis (2016).
IV.1 Oscillating solitons
We considered Chavanis (2016) as a benchmark for testing, and our next step was to show that PySiUltraLight outputs results which match those found there. In Chavanis (2016); Eby et al. (2016); Chen et al. (2020), axion dark matter with an attractive self-coupling has a maximum halo mass before the dark matter collapses into a black hole
| (27) |
which can be rewritten as
| (28) |
This means there are no time-independent solutions to the GPP equations when the soliton mass is too large and the self-interaction is attractive.
Using the Gaussian ansatz, we can test how solitons will oscillate given a specified mass and radius. There are two different scenarios where one can see oscillating solitons. The first scenario is when the soliton mass is below a critical mass . When this is the case, the soliton oscillates provided the starting radius is larger than
| (29) |
In the other scenario, the soliton mass is between the critical mass and the maximum mass. In this case, there is a finite range that the initial radius can be, otherwise the soliton will collapse. For oscillating solitons, there is a relation between the oscillation frequency and the equilibrium radius when oscillations are small. According to Chavanis (2016), the relation is given by
| (30) |
Here, is the equilibrium radius in terms of the radius of the soliton with a mass of and the frequency had been scaled by the dynamical time. The equilibrium radius is the radius where the effective potential as a function of radius is minimized. The equilibrium radius is given by
| (31) |
where is the total soliton mass Chavanis (2016). The dynamical time is given by
| (32) |
We ran several simulations to determine the frequency of oscillations by analyzing the time for the soliton to go from a peak density to the next peak density. We do this because the density peak will occur when the soliton is smallest in size. For these simulations, the only parameter varied was the total soliton mass between so as to isolate the relationship between the mass and the frequency of oscillation. The boson mass was , and the coupling was . Figure 1 shows the plot of the soliton equilibrium radius versus the oscillation frequency. The line in the plot shows the best fit of Eq. (30) which fits the data well. The data does not match the best fit line as well when the mass approaches the maximum soliton mass.
The soliton oscillation frequency can also be found using total mass. Figure 2 shows the soliton mass versus the oscillation frequency. For positive , the equation is given by
| (33) |


 |
| (a) t = 1.5 |
 |
| (b) t = 3.0 |
 |
| (c) t = 4.5 |
 |
| (d) t = 6.0 |
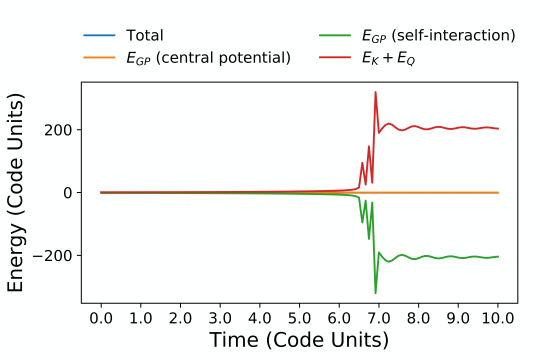
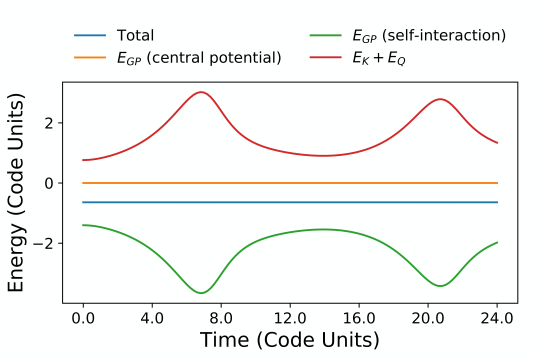
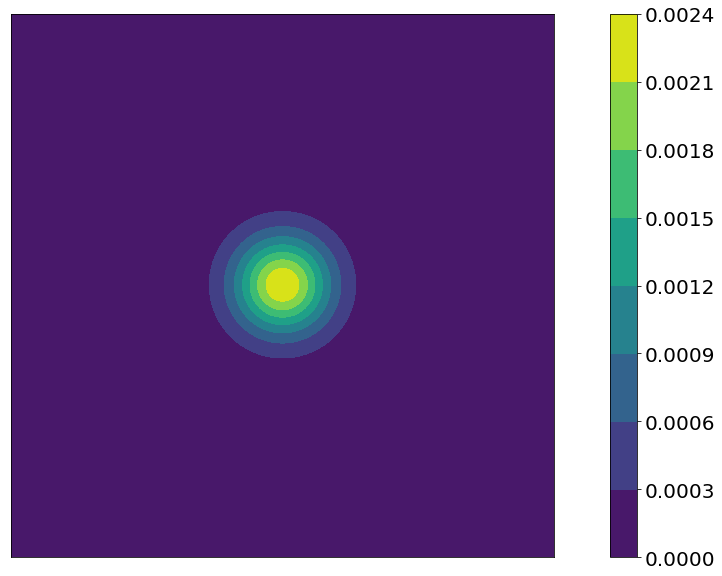
In the first simulation for testing oscillating solitons, the soliton had a mass of 2.4 code units which is less than . In this situation, the soliton oscillated in size. In Fig. 3, we again see that energy is conserved to one part in for a step factor of 1. For other simulations where the mass was less than , the solitons also oscillated. Similarly, for other simulations where the mass was greater than , the soliton collapsed. These results were consistent with results that appear in Chavanis (2016).
Here, is the soliton’s mass in terms of the maximum soliton mass defined in Eq. (27). The best fit dynamical time for both graphs was 0.786. This is longer than the calculated dynamical time of 0.675 code units. The difference in these values is unlikely to be caused by a lack of spatial resolution because there was a negligible difference between the oscillation frequencies when the resolution was 256 versus 512. Therefore we believe that the cause is deformation of the Gaussian profile over time, into a more realistic profile. We know this occurs because we fit a Gaussian to the density profile and looked at how the R-squared value changes over time. The value started at exactly 1 and evolved to approximately 0.998. This was also the value that the exact solution took. Since we know that the change in the profile has an effect on the maximum mass a soliton can have before collapsing Chavanis (2016); Eby et al. (2018), it is reasonable to think that the oscillation frequencies might be scaled differently for the different profiles. We verified that this is the likely explanation by analytically calculating the dynamical time for the exact solution and found that the dynamical time would be 0.791 code units. This new value matches well with the dynamical time found through the simulations. This also suggests the results of this section are robust beyond the Gaussian ansatz.
IV.2 Exploding solitons
According to Chavanis (2016), under certain initial conditions, we expect to see exploding solitons which are solitons that grow without bound. Specifically, when the soliton mass is below the critical mass and the radius of the soliton in less than but greater than the radius that maximizes the effective potential, explosions should occur. This value of the radius is the number of equilibrium radii of a soliton with mass [i.e. ]. Because the Gaussian ansatz is only an approximate solution, the criteria for observing different phenomena, such as collapsing solitons and oscillating solitons, changes slightly. For instance, the maximum mass for a soliton with a Gaussian form is instead of the exact value of Chavanis (2016).
NO SI WITH NO PHASE SHIFT

 (a) t = 0.01
(b) t = 0.02
 (c) t = 0.03
(d) t = 0.04
 (e) t = 0.05
(f) t = 0.06
 (g) t = 0.07
(h) t = 0.08
 (i) t = 0.09
(j) t = 0.10
ATTRACTIVE SI WITH NO PHASE SHIFT
 (a) t = 0.01
(b) t = 0.02
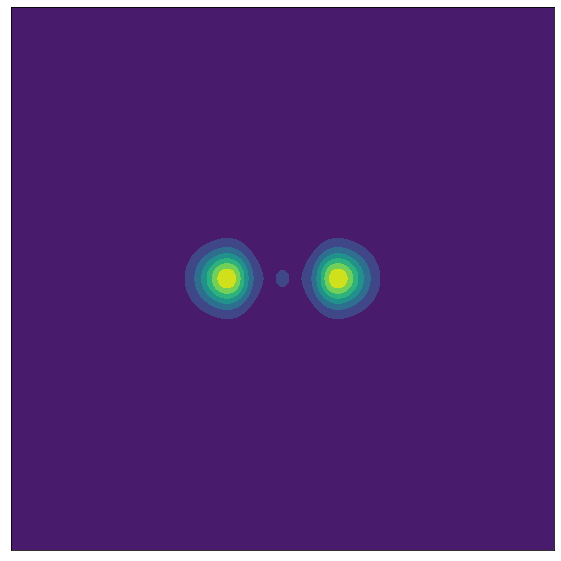
 (c) t = 0.03
(d) t = 0.04
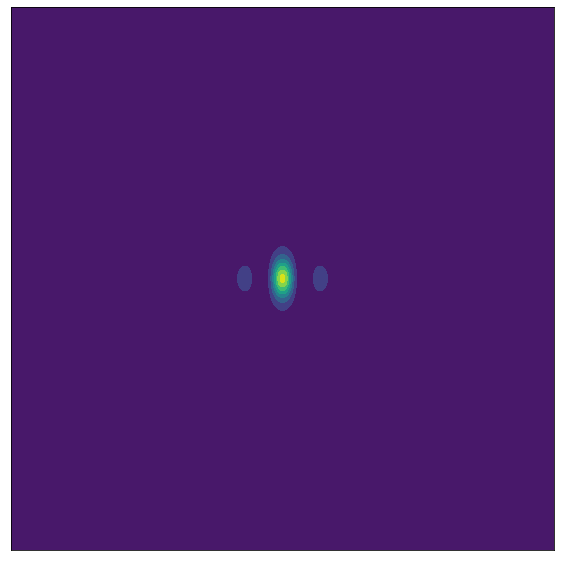
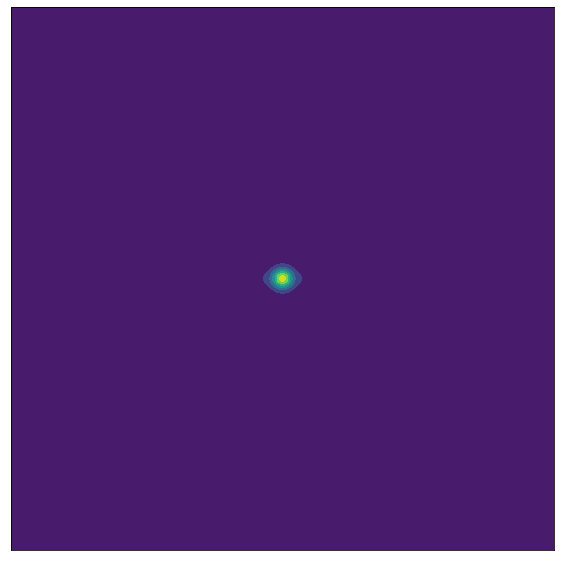 (e) t = 0.05
(f) t = 0.06
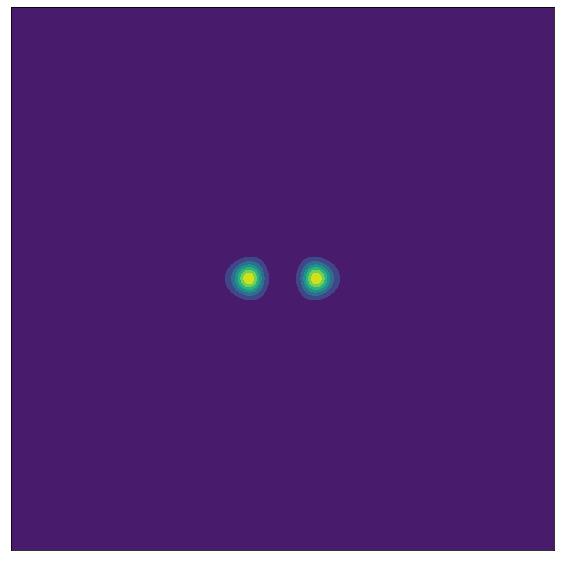
 (g) t = 0.07
(h) t = 0.08
 (i) t = 0.09
(j) t = 0.10
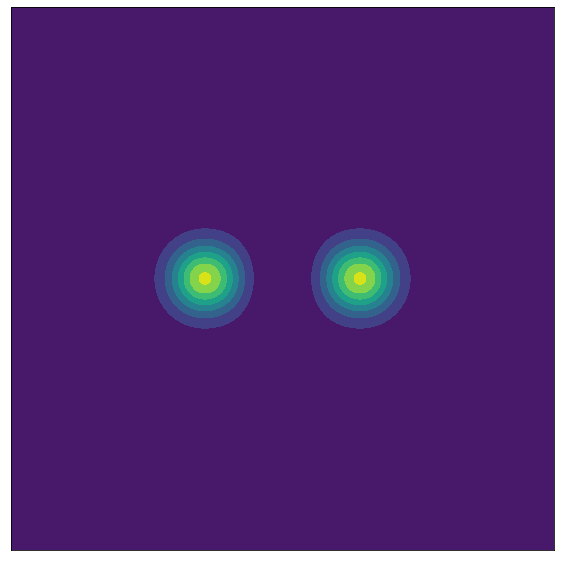
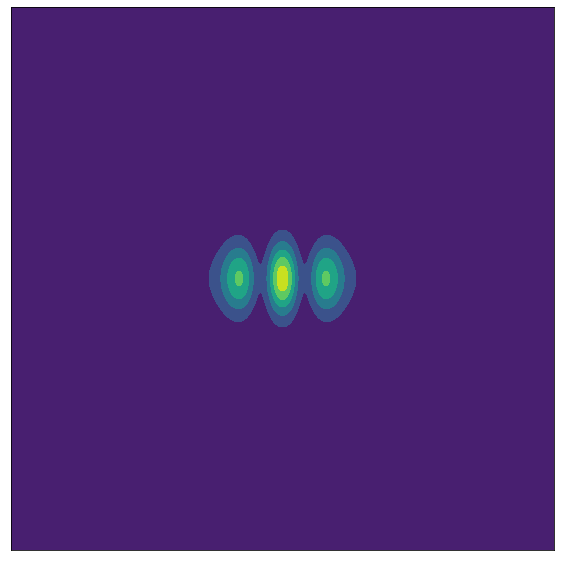
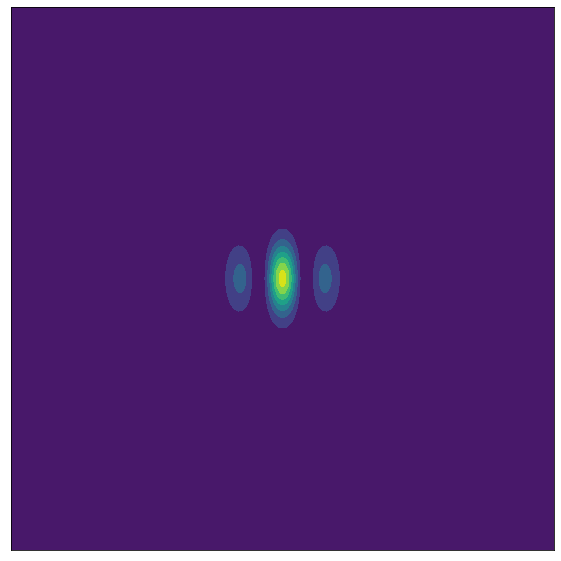
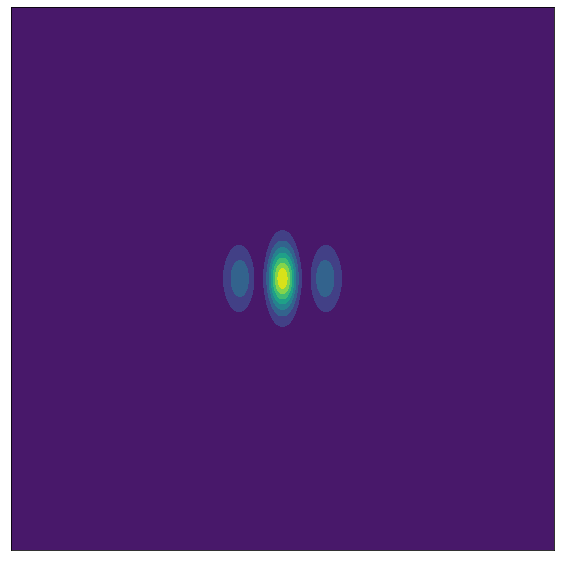
REPULSIVE SI WITH NO PHASE SHIFT
 (a) t = 0.01
(b) t = 0.02

 (c) t = 0.03
(d) t = 0.04
 (e) t = 0.05
(f) t = 0.06
 (g) t = 0.07
(h) t = 0.08
 (i) t = 0.09
(j) t = 0.10
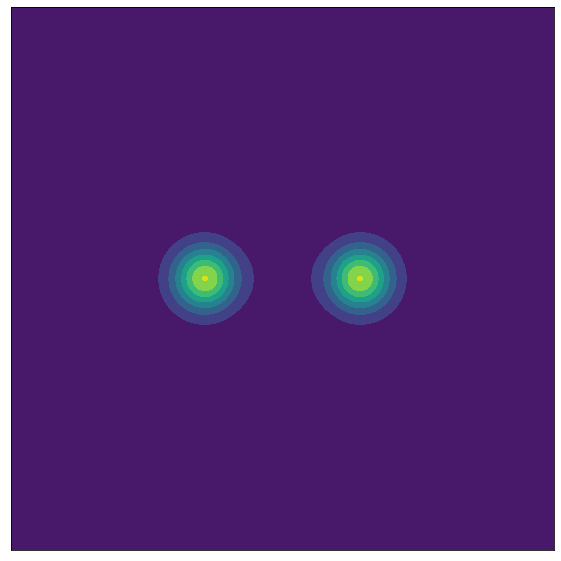
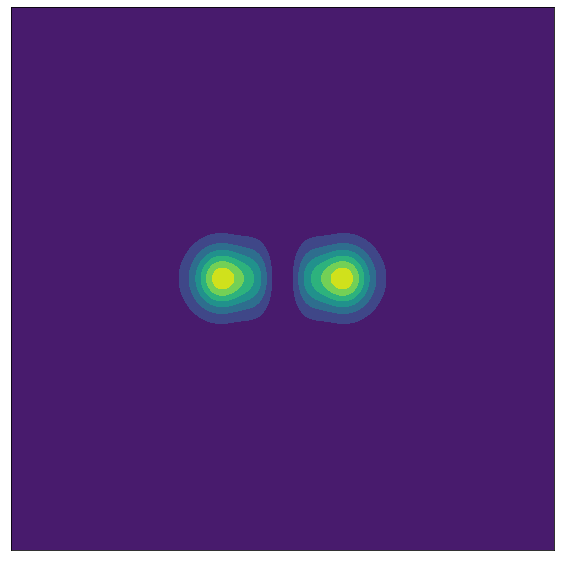
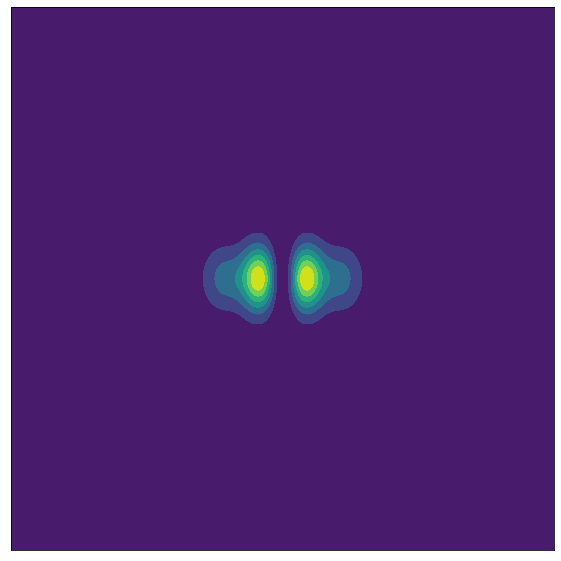
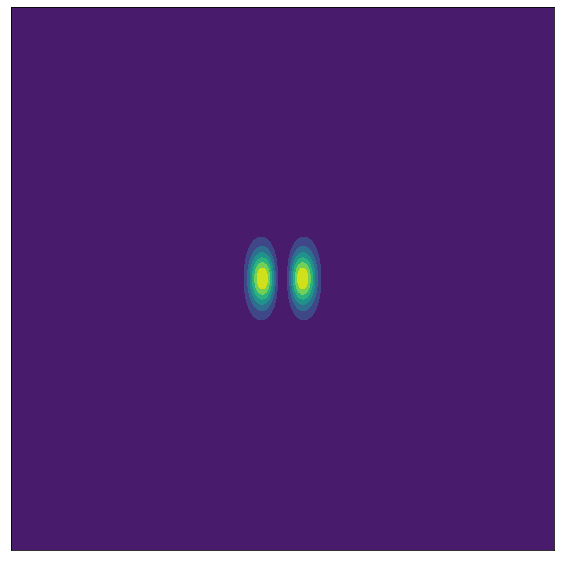
NO SI WITH PHASE SHIFT

 (a) t = 0.01
(b) t = 0.02
 (c) t = 0.03
(d) t = 0.04
 (e) t = 0.05
(f) t = 0.06
 (g) t = 0.07
(h) t = 0.08
 (i) t = 0.09
(j) t = 0.10
ATTRACTIVE SI WITH PHASE SHIFT
 (a) t = 0.01
(b) t = 0.02

 (c) t = 0.03
(d) t = 0.04
 (e) t = 0.05
(f) t = 0.06
 (g) t = 0.07
(h) t = 0.08
 (i) t = 0.09
(j) t = 0.10
REPULSIVE SI WITH PHASE SHIFT
 (a) t = 0.01
(b) t = 0.02
 (c) t = 0.03
(d) t = 0.04
 (e) t = 0.05
(f) t = 0.06
 (g) t = 0.07
(h) t = 0.08
 (i) t = 0.09
(j) t = 0.10
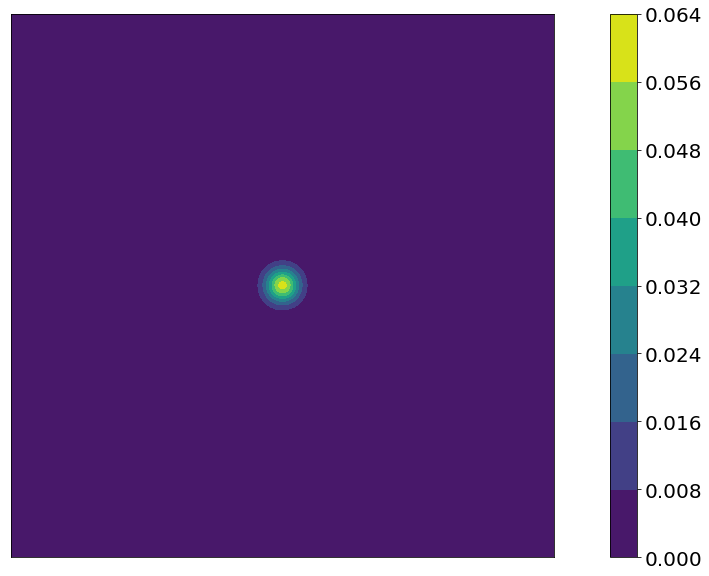
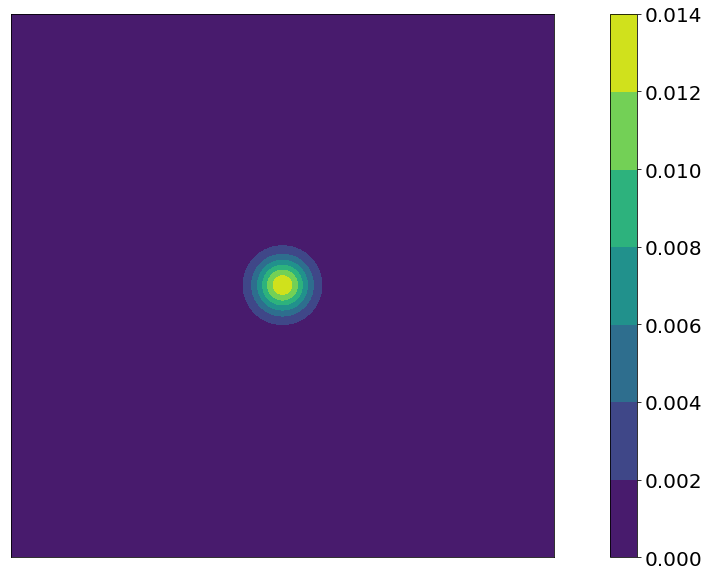
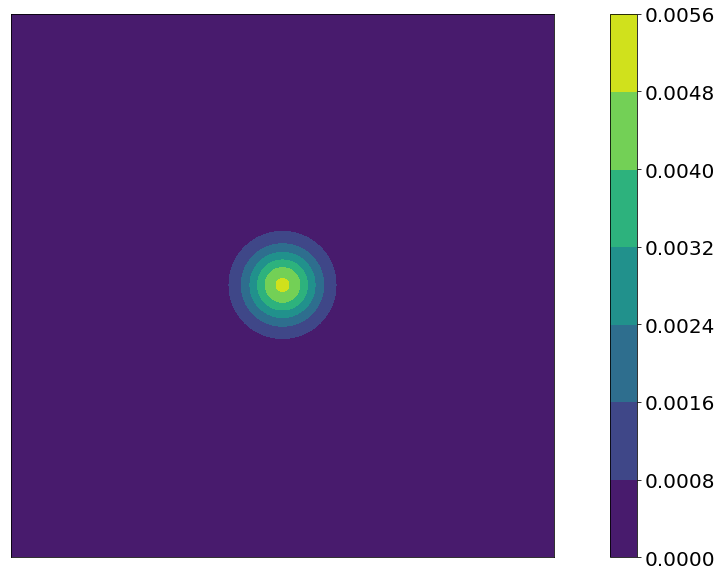
In Fig. 4, we simulate a soliton with attractive self-interactions. The initial size is smaller than the critical radius. The mass is also below the critical mass. The soliton expands in size without collapsing again or oscillating in size. We find that with a sufficiently small radius, provided that the mass is less than a critical mass, the soliton collapses.
IV.3 Collapsing solitons
Moving beyond the Gaussian ansatz, we also set up a scenario involving a single soliton with an attractive self-interaction and varied the mass of the soliton. This provides a test of how successful the code produces results without assuming a Gaussian ansatz. For these simulations, we find agreement with the numerical prediction of the exact maximum mass criteria found in Chavanis and Delfini (2011). Using and an axion mass of (which corresponds to ), the maximum mass of a soliton from Eq. (28) is or 2.46 code units. The starting simulation had the soliton mass at 2.5 code units which is larger than . We found that the soliton collapsed into a singularity which we define as when at least of the total mass is contained in one unit cell. PySiUltraLight can only handle a grid-point to grid-point phase difference of up to which limits how dense the collapsed soliton can get. Figure 5 also shows the components of the system’s energy over time. From this, we see that the total system energy is conserved up until the end of the collapse. For most of the simulation, energy is conserved to better than one part in . After the soliton has collapsed, the total energy change is about 7 percent. This simulation was done with a step factor of 0.05 which is a measure of the temporal resolution. We found that decreasing the step factor greatly reduced the percent energy change when there are collapsing solitons.
V Multiple Soliton Behavior and Central Potential Examples in PySiUltraLight
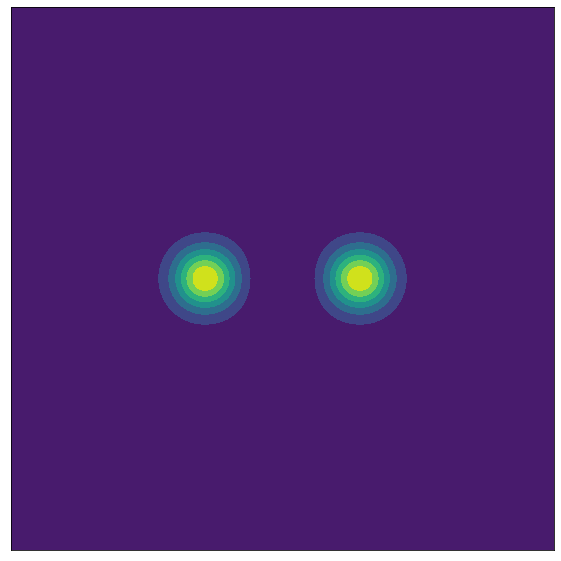
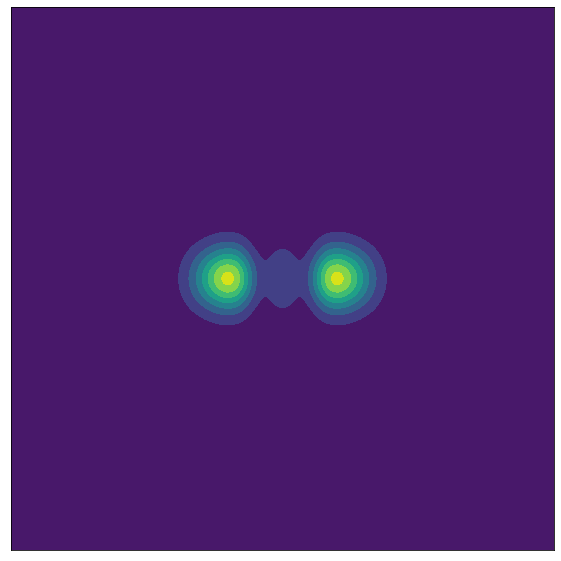
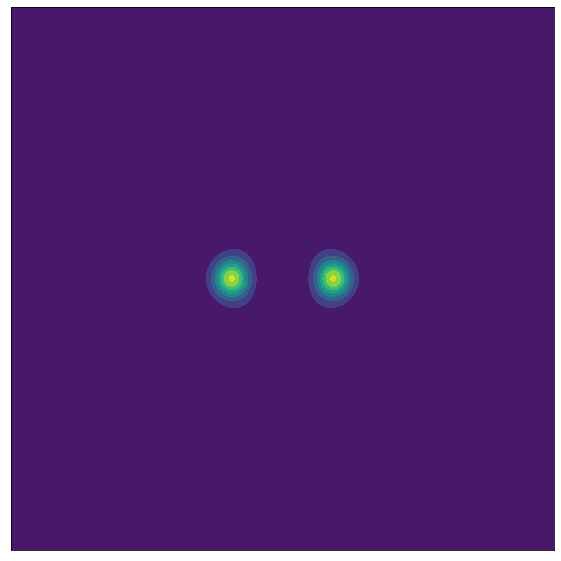
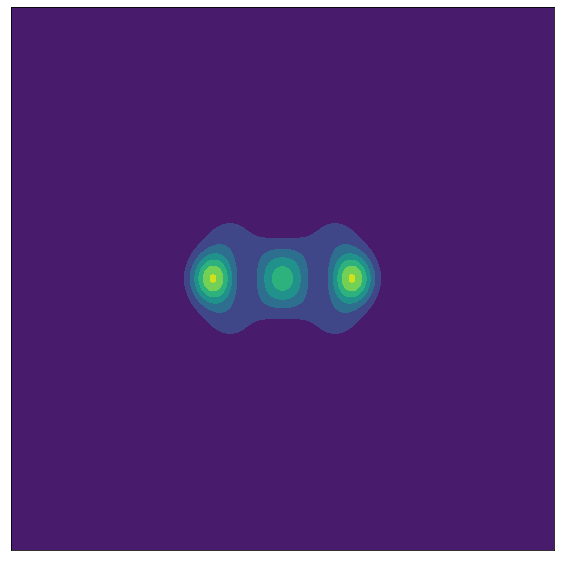
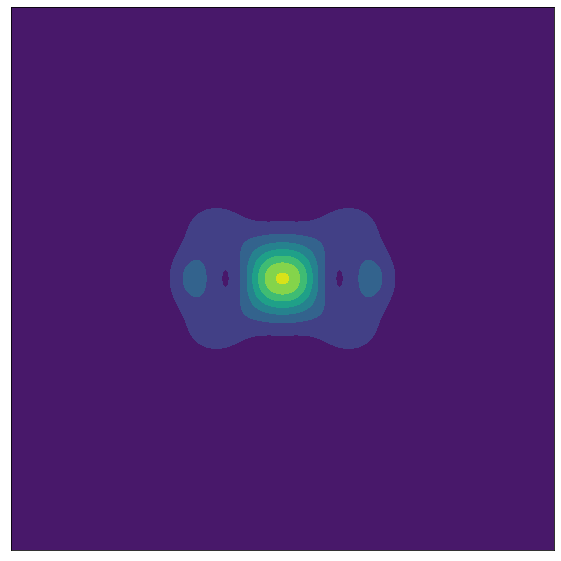
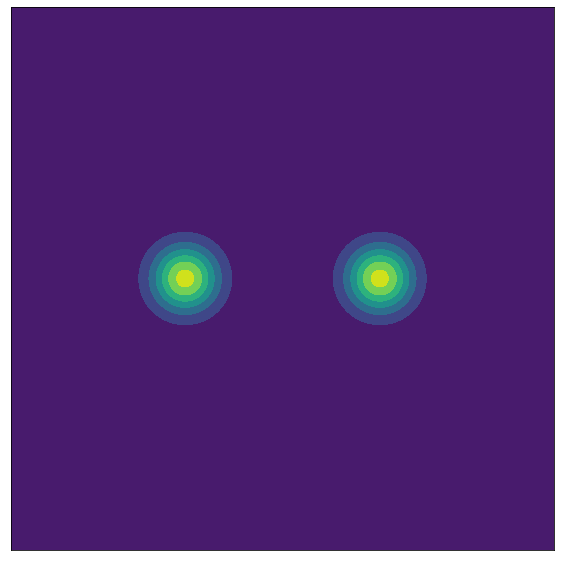
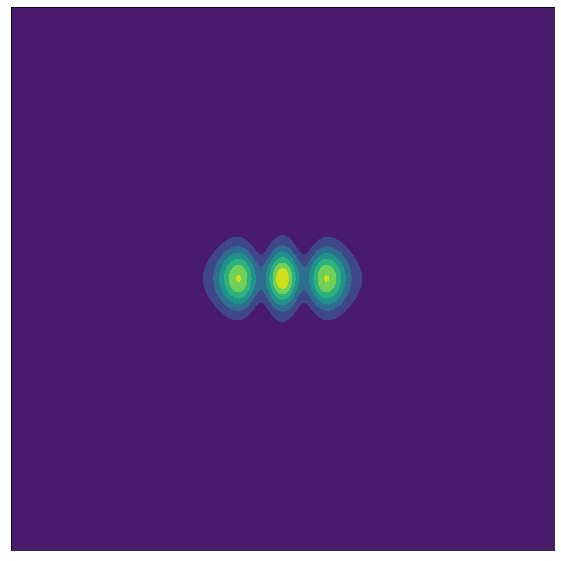
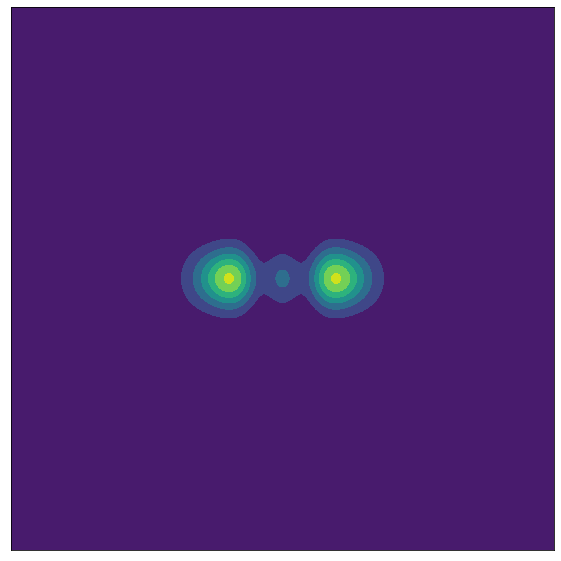
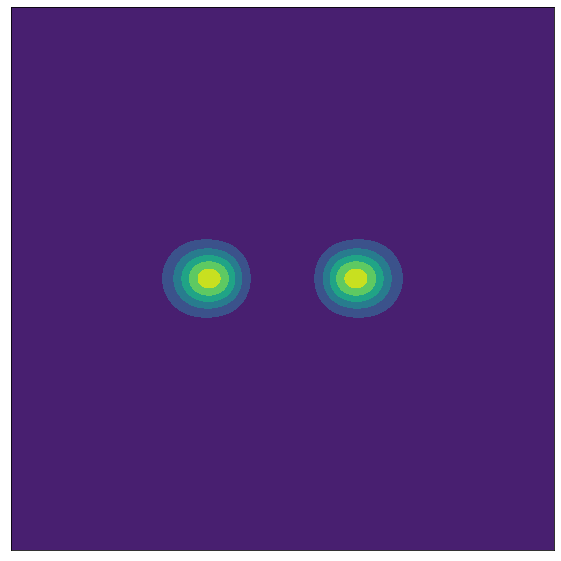
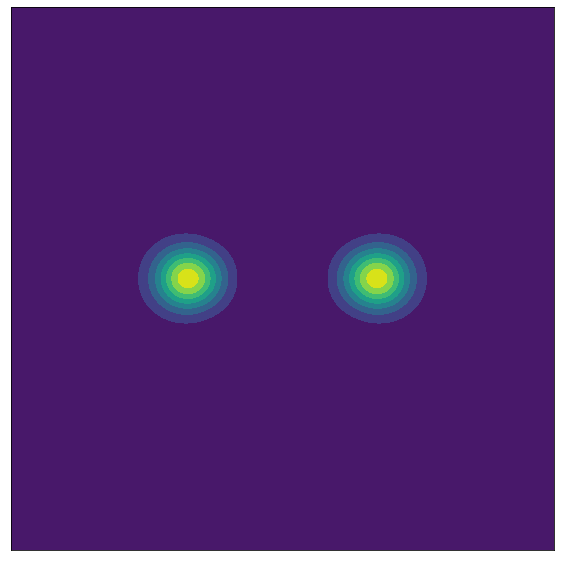
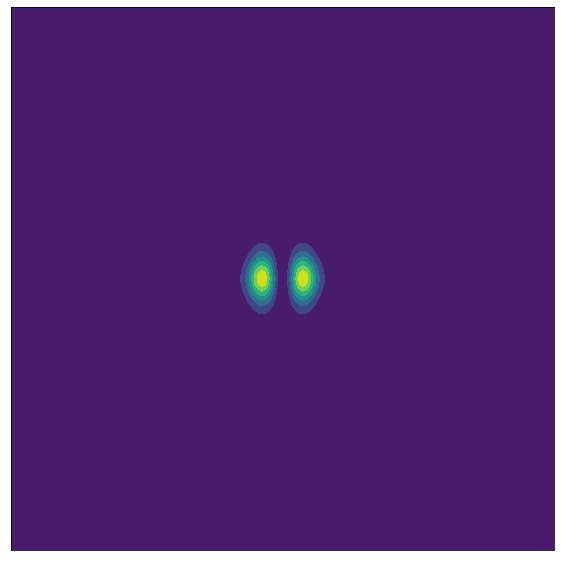
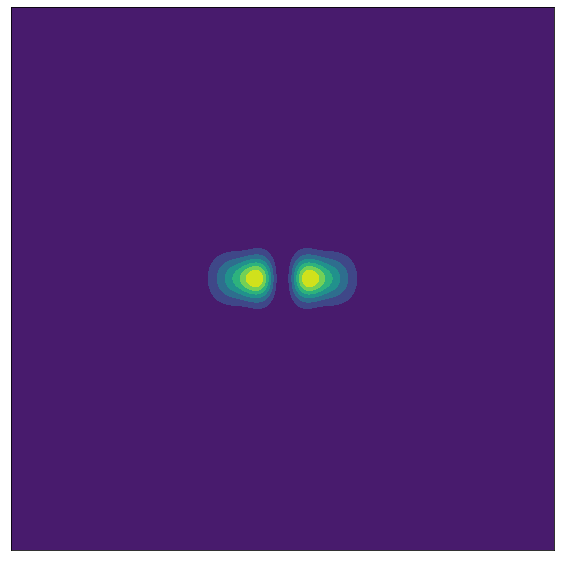
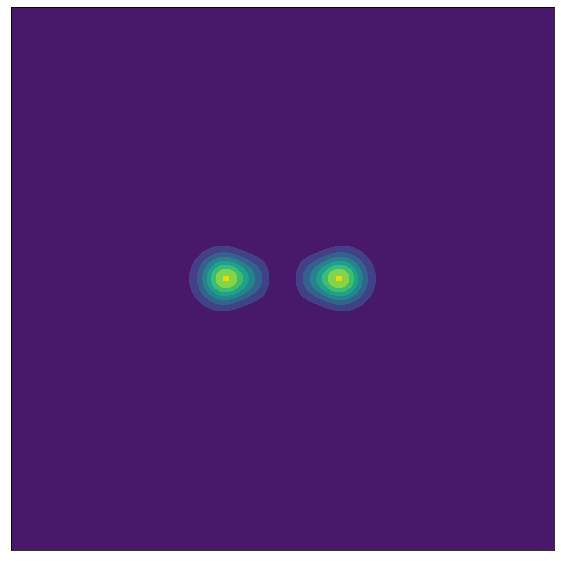
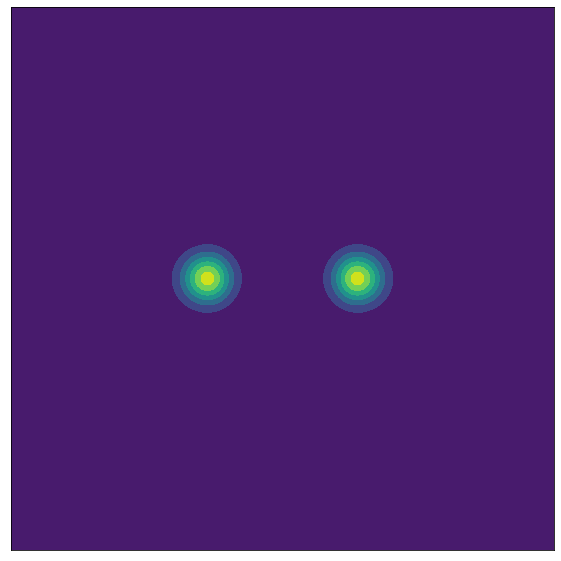
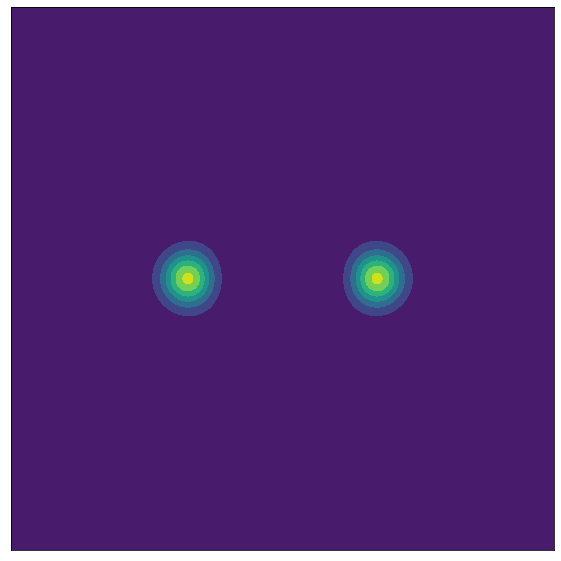
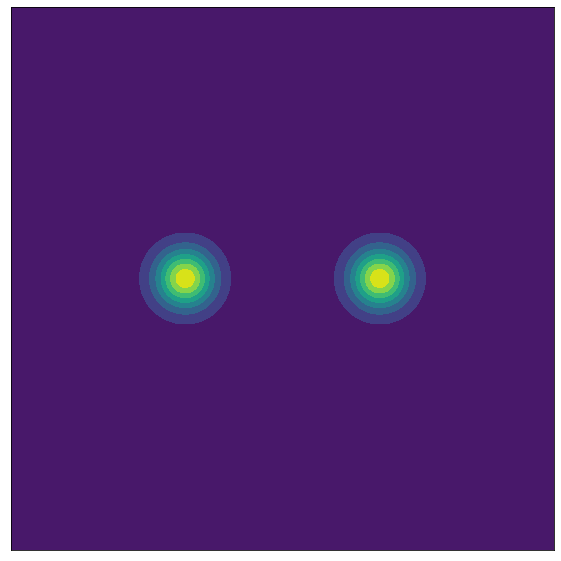
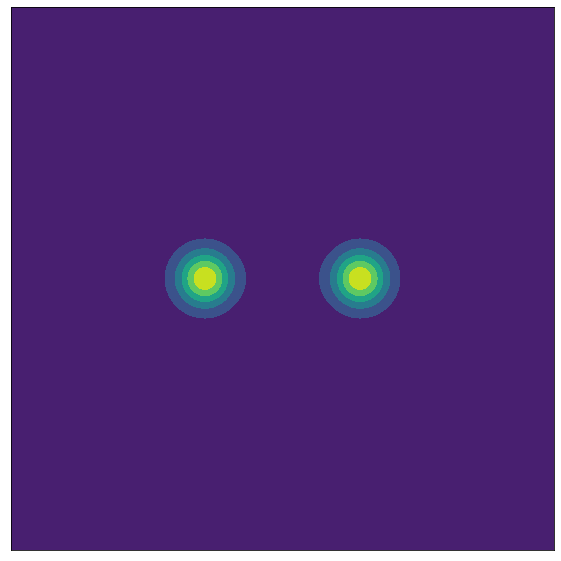
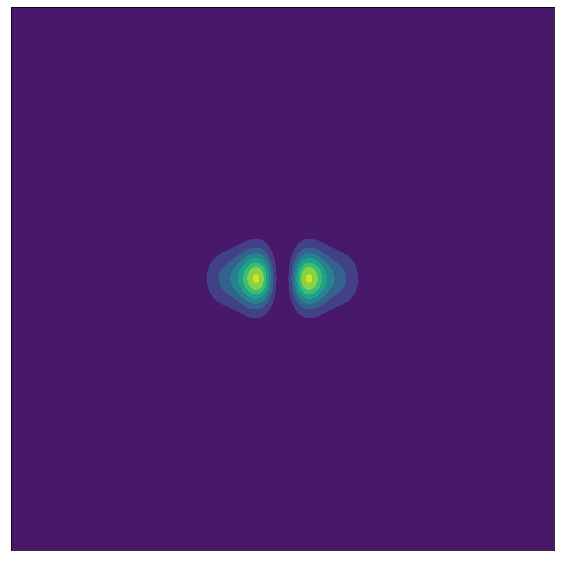
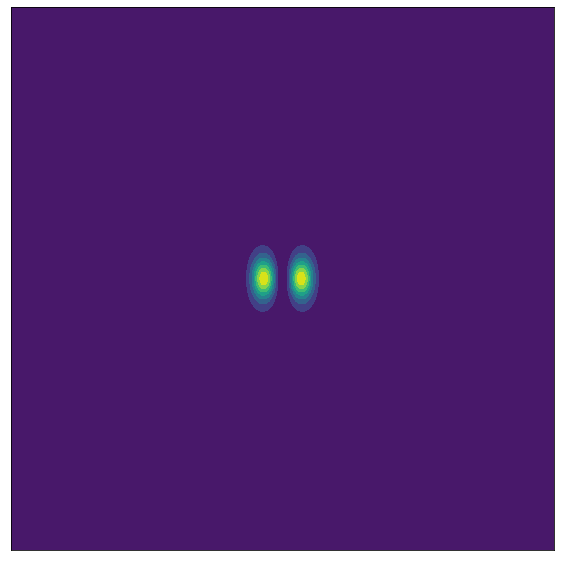
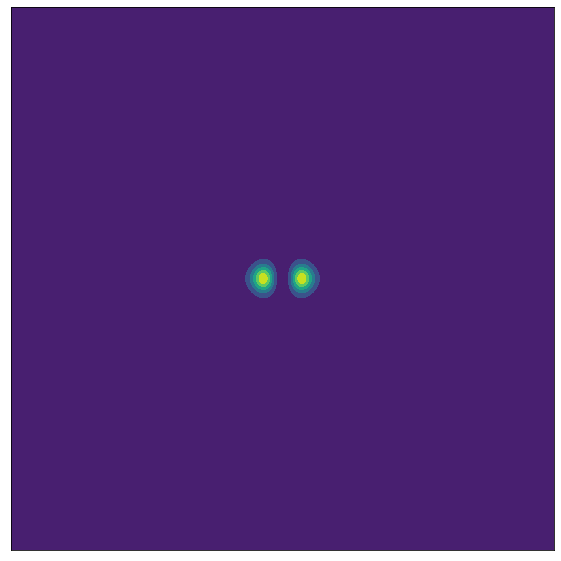
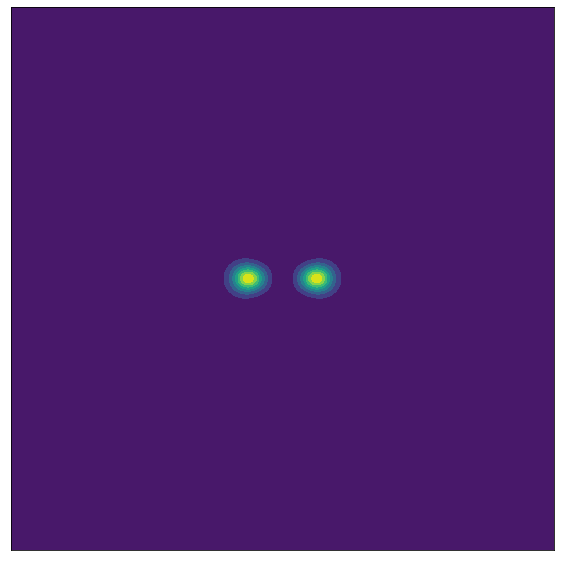
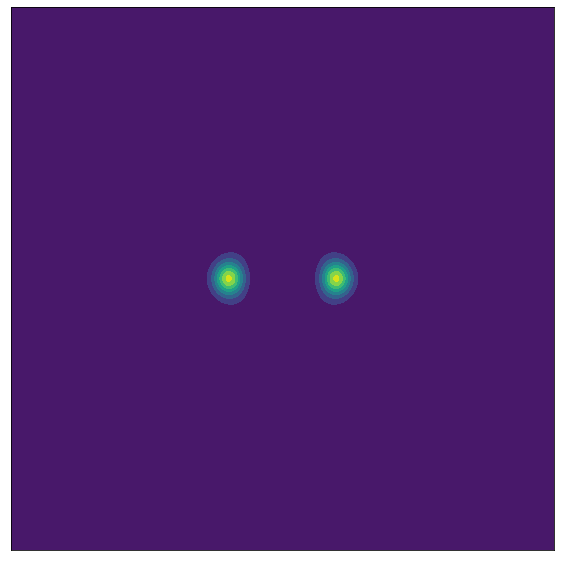
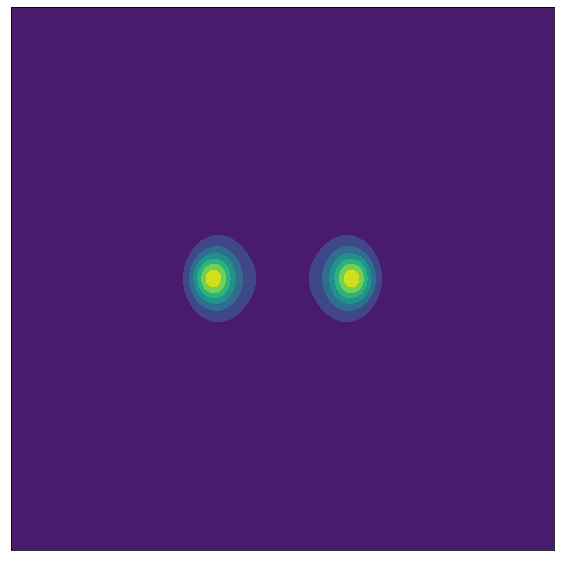
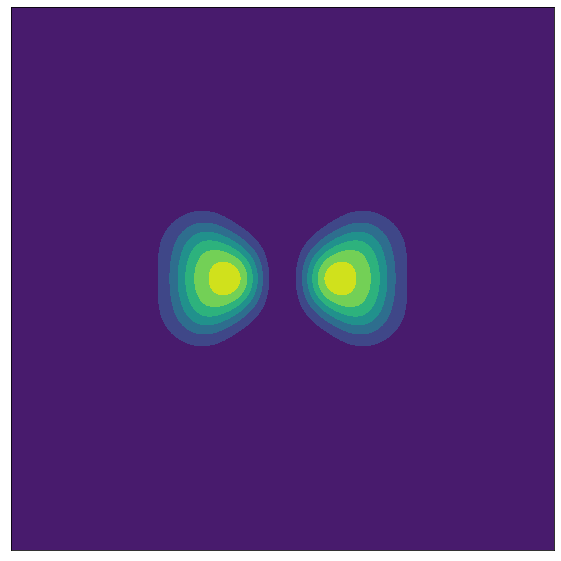
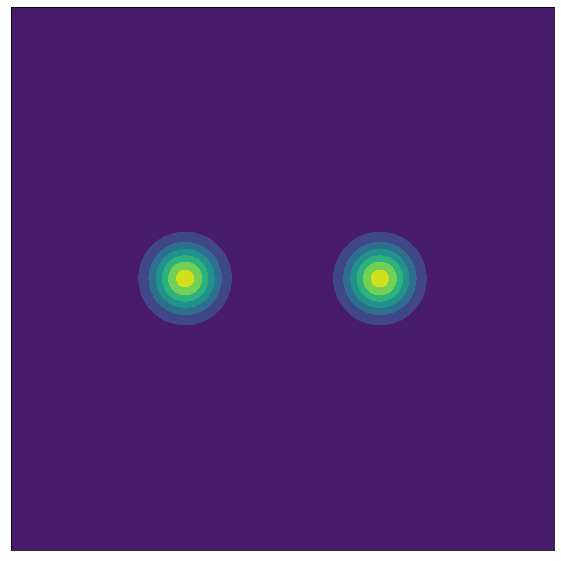
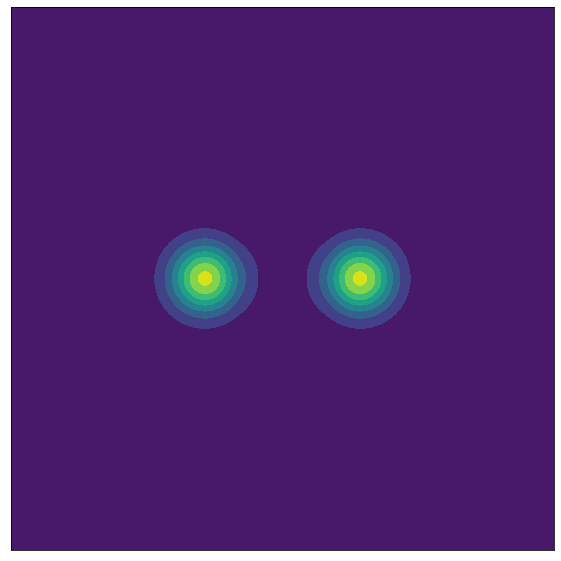
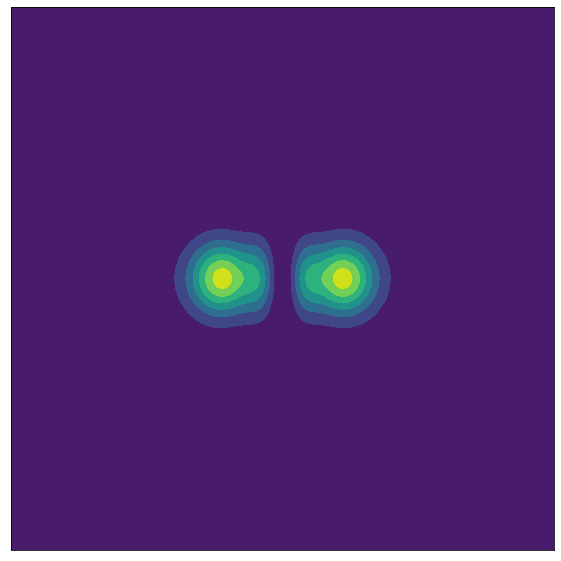
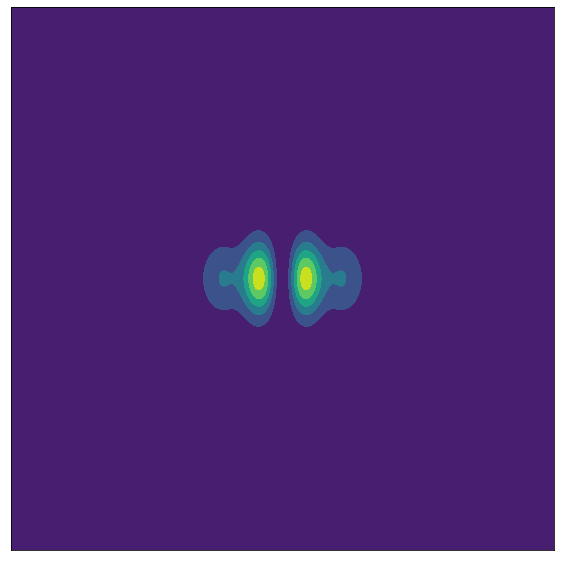
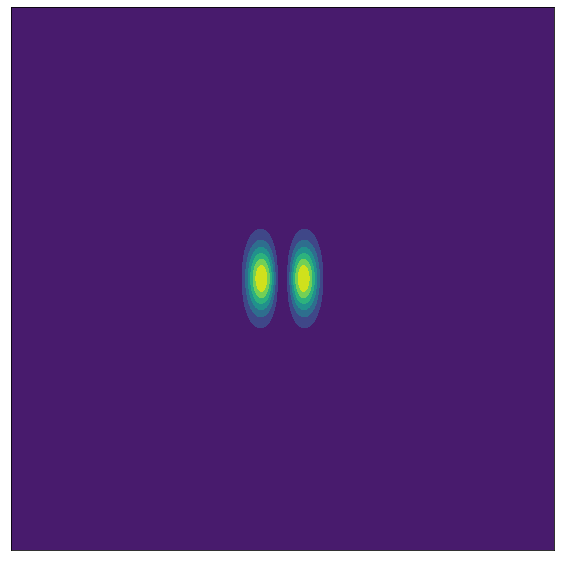
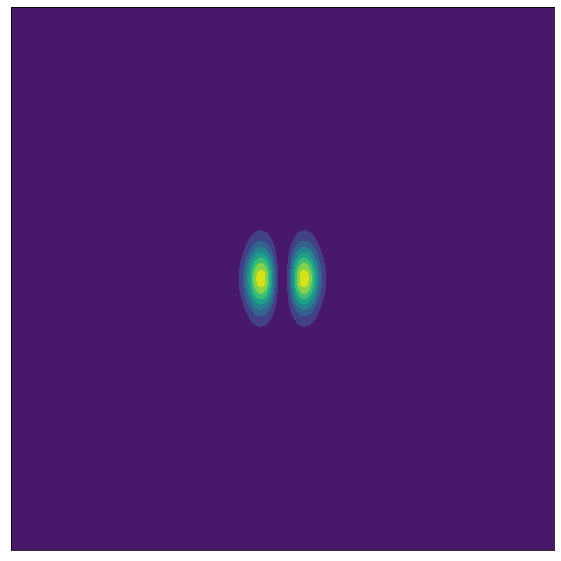
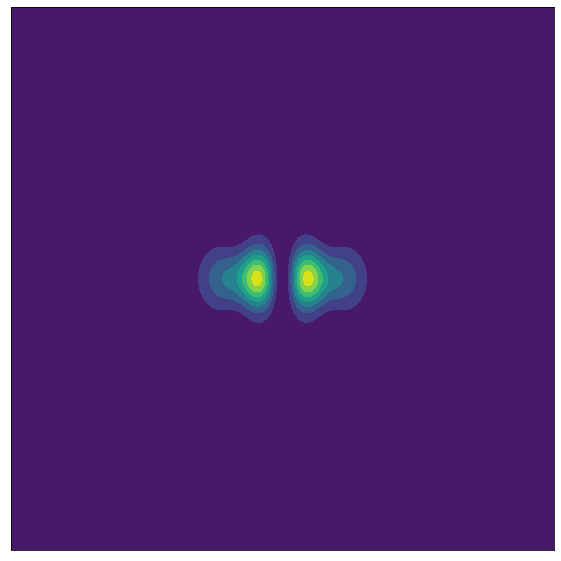
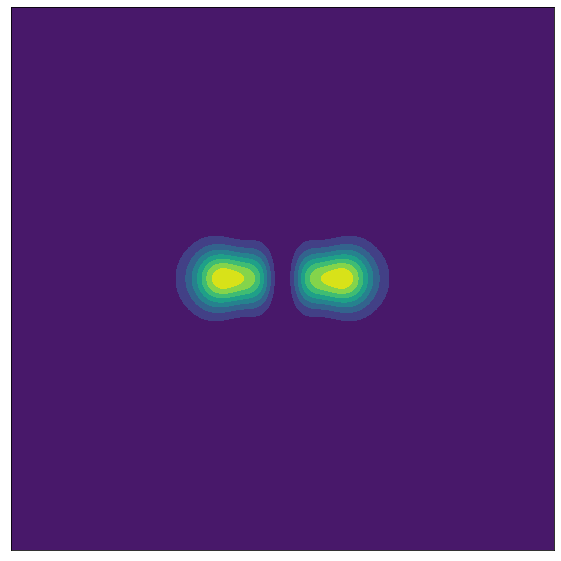
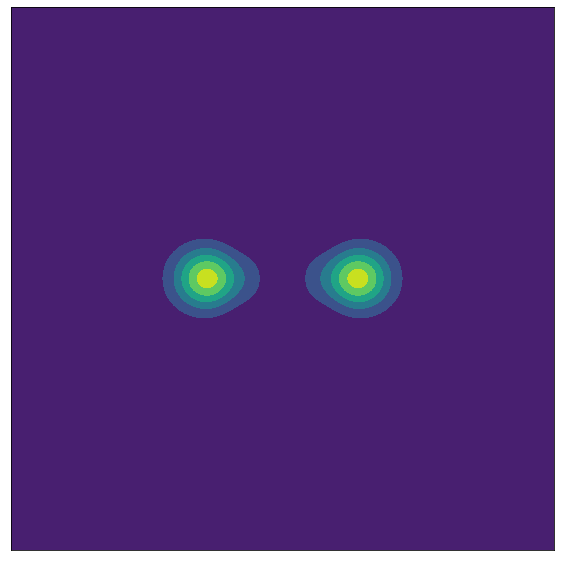
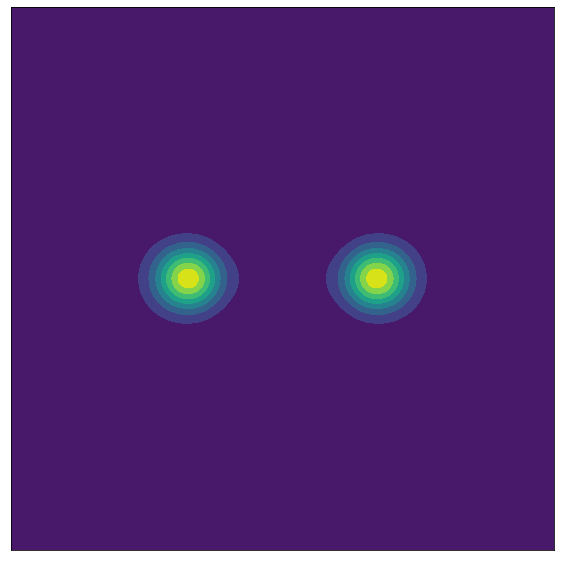
PySiUltralight, like its predecessor, is capable of simulating multiple solitons simultaneously. This is useful for studying how solitons merge and interact with one another. The setup that we consider in this section, of multiple interacting solitons goes beyond those explored in Chavanis (2016). Unlike the work where we were making direct comparisons with that paper, here we do not need to assume as prior an approximate shape of the soliton density profile and do not use the Gaussian ansatz. The first scenario we set up with multiple solitons is a binary soliton collision. The examples we use are idealized in that they are head-on collisions and the solitons are of equal mass, however, understanding binary collisions is important for understanding mergers. In Figs. 7 through 11, two solitons move towards each other. The setup differed only by a phase shift between solitons and the value of the self-coupling.
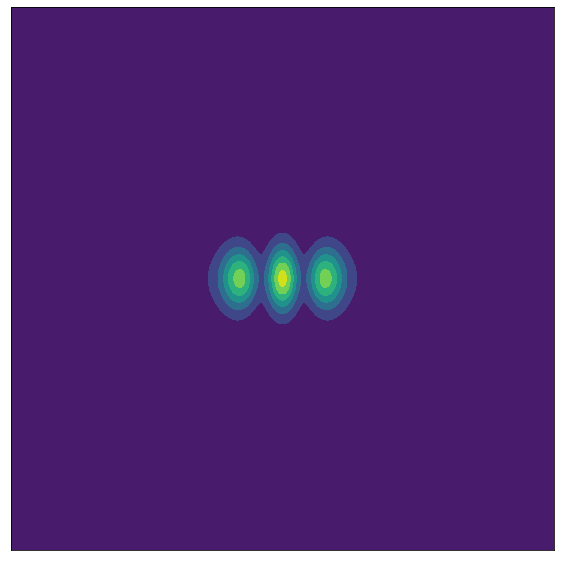
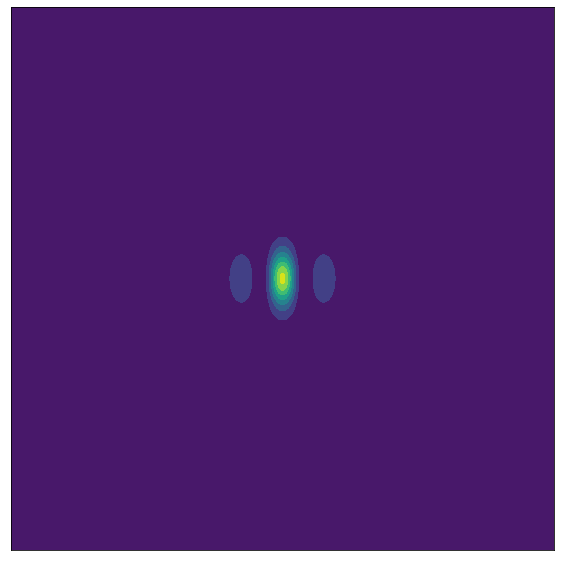
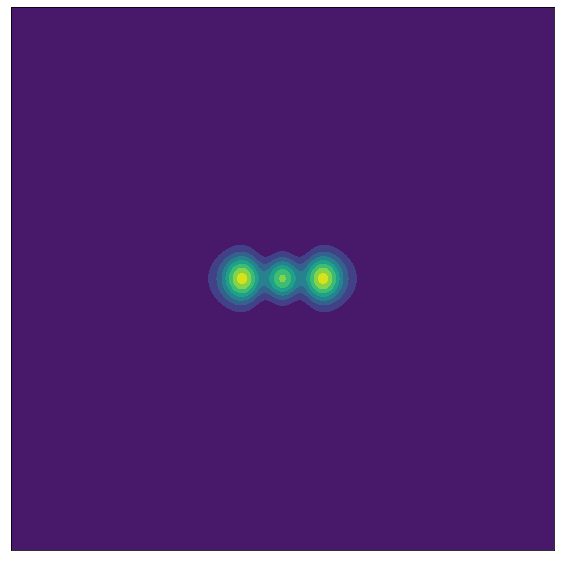
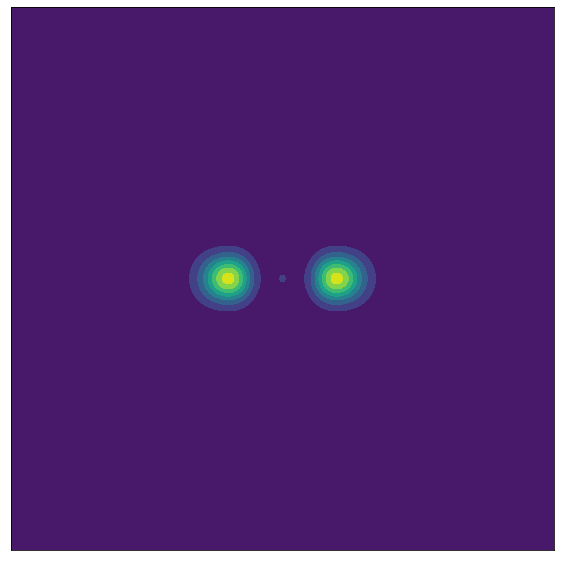
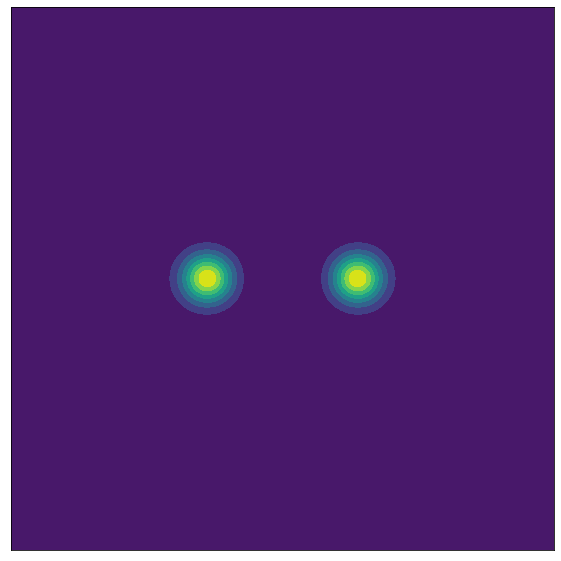
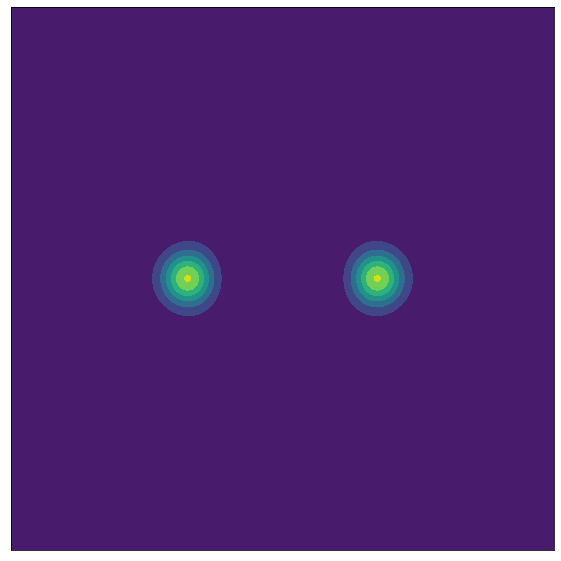
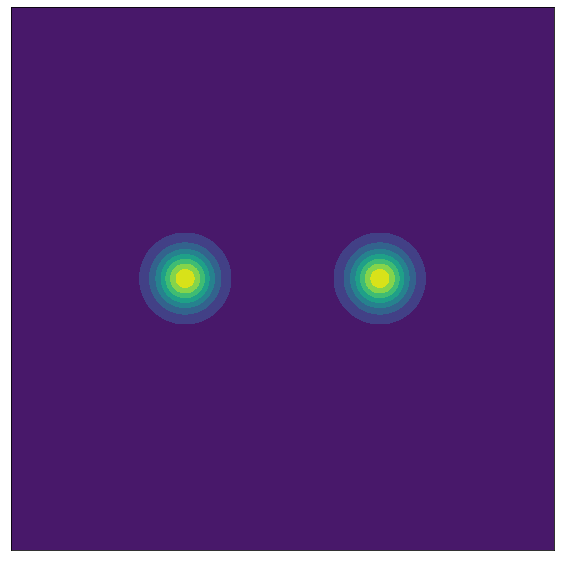
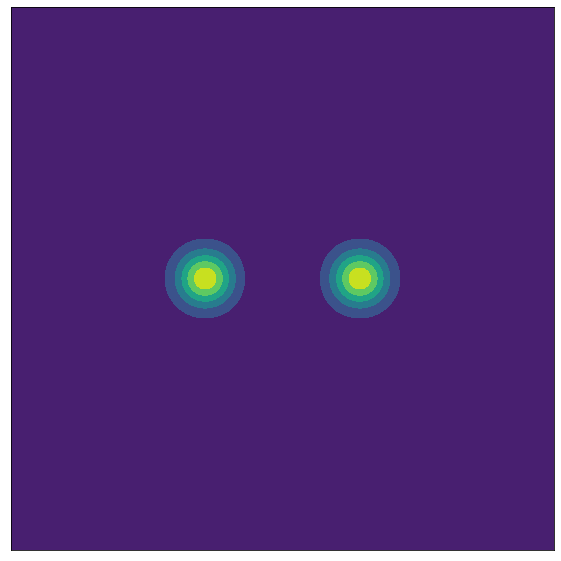
In all the figures, the initial setup has two solitons, each of 20 code mass units (), spaced 1.2 code units ( apart moving towards each other with a relative velocity of 20 code units (). The duration in all the simulations is 0.1 code units which is about . We chose this duration so that we would be able to compare our simulation results with those in Edwards et al. (2018). In the scenarios where there is an attractive self-interaction, corresponding to . When there are repulsive self-interactions, . This corresponds to . In these, the decay constant is . In these figures, the color scales are different in each frame in the same way that the scales are different in Fig. 4. These figures are useful schematically in understanding the behavior of these collisions.
| (a) No self-interactions |
| (b) Attractive self-interactions |
| (c) Repulsive self-interactions |
In Figs. 7, 7, and 9, there is no phase shift between solitons. The difference between these figures is that in Fig. 7 the solitons enter and leave the collision area unaltered while in Fig. 7 they are distorted. The solitons pass through each other unaffected which is to be expected when there is no self-interaction term. However, when there is an attractive self-interaction term, the solitons merge and then oscillate in size. There are only minor differences between Figs. 7 and 9. The biggest difference is that with the repulsive self-interaction, the resultant solitons are slightly larger in size. In Figs. 9, 11, and 11 there is a phase shift of between the two solitons. This phase shift creates an effective repulsive force between the solitons Paredes and Michinel (2016). As with the first three simulations, the main difference is how the solitons enter and exit the collision zone.
In Edwards et al. (2018), the authors run a simulation in PyUltraLight where a soliton rotates around a central potential. We recreated this and then included an attractive self-interaction to see what differences exist with this inclusion of a self-coupling. For the setup, an axion mass of was used, the box length was ten code units (, the duration was 0.4 code units (), the central mass was 1000 code units (), the soliton mass was 12 code units (), the starting distance away from the central mass was three code units (), and the initial tangential velocity was 16 code units (). Figure 12 shows three scenarios of a soliton orbiting around a central potential, one without self-interactions, one with an attractive self-interaction, and one with repulsive self-interactions. In this figure the colorful lines represent constant density contours. As the soliton rotates around the central mass, the soliton stretches as the parts of the soliton closer to the center rotate faster than the outside portions. When we include an attractive self-interaction, we can see the soliton is less disrupted than the case when there were no self-interactions. Simulations with repulsive self-interactions had the opposite effect in that the solitons became more spread out. These observations are important because they suggest self-interactions play a role in determining the lifetimes of solitons. It is important to note contours with the same colors at different times do not necessarily correspond to the same density. This is because each figure is made from overlaying different snapshots in time.
VI Conclusions
In this paper, we provide an outline for altering PyUltraLight to include self-interactions. We provided background information on the physics of ultralight dark matter and detailed the changes we made to PyUltraLight. We tested the altered program’s integrity by comparing the new version with the original version and by confirming energy was still conserved in the simulations. Using this altered version, we attempted to verify predictions made in Chavanis (2016) which quantified phenomena that one expects to see when ultralight dark matter has attractive self-interactions. The oscillation frequency results from our code behaved similarly to analytic predictions but had a different dynamical time. This discrepancy is likely caused by the approximate solution of the Gaussian profile being adjusted as the simulation progressed. We looked at the conditions needed to see exploding solitons by using an approximate Gaussian soliton profile. When the soliton mass was less than the critical mass and the starting soliton size was sufficiently small, we saw the soliton explode. The predictions for finding a maximum mass for a soliton with attractive self-interactions matched well.
We also ran simulations that compared situations with attractive self-interactions, repulsive self-interactions, and without self-interactions, including binary soliton collisions and solitons rotating around a central potential. Qualitatively, there were noticeable differences when self-interactions were introduced in these scenarios. The attractive self-interactions cause the solitons to more easily stick to one another which is to be expected. Attractive self-interactions also made it more difficult for the solitons to be tidally disrupted when the solitons rotated around the central potential. We also found that having repulsive self-interactions had the effect of spreading out the soliton profile more when orbiting a central potential. This effect may have an impact on the survival times of infalling solitons.
For future work, we would like to implement absorbing boundary conditions using a sponge layer. Another possible phenomenon to test using this code is the formation of vortices in a BEC which should occur with sufficiently large repulsive self-interactions Rindler-Daller and Shapiro (2012).
ACKNOWLEDGMENTS
We would like to thank Lisa Bouchard, Annika Peter, Arka Banerjee, Ethan Nadler, and Katelin Schutz for offering comments on this paper. We would like to thank Adam Dukehart for his insight on how the energy changes with the inclusion of self-interactions. We would also like to thank Ethan Nadler and J. Luna Zagorac for their helpful discussions about our simulations results. We thank Eli Levinson-Falk, Richard Easther, Brian Nord, Nathan Musoke, Anthony Mirasola, Kay Kirkpatrick, Ed Copeland, Risa Wechsler, and Juna Kollmeier for additional helpful conversations. C. P. W. would like to thank all workers who made this research possible, especially those at the University of New Hampshire (including Michelle Waltz and Katie Makem-Boucher), the Aspen Center for Physics, which is supported by National Science Foundation (NSF) Grant No. PHY-1607611, and the Kavli Institute for Theoretical Physics, where this research was supported in part by the NSF under Grant No. PHY-1748958. Contributions to this project by C. P. W. were also supported by DOE Grant No. DE-SC0020220. This paper honors the memory of Breonna Taylor.
References
- Buckley and Peter (2018) M. R. Buckley and A. H. G. Peter, Phys. Rept. 761, 1 (2018), arXiv:1712.06615 [astro-ph.CO] .
- Ade et al. (2016) P. A. R. Ade et al. (Planck), Astron. Astrophys. 594, A13 (2016), arXiv:1502.01589 [astro-ph.CO] .
- Schwabe et al. (2016) B. Schwabe, J. C. Niemeyer, and J. F. Engels, Phys. Rev. D 94, 043513 (2016), arXiv:1606.05151 [astro-ph.CO] .
- Armendariz-Picon and Neelakanta (2014) C. Armendariz-Picon and J. T. Neelakanta, JCAP 03, 049 (2014), arXiv:1309.6971 [astro-ph.CO] .
- Giesen et al. (2012) G. Giesen, J. Lesgourgues, B. Audren, and Y. Ali-Haimoud, JCAP 12, 008 (2012), arXiv:1209.0247 [astro-ph.CO] .
- Aghanim et al. (2020) N. Aghanim et al. (Planck), Astron. Astrophys. 641, A6 (2020), arXiv:1807.06209 [astro-ph.CO] .
- Del Popolo and Pace (2016) A. Del Popolo and F. Pace, Astrophys. Space Sci. 361, 162 (2016), [Erratum: Astrophys.Space Sci. 361, 225 (2016)], arXiv:1502.01947 [astro-ph.GA] .
- Marsh (2015) D. J. E. Marsh, Phys. Rev. D 91, 123520 (2015), arXiv:1504.00308 [astro-ph.CO] .
- Spergel and Steinhardt (2000) D. N. Spergel and P. J. Steinhardt, Phys. Rev. Lett. 84, 3760 (2000), arXiv:astro-ph/9909386 .
- Avila-Reese et al. (2001) V. Avila-Reese, P. Colin, O. Valenzuela, E. D’Onghia, and C. Firmani, Astrophys. J. 559, 516 (2001), arXiv:astro-ph/0010525 .
- Kamionkowski and Liddle (2000) M. Kamionkowski and A. R. Liddle, Phys. Rev. Lett. 84, 4525 (2000), arXiv:astro-ph/9911103 .
- Papastergis et al. (2015) E. Papastergis, R. Giovanelli, M. P. Haynes, and F. Shankar, Astron. Astrophys. 574, A113 (2015), arXiv:1407.4665 [astro-ph.GA] .
- Arvanitaki et al. (2010) A. Arvanitaki, S. Dimopoulos, S. Dubovsky, N. Kaloper, and J. March-Russell, Phys. Rev. D 81, 123530 (2010), arXiv:0905.4720 [hep-th] .
- Cicoli (2013) M. Cicoli, in 9th Patras Workshop on Axions, WIMPs and WISPs (Mainz, Germany, 2013) pp. 235–242, arXiv:1309.6988 [hep-th] .
- Peccei and Quinn (1977) R. D. Peccei and H. R. Quinn, Phys. Rev. Lett. 38, 1440 (1977).
- Guth et al. (2015) A. H. Guth, M. P. Hertzberg, and C. Prescod-Weinstein, Phys. Rev. D 92, 103513 (2015), arXiv:1412.5930 [astro-ph.CO] .
- Dine and Fischler (1983) M. Dine and W. Fischler, Phys. Lett. B 120, 137 (1983).
- Preskill et al. (1983) J. Preskill, M. B. Wise, and F. Wilczek, Phys. Lett. B 120, 127 (1983).
- Abbott and Sikivie (1983) L. F. Abbott and P. Sikivie, Phys. Lett. B 120, 133 (1983).
- Kim and Carosi (2010) J. E. Kim and G. Carosi, Rev. Mod. Phys. 82, 557 (2010), [Erratum: Rev.Mod.Phys. 91, 049902 (2019)], arXiv:0807.3125 [hep-ph] .
- Di Luzio et al. (2020) L. Di Luzio, M. Giannotti, E. Nardi, and L. Visinelli, Phys. Rept. 870, 1 (2020), arXiv:2003.01100 [hep-ph] .
- Alesini et al. (2019) D. Alesini et al., Phys. Rev. D 99, 101101 (2019), arXiv:1903.06547 [physics.ins-det] .
- Rudelius (2015) T. Rudelius, JCAP 09, 020 (2015), arXiv:1503.00795 [hep-th] .
- Hu et al. (2000) W. Hu, R. Barkana, and A. Gruzinov, Phys. Rev. Lett. 85, 1158 (2000).
- Hui et al. (2017) L. Hui, J. P. Ostriker, S. Tremaine, and E. Witten, Phys. Rev. D 95, 043541 (2017), arXiv:1610.08297 [astro-ph.CO] .
- Ringwald (2012) A. Ringwald, Phys. Dark Univ. 1, 116 (2012), arXiv:1210.5081 [hep-ph] .
- Madelung (1926) E. Madelung, Naturwissenschaften 14, 1004 (1926).
- Schive et al. (2014a) H.-Y. Schive, T. Chiueh, and T. Broadhurst, Nature Phys. 10, 496 (2014a), arXiv:1406.6586 [astro-ph.GA] .
- Schive et al. (2014b) H.-Y. Schive, M.-H. Liao, T.-P. Woo, S.-K. Wong, T. Chiueh, T. Broadhurst, and W. Y. P. Hwang, Phys. Rev. Lett. 113, 261302 (2014b), arXiv:1407.7762 [astro-ph.GA] .
- Peebles (2000) P. J. E. Peebles, Astrophys. J. Lett. 534, L127 (2000), arXiv:astro-ph/0002495 .
- Suárez and Chavanis (2018) A. Suárez and P.-H. Chavanis, Phys. Rev. D 98, 083529 (2018), arXiv:1710.10486 [gr-qc] .
- Vaquero et al. (2019) A. Vaquero, J. Redondo, and J. Stadler, JCAP 2019, 012 (2019), arXiv:1809.09241 [astro-ph.CO] .
- Kavanagh et al. (2020) B. J. Kavanagh, T. D. P. Edwards, L. Visinelli, and C. Weniger, (2020), arXiv:2011.05377 [astro-ph.GA] .
- Chavanis (2016) P.-H. Chavanis, Phys. Rev. D94, 083007 (2016), arXiv:1604.05904 [astro-ph.CO] .
- Fan (2016) J. Fan, Phys. Dark Univ. 14, 84 (2016), arXiv:1603.06580 [hep-ph] .
- Edwards et al. (2018) F. Edwards, E. Kendall, S. Hotchkiss, and R. Easther, JCAP 10, 027 (2018), arXiv:1807.04037 [astro-ph.CO] .
- Eby et al. (2020) J. Eby, M. Leembruggen, L. Street, P. Suranyi, and L. C. R. Wijewardhana, JCAP 10, 020 (2020), arXiv:2002.03022 [hep-ph] .
- Ollé et al. (2020) J. Ollé, O. Pujolàs, and F. Rompineve, JCAP 02, 006 (2020), arXiv:1906.06352 [hep-ph] .
- Kawasaki et al. (2020) M. Kawasaki, W. Nakano, and E. Sonomoto, JCAP 01, 047 (2020), arXiv:1909.10805 [astro-ph.CO] .
- Marsh (2016) D. J. E. Marsh, Phys. Rept. 643, 1 (2016), arXiv:1510.07633 [astro-ph.CO] .
- Baldeschi et al. (1983) M. R. Baldeschi, R. Ruffini, and G. B. Gelmini, Phys. Lett. B 122, 221 (1983).
- Ji and Sin (1994) S. U. Ji and S. J. Sin, Physical Review D 50, 3655– (1994).
- Lee and Koh (1996) J.-w. Lee and I.-g. Koh, Phys. Rev. D 53, 2236 (1996), arXiv:hep-ph/9507385 .
- Matos et al. (2000) T. Matos, F. S. Guzman, and L. A. Urena-Lopez, Class. Quant. Grav. 17, 1707 (2000), arXiv:astro-ph/9908152 .
- Lee (2016) J.-W. Lee, Phys. Lett. B 756, 166 (2016), arXiv:1511.06611 [astro-ph.GA] .
- Arbey et al. (2001) A. Arbey, J. Lesgourgues, and P. Salati, Phys. Rev. D 64, 123528 (2001), arXiv:astro-ph/0105564 .
- Alcubierre et al. (2002) M. Alcubierre, F. S. Guzman, T. Matos, D. Nunez, L. A. Urena-Lopez, and P. Wiederhold, Class. Quant. Grav. 19, 5017 (2002), arXiv:gr-qc/0110102 .
- Silverman and Mallett (2002) M. P. Silverman and R. L. Mallett, Gen. Rel. Grav. 34, 633 (2002).
- Arbey et al. (2003) A. Arbey, J. Lesgourgues, and P. Salati, Phys. Rev. D 68, 023511 (2003), arXiv:astro-ph/0301533 .
- Boehmer and Harko (2007) C. G. Boehmer and T. Harko, JCAP 06, 025 (2007), arXiv:0705.4158 [astro-ph] .
- Fukuyama et al. (2008) T. Fukuyama, M. Morikawa, and T. Tatekawa, JCAP 06, 033 (2008), arXiv:0705.3091 [astro-ph] .
- Sikivie and Yang (2009) P. Sikivie and Q. Yang, Phys. Rev. Lett. 103, 111301 (2009), arXiv:0901.1106 [hep-ph] .
- Lee and Lim (2010) J.-W. Lee and S. Lim, JCAP 01, 007 (2010), arXiv:0812.1342 [astro-ph] .
- Ruffini and Bonazzola (1969) R. Ruffini and S. Bonazzola, Phys. Rev. 187, 1767 (1969).
- Chavanis and Delfini (2011) P. H. Chavanis and L. Delfini, Phys. Rev. D 84, 043532 (2011), arXiv:1103.2054 [astro-ph.CO] .
- Amin and Mocz (2019) M. A. Amin and P. Mocz, Phys. Rev. D 100, 063507 (2019), arXiv:1902.07261 [astro-ph.CO] .
- Bao and Cai (2012) W. Bao and Y. Cai, arXiv e-prints , arXiv:1212.5341 (2012), arXiv:1212.5341 [cond-mat.quant-gas] .
- Desjacques et al. (2018) V. Desjacques, A. Kehagias, and A. Riotto, Phys. Rev. D 97, 023529 (2018), arXiv:1709.07946 [astro-ph.CO] .
- Kirkpatrick et al. (2020) K. Kirkpatrick, A. E. Mirasola, and C. Prescod-Weinstein, Phys. Rev. D 102, 103012 (2020), arXiv:2007.07438 [hep-ph] .
- Agrawal (2019) G. Agrawal, Nonlinear Fiber Optics (Academic Press, London, England, 2019).
- Chavanis (2011) P.-H. Chavanis, Phys. Rev. D 84, 043531 (2011), arXiv:1103.2050 [astro-ph.CO] .
- Eby et al. (2018) J. Eby, M. Leembruggen, L. Street, P. Suranyi, and L. C. R. Wijewardhana, Phys. Rev. D 98, 123013 (2018), arXiv:1809.08598 [hep-ph] .
- Eby et al. (2016) J. Eby, M. Leembruggen, P. Suranyi, and L. C. R. Wijewardhana, JHEP 12, 066 (2016), arXiv:1608.06911 [astro-ph.CO] .
- Chen et al. (2020) J. Chen, X. Du, E. W. Lentz, D. J. E. Marsh, and J. C. Niemeyer, (2020), arXiv:2011.01333 [astro-ph.CO] .
- Paredes and Michinel (2016) A. Paredes and H. Michinel, Phys. Dark Univ. 12, 50 (2016), arXiv:1512.05121 [astro-ph.CO] .
- Rindler-Daller and Shapiro (2012) T. Rindler-Daller and P. R. Shapiro, Mon. Not. Roy. Astron. Soc. 422, 135 (2012), arXiv:1106.1256 [astro-ph.CO] .