Multifrequency study of a double–double radio galaxy J00280035
Abstract
We report the discovery of a double–double radio source (DDRS) J00280035. We observed it with LOFAR, GMRT, and the VLA. By combining our observational data with those from the literature, we gathered an appreciable set of radio flux density measurements covering the range from 74 MHz to 14 GHz. This enabled us to carry out an extensive review of physical properties of the source and its dynamical evolution analysis. In particular, we found that, while the age of the large-scale outer lobes is about 245 Myr, the renewal of the jet activity, which is directly responsible for the double–double structure, took place only about 3.6 Myr ago after about 11 Myr long period of quiescence. Another important property typical for DDRSs and also present here is that the injection spectral indices for the inner and the outer pair of lobes are similar. The jet powers in J00280035 are similar too. Both these circumstances support our inference that it is, in fact, a DDRS which was not recognized as such so far because of the presence of a coincident compact object close to the inner double so that the centre of J00280035 is apparently a triple.
keywords:
radiation mechanisms: non-thermal — galaxies: active — galaxies: individual: J00280035 — galaxies: jets — radio continuum: galaxies1 Introduction
Intermittent nature of the activity is a well-known property of active galactic nuclei (AGN). The most compelling observable signature of cessation and subsequent restart of activity in a radio-loud AGN takes the form of a double–double radio source (DDRS) that consists of two co-linear pairs of radio lobes (Schoenmakers2000). The outer lobes develop during the earlier active period. Once the active nucleus becomes quiescent, the supply of relativistic particles via jets to the lobes is cut off, and they gradually fade out. Quiescence can last for up to yr (Komissarov1994). Nevertheless, having not been fuelled even for such a long time, the lobes may still be visible; they usually appear as diffuse relics. Meanwhile, the renewal of activity of the nucleus may occur, which leads to the creation of a new pair of lobes – the inner one. The possibility that they emerge before the outer lobes disappear is the reason why the overall radio structure is double–double.
Nearly a hundred of DDRSs are known to date (see e.g. Saikia2009; Nandi2012; Kuzmicz2017; Mahatma2019). Some of them have unusual properties. There are three objects with clear evidence of possessing even three pairs of lobes, so they are labelled triple-double radio sources. These are: J09294146 (Schoenmakers2000; Brocksopp2007), J14090302 (Speca; Hota2011), and J12160709 (Singh2016). Two DDRSs, J09350204 (4C 02.27; Jamrozy2009) and J07413112 (Siemiginowska2003), are hosted by quasars, whereas J23450449 (Bagchi2014) and again J14090302 – both of giant sizes – are hosted by spiral galaxies. Another exceptional case of restarting activity is the giant radio galaxy J23332343 (Hernandez2017) where the direction of the jet has changed in the new episode of nuclear activity; it points almost towards us now which makes this source a radio galaxy with a blazar host. J16474950 (SBS B1646499; Pajdosz2018) with large-scale diffuse lobes is also hosted by a blazar.

Surprisingly, a relatively small number of DDRSs were thoroughly studied. These are: 15483216 (Machalski2010), J14533308 (Konar2006), J00413224 and J18356204 (Konar2012; Konar2013), J13523126 (Machalski2016), and J17064340 for which Marecki2016 determined a range of astrophysical parameters such as dynamical and synchrotron ages, and the ambient medium characteristics. In particular, they found that the large-scale outer lobes of J17064340 are up to 300 Myr old whereas the renewal of the jet activity took place only about 12 Myr ago after about 27-Myr long period of quiescence. This result is yet another but very compelling proof that the explanation of the nature of DDRSs proposed by Schoenmakers2000 is correct. The correctness of their model can also be demonstrated when studying a sample of DDRSs selected from a large survey like Faint Images of the Radio Sky at Twenty centimetres (FIRST; Becker1995). This has been carried out in three steps. The initial selection was made by Proctor2011 who found 242 DDRS candidates. Secondly, 23 of them were verified as true DDRSs by Nandi2012. Finally, the sample was surveyed with the Giant Metrewave Radio Telescope (GMRT, Swarup1991) by Nandi2019. Using both 607-MHz and the FIRST images, they estimated spectral indices of the inner and the outer lobes of each source. For the vast majority of them, the spectra of their outer lobes were significantly steeper in line with Schoenmakers2000.
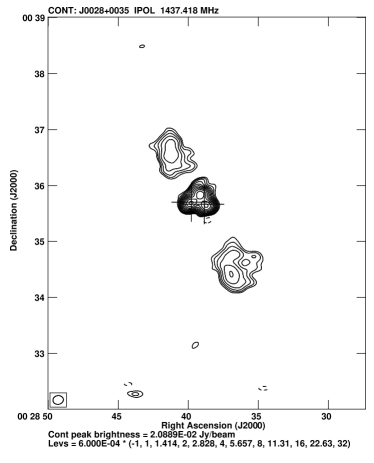
When searching FIRST for the large-scale structures centred on the objects from Roma-BZCAT, a multifrequency catalogue of blazars (Massaro2009), we discovered that the BL Lac object 5BZU J00280035, also known as SDSS J002839.77003542.2, not only was straddled by large-scale relic lobes but also accompanied by two other compact components located close enough to it (in terms of the angular distance) to be straddled by those relics as well. We suggest that the only way to interpret the triple structure at the centre of J00280035 – see Fig. 1 – is to assume that 5BZU J00280035 is a coincidence. It follows that since the relic lobes and the inner two components at RA , Dec. and RA , Dec. are co-linear, J00280035 could be a DDRS. In other words, it appears that this is because of the presence of 5BZU J00280035 that J00280035 was not recognized as a DDRS so far. To support the classification of J00280035 as a DDRS, its optical identification and higher resolution observations of its putative inner lobes are needed. Obviously, the host galaxy must lie between them. SDSS J002838.86003539.7 is the only candidate here; it is marked with the right-hand cross in Fig. 1. As for the radio morphology of the alleged inner lobes, revealing it is desirable because they are unresolved in the FIRST image (Fig. 1). Therefore, based on that image alone, it is not possible either to rule out the possibility that the inner triple is a result of e.g. gravitational lensing or to confirm whether the morphologies of the two western components are typical for the lobes. Owing to the observations we have carried out, we are able to address this issue. Furthermore, we analyse all available radio data on J00280035 in order to study its dynamics and energetics.
The paper is organized as follows. Multifrequency radio data are presented in Section 2. The dynamical analysis of each pair of radio lobes of J00280035 is elaborated upon in Section 3. The results are discussed in Section LABEL:discussion and summarized in Section LABEL:summary. For consistency with the analyses conducted in our earlier papers, the cosmological parameters by Spergel2003 are used throughout this article. Positions are given in the J2000.0 coordinate system.
| Frequency | Telescope/ | Date of | Beam size | Beam PA | rms | Reference | |
|---|---|---|---|---|---|---|---|
| (MHz) | Survey | observation | (arcsec) | (arcsec) | () | (mJy beam) | |
| (1) | (2) | (3) | (4) | (5) | (6) | (7) | |
| 73.8 | VLA-B/VLSSr | 2003 Sep. 20 | 75 | 75 | 0 | 180.7 | 1 |
| 76–227 | MWA/GLEAM | 2013 Nov. 15 | 324.2 – 118.0 | 295.7 – 106.6 | 95 – 20 | 2 | |
| 143.7 | LOFAR HBA | 2017 Aug. 18 | 14.54 | 6.25 | 76.1 | 1.0 | p |
| 147.6 | LOFAR HBA | 2017 Aug. 18 | 12 | 12 | 0 | 1.7 | p |
| 322.7 | GMRT | 2017 Sep. 14 | 9.43 | 7.79 | 74.73 | 0.09978 | p |
| 607.7 | GMRT | 2017 Sep. 10 | 5.34 | 4.14 | 61.39 | 0.1135 | p |
| 607.7 | GMRT | 2017 Sep. 10 | 12.49 | 7.95 | 36.36 | 0.2375 | p |
| 1400.0 | VLA-D/NVSS | 1993 Nov. 15 | 45 | 45 | 0 | 0.45 | 3 |
| 1400.0 | VLA-B/FIRST | 1995 Sep. 23 | 6.40 | 5.4 | 0 | 0.11 | 4 |
| 1437.4 | GMRT | 2017 Sep. 5 | 4.37 | 3.60 | 82.09 | 0.0788 | p |
| 1519.4 | VLA-A | 2018 Apr. 18 | 2.47 | 1.01 | 50.95 | 0.0895 | p |
| 3000.0 | VLA-B/VLASS | 2017 Sep. 29 | 2.76 | 2.16 | 7.52 | 0.1033 | 5 |
| 4850.0 | Green Bank 91m/87GB | 1986-1987 | 222 | 194 | 0 | 5 | 6 |
| 5469.1 | VLA-C | 2018 Nov. 21 | 7.78 | 3.02 | 51.77 | 0.0130 | p |
| 5494.0 | VLA-A | 2018 Apr. 2 | 0.75 | 0.30 | 53.44 | 0.0138 | p |
| 9016.8 | VLA-D | 2018 Sep. 12 | 15.87 | 7.21 | 49.36 | 0.0160 | p |
| 14014.9 | VLA-D | 2018 Sep. 12 | 9.68 | 4.38 | 49.12 | 0.016 | p |
References – (1) Lane2014; (2) Hurley-Walker2017; (3) Condon1998; (4) Becker1995; (5) Lacy2020; (6) Gregory1991; (p) this paper. Data in this line has been extracted from the tapered map.
2 Radio data on J00280035
Here, we present high-resolution images of the putative inner lobes and new images of the overall radio structure of J00280035 resulting from our observations with LOw-Frequency ARray (LOFAR, vanhaarlem2013), GMRT, and the Karl G. Jansky Very Large Array (VLA). Based on that material and the literature, we have collected radio flux densities in the range from 74 MHz to 14 GHz for all components of J00280035. Our data base is characterized in Table 1.
2.1 LOFAR observations
Dedicated observations of J00280035 with LOFAR (project code: LC8_007) were conducted in August 2017 (for details see Table 1) in cooperation with the LOFAR Two-metre Sky Survey (LoTSS) Tier-1 Team – see Shimwell2017 for the survey description. We observed the target in the HBA low-band Dual Inner mode using 24 core and 14 remote LOFAR stations. Total integration time was 8 h, including 10% overhead, with one-second integration time, 244 subbands with 16 channels per subband in 110–190 MHz filter with 200-MHz clock speed. To mitigate the influence of the ionosphere, we required the target’s elevation to be over above the horizon during the observations. Source 3C 48 was used as a flux density and bandpass calibrator in 10-min runs at the beginning and the end of the observations.

Standard reduction as well as flux density, phase, and bandpass calibration were provided by the Radio Observatory and the Tier-1 Survey Team. Due to low observing frequency, large field of view of the instrument (5), and low declination of the target, we decided to increase the accuracy of the final map through the PreFactor pipeline,111https://github.com/lofar-astron/prefactor/ which prepares the data to any direction-dependent calibration and includes i.a. advanced flagging and removal of the initial clock offsets between the core and remote stations. Then, we applied the direction-dependent LOFAR Facet Calibration described in Weeren2016. Both pipelines were run on CEP3 cluster allocated by the LOFAR Program Committee and the International LOFAR Telescope (ILT) director during the regular proposal evaluation stage. Apart from that, direction-dependent calibration and imaging were provided by the Tier-1 Survey Team with the use of ddf-pipeline.222https://github.com/mhardcastle/ddf-pipeline/ We were able to resolve the central region of J00280035 using Facet Calibration method whereas the extended, diffuse lobes were better calibrated and imaged with ddf-pipeline. The latter also allowed for better handling of interference from strong (above 1.3 Jy at 147.6 MHz) northern source 4C 00.03. The resolutions of the maps attained after application of Facet Calibration and ddf-pipeline were 14.54 6.25 arcsec and 12 12 arcsec, respectively, with the corresponding rms noise levels of 1 and 1.7 mJy beam.
The LOFAR image of the total structure of J00280035 is shown in Fig. 2 that also features a relatively strong coincident source towards north-east from the target source, afterwards referred to as conf. NE. The reference to the figure where the central structure of J00280035 observed with LOFAR is shown is given at the end of Section 2.3. The flux density measurements for different components of the target source and the conf. NE are shown in Table 2.
| Frequency | Flux density (mJy) | Reference | |||||||
|---|---|---|---|---|---|---|---|---|---|
| (MHz) | Total structure | ————— Central structure —————– | Outer structure | ||||||
| Conf. NE | SW lobe | NE lobe | Core | Blazar | SW lobe | NE lobe | |||
| (1) | (2) | (3) | (4) | (5) | (6) | (7) | (8) | (9) | (10) |
| 1 | |||||||||
| 73.8 | 2 | ||||||||
| 76 | 2 | ||||||||
| 84 | 2 | ||||||||
| 91.5 | 2 | ||||||||
| 99 | 2 | ||||||||
| 107 | 2 | ||||||||
| 114.5 | 2 | ||||||||
| 122 | 2 | ||||||||
| 130 | 2 | ||||||||
| 143 | 2 | ||||||||
| 143.7 | p | ||||||||
| 147.6 | p | ||||||||
| 150.5 | 2 | ||||||||
| 158 | 2 | ||||||||
| 166 | 2 | ||||||||
| 173.5 | 2 | ||||||||
| 181 | 2 | ||||||||
| 189 | 2 | ||||||||
| 196.5 | 2 | ||||||||
| 200.5 | 2 | ||||||||
| 204 | 2 | ||||||||
| 212 | 2 | ||||||||
| 219.5 | 2 | ||||||||
| 227 | 2 | ||||||||
| 322.7 | p | ||||||||
| 607.7 | p | ||||||||
| 607.7 | p | ||||||||
| 1400.0 | 3 | ||||||||
| 1400.0 | 4 | ||||||||
| 1437.4 | p | ||||||||
| 1519.4 | p | ||||||||
| 3000.0 | 5 | ||||||||
| 4850.0 | 6 | ||||||||
| 5469.0 | p | ||||||||
| 5494.0 | p | ||||||||
| 9016.8 | p | ||||||||
| 14014.9 | p | ||||||||
References – (1) Lane2014; (2) Hurley-Walker2017; (3) Condon1998; (4) Becker1995; (5) Lacy2020; (6) Gregory1991; (p) this paper. The original flux density of the VLSSr survey (RBC scale; Roger1973) was multiplied by a factor of 0.9 to suit the Baars1977 scale. This has been taken from the tapered map. This measurement includes also the core flux density. This measurement is from the combined (with IMERG) FIRST and NVSS map.


2.2 GMRT observations
We performed dedicated observations of J00280035 with GMRT in three frequency bands centred at: 323, 608, and 1437 MHz. The project code was 32_008. The observations were conducted in September 2017 (for details see Table 1). Data were recorded with 8-s integration time with the frequency band of 33.3 MHz divided into 512 channels at 323 and 608 MHz or 256 channels at 1437 MHz. The usual scheme of observing phase calibrator interlaced with the observation of the target source was adopted. Phase calibrator J00220014 (4C 00.02) was used at each of the observed frequencies. Flux density calibrator 3C 48 was observed for about 15 min at the beginning and at the end of observing at each frequency. The total integration time on the target source, which consisted of several 30-min exposures, was about 6.5, 2.5, and 5.5 h at 323, 608, and 1437 MHz, respectively.
The 323 and 608 MHz data reduction was carried out following standard calibration and reduction procedures in Astronomical Image Processing System (aips).333https://aips.nrao.edu/ The data processing was automated with a pipeline based on the Source Peeling and Atmospheric Modeling (SPAM) package (IntemaPhD2009; Intema2014; Intema2009) that includes direction-dependent calibration, modelling, and corrections for dispersive phase delay which is mainly of ionospheric origin. Data were edited for strong radio frequency interference and then standard flux density, phase, and bandpass calibrations were applied to the source. To produce deconvolved images, we used aips IMAGR task in which we subdivided the field of view covering the primary beam into a number of facets. To obtain an image that presents the diffuse outer lobes at 608 MHz properly, we tapered the data at 20 so that the restoring beam is 12.49 7.95 arcsec. Several rounds of phase-based self-calibration were performed. The resultant image was then corrected for the primary beam using aips PBCOR task.
The 1437-MHz data were automatically flagged, reduced, and calibrated with package casa (Common Astronomy Software Applications),444https://casa.nrao.edu/ using a pipeline originally developed by Russ Taylor in 2011 and modified by Ishwara-Chandra2020. The resulting image was obtained using casa task tclean and its quality was improved using self-calibration. We tapered the original uv-data to extract the diffuse lobes with the restoring beam of 11.17 9.35 arcsec. The image was also corrected for the primary beam.
The GMRT images are shown in Fig. 3555For consistency, all its panels were plotted with aips utility regardless of whether the images were generated in aips or in casa.. Owing to tapering of 608 and 1437 MHz ones, their resolution is comparable to that of the 323-MHz image (9.43 7.79 arcsec). The flux density measurements and their errors are shown in Table 2. The flux density calibration errors are assumed to be 10% at all three frequencies.
2.3 VLA observations
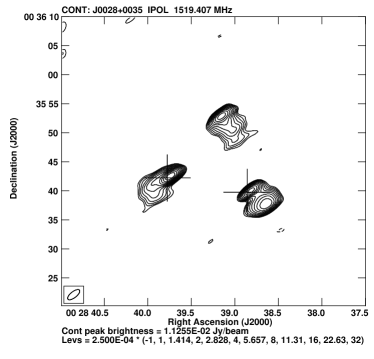
Five dedicated observations of J00280035 with the VLA in three configurations at four frequencies were conducted. They are listed in Table 1 in the lines denoted with ‘VLA-A’, ‘VLA-C’, and ‘VLA-D’ in column 2. Standard continuum processing with VLA casa Calibration Pipeline was carried out. Final images were obtained with aips task IMAGR. Fig. 4 presents the overall structure of J00280035 at 5469 and 9017 MHz but with unresolved inner lobes whereas in Fig. 5, the inner lobes are shown in full detail while the outer lobes are not present either due to the ‘missing flux’ effect caused by the resolution in A conf. (lower panels) or due to steepness of the spectrum of the outer lobes so that they are not visible at 14 GHz (upper right-hand panel). The LOFAR image of the inner triple has been included as the fourth, upper left-hand panel of Fig. 5. The flux density measurements for different components of the target source and the errors of those measurements are shown in Table 2.
2.4 Data extracted from surveys
In Table 2, we also display a number of data from the literature. The lowest frequency at which we have data for our target is 74 MHz. We used the VLA Low-Frequency Sky Survey redux (VLSSr; Lane2012; Lane2014) that covers the sky north of declination . The VLSSr represents a major improvement (e.g. correction of the ionospheric distortions and increase of dynamic range, as well as revision of the primary beam correction) to the original VLSS (Cohen2007). The VLSSr has a resolution of 75 75 arcsec and an average map rms noise level of 0.1 Jy beam. The VLSSr maps and catalogue use the Roger1973 flux density scale.
The second public survey we used was the GaLactic and Extragalactic All-sky MWA (GLEAM) survey carried out with the Murchison Wide-field Array (MWA; Lonsdale2009; Tingay2013). GLEAM extends to the entire sky south of declination and is described in detail by Wayth2015. The survey covers the frequency range between 72 and 231 MHz with the bandwidth of 7.7 MHz. The angular resolution of the survey is at 154 MHz. The GLEAM data – both the images and the catalogue (Hurley-Walker2017) – are publicly accessible on the MWA Telescope website.666http://www.mwatelescope.org/gleam
J00280035 is well visible in the map of the TIFR GMRT Sky Survey (TGSS) First Alternative Data Release (ADR1; Intema2017) conducted at 147.5 MHz. However, the TGSS ADR1 data were compiled without the short-baseline visibilities within 0.2 k from the centre of the (u,v)-plane of GMRT. For this reason, extended structures could not be properly imagined and can have underestimated flux densities. Indeed, the flux density of the whole structure of J00280035 extracted from the TGSS ADR1 map is mJy. This is much below the flux density measured at similar frequencies with GLEAM and LOFAR – see Table 2. Therefore, we did not use the TGSS ADR1 data in our multifrequency analysis.
We also made use of three large VLA surveys: FIRST, NRAO VLA Sky Survey (NVSS; Condon1998), and VLA Sky Survey (VLASS). At 1400 MHz, we used images extracted from FIRST and NVSS. Since about 60 per cent of the flux density is lost in the high-resolution FIRST maps, the FIRST and NVSS images were combined using aips task IMERG. The final merged maps were checked for flux density consistency by comparing the flux density of point sources in the FIRST and merged maps. The differences did not exceed 1 per cent. The 3-GHz data we used come from VLASS, an all-sky (north of declination ) survey resulting from observations with the VLA in B-array configuration conducted in a broad bandwidth of GHz with the angular resolution 2.5 arcsec and final sensitivity of 70 Jy beam. The VLASS observations began in September 2017 and will finish in 2024. The data of Stokes I, Q, U parameters will be taken in three epochs to allow for the discovery of variable and transient radio sources. Lacy2020 presented the science case, the observational strategy for VLASS, and the results from early survey observations. Early results in the form of Quick Look images of Stokes I, which use a relatively simple imaging algorithm that results however in limits on the accuracy, are publicly available.777https://science.nrao.edu/vlass/vlass-data
2.5 Radio morphology of J00280035
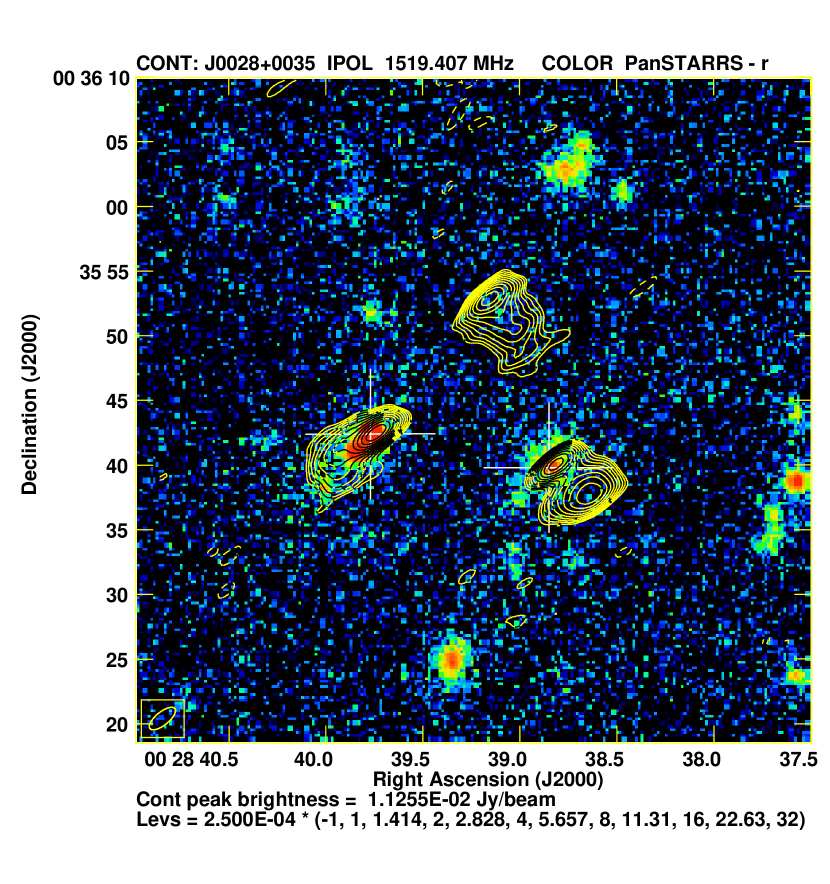
The VLA A conf. images (Fig. 5, lower panels) unveil the structure of the apparent inner triple. Additionally, we overlaid the 1519 MHz VLA A conf. image (contours) onto PanSTARRS888https://panstarrs.stsci.edu/ -band image (Flewelling2020) – see Fig. 6. If the eastern component identified with 5BZU J00280035 is ignored, the remaining two are clearly an FR II-type mini-double hence J00280035 as a whole is, in fact, a DDRS. As seen in these images, 5BZU J00280035 is of core-jet type. Given such morphological diversity of those components, the possibility that the inner triple of J0028+0035 is a result of gravitational lensing is unlikely. The feature identified with SDSS J002838.86003539.7 appears as a separate object in the 5.5 GHz A conf. image (Fig. 5, lower right-hand panel). Although it is located highly asymmetrically between the inner lobes, it might be the core given that such extreme arm-length ratios are encountered in double-lobed radio sources like 3C 254 (Thomasson2006) or 3C 459 (Thomasson2003). It follows that SDSS J002838.86003539.7 is the host galaxy of J00280035. Its spectroscopic redshift extracted from SDSS DR16 (SDSSDR16) amounts to . It must be noted at this point that the SDSS DR16 spectroscopic redshift of 5BZU J00280035 amounts to . The self-evident discrepancy between these two redshifts supports our inference that 5BZU J00280035 must be a coincidence.
The host galaxy redshift yields the scale of 5.33 kpc arcsec thus the projected span of the outer lobes is 1093 kpc while that of the inner lobes as measured in the 5.5 GHz VLA A conf. image is 93 kpc. These projected sizes translate to lobe lengths indicated in Table 3 for the assumed jet viewing angle. It follows that J00280035 is a giant radio galaxy – see Dabhade2020, and references therein.


2.6 Radio spectra of J00280035
All the data itemized in Table 2 have been used to construct radio spectra of individual components of the entire observed structure of J00280035, i.e. both pairs of its inner and outer lobes, as well as two confusing sources: the blazar in the vicinity of the inner double and the one labelled conf. NE. The latter one cannot be ignored since it is overlain by the MWA GLEAM beam size at the lowest observing frequencies of 76, 84, and 92 MHz. The resulting spectra of the core, the blazar, and conf. NE are confronted in Fig. 7 with the total structure data (column 2 in Table 2). It shows that the blazar spectrum is described by a pure power-law function (solid line), while the spectrum of the conf. NE source is strongly aged (dotted curve determined with a polynomial function ).
3 Dynamical evolution analysis
3.1 Numerical code
Similarly to Machalski2009; Machalski2010; Machalski2011; Marecki2016, we carried out a dynamical analysis using dynage code (Machalski2007). It is a numerical implementation of an analytical model of the evolution of FRII-type radio source that combines the pure dynamical model of KaiserAlexander1997 and the Kaiser1997 (KDA) model of expected radio emission from a source under the influence of the energy loss processes. For a given set of observables, the code allows for solving the inverse problem, i.e. to determine four free parameters of the KDA model (see Table 3): (1) the initial power-law energy distribution of the relativistic electrons related to the effective injection spectral index , (2) the jet power , (3) the density of the external gaseous medium near the radio core , and (4) the age of the source’s radio structure . This is obtained by fitting the model to the four observables, including the length and the volume of the lobes, and their radio spectrum, i.e. the slope and normalization at a number of observing frequencies.
3.2 Application of the model and fitting procedure
The analytical model described in Section 3.1 has been applied independently for the inner and outer lobes of J00280035. The set of the model parameters with their values assumed for the given pair of lobes is shown in Table 3.
3.2.1 Inner lobes
As a first step, we apply the model to the observational data of the inner lobes because they are determined more precisely than those for the outer ones (columns 4 and 5 vs. columns 8 and 9 of Table 2, respectively). Although the spectra of both inner lobes have been derived, the flux densities of the SW lobe are confused by the radio core at frequencies above 1.5 GHz (column 4 in Table 2). While extraction of the core’s spectrum between 1.5 and 5.5 GHz (column 6 in Table 2) has been successful, its extension towards lower frequencies is problematic. An effort made to estimate the core excess in flux densities in column (4) of Table 2, aroused suspicion of a high symmetry in the luminosities of both inner lobes. Unlike in the case of DDRS J17064340 (Marecki2016) where luminosities of the inner lobes are highly asymmetric, the inner lobes of J00280035 show unusually asymmetric separation from the core. It is obvious that such asymmetries induce significantly different values of the model parameters for individual lobes. We thus apply the modelling procedure to the whole inner structure setting up its spectrum as a double of the flux densities in column (5) of Table 2 and using one half of the sum of the opposite lobes’ lengths.
Following Marecki2016, we investigate two alternative models. In the first one, a power-law density distribution of the external gaseous medium with a standard exponent is assumed, while in the other one we assume that the inner lobes evolve into an almost uniform medium with inside a cocoon formed and inflated by the material of the primary jet flow. We also assume that the lobes are filled with magnetic fields and relativistic particles governed by a relativistic equation of state . The best-fitting models results are shown in columns (3) and (4) of Table 5 (predicted flux densities) and in columns (2) and (3) of Table 6 (predicted values of the main model and derivative physical parameters of the inner lobes’ structure). The resulting best-fitted spectrum of these lobes – which is almost the same in both models either with or with ) – is shown in Fig. 8 (dashed curve).
3.2.2 Outer lobes
As shown in Table 2, the flux densities of the pair of outer lobes are determined at the observing frequency range from 323 MHz up to 9 GHz and supported with the data at the LOFAR HBA frequencies. However, the GLEAM survey data enable supplementing the spectrum of those lobes in the range between 76 and 220 MHz. In order to carry out such a procedure, especially at the lowest frequencies range, we subtract the sum of the inner lobes model fit (column 2 of Table 4; also cf. columns 3 and 4 of Table 5), the blazar extrapolated power-law fit (column 3 of Table 4), and the polynomial-form fit to the GLEAM data (column 4 of Table 4) from the flux densities in column 2 of Table 2.
Likewise to the inner structure, the best-fitting-model-predicted flux densities are shown in column 6 of Table 5 and the model and derivative parameters are shown in column 4 of Table 6. Similarly, the resulting spectrum of the outer lobes is shown in Fig. 8 (solid curve).
| Parameter | Symbol | Inner lobes | Outer lobes |
| (1) | (2) | (3) | (4) |
| Observed | |||
| Angular size of lobe () | 17.4 arcsec | 205 arcsec | |
| Length of lobe () | 99 kpc | 1163 kpc | |
| Aspect ratio of lobe | 3.5 | 2.6 | |
| Radio spectrum; i.e. monochromatic | |||
| luminosity at a number of observing | |||
| frequencies; … | Note(1) | Note(2) | |
| Set | |||
| Adiabatic index of jet material | 4/3 | 4/3 | |
| Adiabatic index of lobe material | 4/3 | 5/3 | |
| Adiabatic index of ambient medium | 5/3 | 5/3 | |
| Adiabatic index of magnetic field | 4/3 | 4/3 | |
| Minimum of initial electron Lorentz factor | 1 | 1 | |
| Maximum of initial electron Lorentz factor | 10 | 10 | |
| Core radius of ambient density distribution | 2 kpc | 2 kpc | |
| Exponent of ambient density distribution | 1.5, 0.1 | 1.5 | |
| Jet viewing angle | 70 | 70 | |
| Free | |||
| Jet power | (W) | ||
| External density at core radius | (kg m) | ||
| Exponent of initial power-law energy | |||
| distribution of relativistic electrons | |||
| Source (lobe) age | (Myr) |
(1) and (2) – relevant luminosities are calculated with observed flux densities shown in columns 3 and 5 of Table 5, respectively.
| Frequency | Inner lobes | Blazar | Conf. NE | Sum of column | Outer lobes | |
|---|---|---|---|---|---|---|
| MHz | model fit | lin.extrap. | exp.func.fit. | (2)+(3)+(4) | GLEAM data–Sum | |
| (1) | (2) | (3) | (4) | (5) | (6) | |
| 76 | 259.0 | 113.3 | 262.3 | 634.6 | 947.0 | |
| 84 | 242.7 | 107.2 | 245.8 | 595.7 | 867.9 | |
| 91.5 | 229.6 | 102.2 | 230.8 | 562.6 | 735.0 | |
| 114.5 | 198.5 | 90.3 | – | 288.8 | 703.7 | |
| 150.5 | 166.0 | 77.6 | – | 243.6 | 550.2 | |
| 173.5 | 151.2 | 71.7 | – | 222.9 | 483.7 | |
| 200.5 | 137.5 | 66.2 | – | 203.7 | 381.8 | |
| 219.5 | 129.5 | 63.0 | – | 192.5 | 361.0 |
| Frequency | Inner lobes | M odel fit | Outer lobes | Model fit | |||||
| (MHz) | |||||||||
| (1) | (2) | (3) | (4) | (5) | (6) | ||||
| 76 | 259.0 | 947184 | 985.7 | ||||||
| 84 | 242.7 | 868165 | 897.2 | ||||||
| 91.5 | 229.6 | 735147 | 827.3 | ||||||
| 114.5 | 198.5 | 704109 | 667.5 | ||||||
| 147.6 | 182.523 | 167.8 | 165.4 | 46871 | 519.3 | ||||
| 150.5 | 166.0 | 55085 | 510.7 | ||||||
| 173.5 | 151.2 | 48378 | 443.6 | ||||||
| 200.5 | 137.5 | 38263 | 383.7 | ||||||
| 219.5 | 129.5 | 36160 | 350.2 | ||||||
| 322.7 | 97.813.1 | 100.3 | 99.3 | 19320 | 236.1 | ||||
| 607.7 | 55.07.8 | 65.4 | 65.3 | 10511 | 121.3 | ||||
| 1400.0 | 33.04.0 | 36.7 | 37.0 | 52.75.5 | 48.7 | ||||
| 1437.4 | 36.84.6 | 36.0 | 36.4 | 52.85.5 | 47.3 | ||||
| 1519.4 | 35.84.5 | 34.6 | 35.0 | ||||||
| 3000.0 | 20.22.7 | 21.1 | 21.4 | ||||||
| 5469.1 | 13.41.8 | 13.4 | 13.6 | 101 | 9.3 | ||||
| 9016.8 | 9.21.3 | 9.0 | 8.9 | 4.40.4 | 4.4 | ||||
| 14014.9 | 6.60.8 | 6.3 | 6.1 | ||||||
| 0.494 | 0.572 | 0.805 | |||||||
The model predicted flux densities shown in column 2 of Table 4.
The flux densities extracted from the GLEAM data base (cf. column 6 in Table 4).
| Parameters | Inner lobes | Outer lobes | ||
|---|---|---|---|---|
| (1) | (2) | (3) | (4) | |
| Model | ||||
| 0.63 | 0.64 | 0.59 | ||
| W) | 2.17 | 2.29 | 2.20 | |
| kg m) | 0.081 | 0.0048 | 2.67 | |
| (Myr) | – | – | 245 | |
| (Myr) | 3.2 | 3.6 | 234 | |
| Derivative | ||||
| 43.2 | 27.4 | 6.77 | ||
| kg m) | 0.066 | 0.3475 | 0.054 | |
| N m) | 7.60 | 6.78 | 0.26 | |
| (nT) | 1.61 | 1.52 | 0.28 | |
| Source | M | l | l | Q | Q | Reference | ||||||
|---|---|---|---|---|---|---|---|---|---|---|---|---|
| J2000 name | (M) | (kpc) | (kpc) | (Myr) | (Myr) | (Myr) | ( W) | ( W) | ||||
| (1) | (2) | (3) | (4) | (5) | (6) | (7) | (8) | (9) | (10) | (11) | (12) | (13) |
| J00280035 | 0.3985 | 8.16 | 93 | 1093 | 0.64 | 0.59 | 3.6 | 245 | 11 | 2.29 | 2.20 | p |
| J00413224 | 0.45 | – | 172 | 974 | 0.60 | 0.62 | 4.0 | 105 | 11 | 2.49 | 14.4 | 1 |
| J01164722 | 0.1461 | – | 445 | 1441 | 1.0028.00 | 66236 | 1.465.4 | – | – | 2, 7 | ||
| J08402949 | 0.0647 | 8.32 | 39 | 533 | 0.1233.00 | 2.0102.0 | – | – | 3, 7 | |||
| J11582621 | 0.1121 | 7.96 | 139 | 484 | 0.504.90 | 113 | 6.611.0 | – | 1.7 | 2, 7 | ||
| J13523126 | 0.045 | 8.15 | 1 | 180 | 0.59 | 0.61 | 0.3 | 62 | 0.7 | 0.21 | 0.21 | 4 |
| J14533308 | 0.2482 | 9.02 | 159 | 1299 | 0.66 | 0.50 | 5.0 | 104 | 24 | 0.32 | 3.92 | 1 |
| J15483216 | 0.1082 | – | 312 | 962 | 0.61 | 0.51 | 9.2 | 132 | 30 | 0.14 | 1.59 | 1 |
| J17064340 | 0.525 | – | 194 | 687 | 0.55 | 0.53 | 12 | 260300 | 27 | 2.63 | 2.59 | 5 |
| J18356204 | 0.5194 | – | 372 | 1378 | 1.342.25 | 22 | 1.06.6 | 28.5 | 6, 7 |
References – p: this paper, 1: Machalskietal2011, 2: Konar2013, 3: Jamrozy2007, 4: Machalski2016, 5: Marecki2016, 6: Konar2012, 7: KonarHardcastle2013. Column description is as follows: Column 1: J2000 name of the source, Column 2: redshift of the source, Column 3: black hole mass, Columns 4 and 5: size of the inner and outer double, respectively, Columns 6 and 7: alpha injection of the inner and outer double, respectively, Columns 8 and 9: age of the inner and outer double, respectively, Column 10: duration of the quiescent phase, Columns 11 and 12: jet power of the inner and outer double, respectively, Column 13: reference to the spectral age and other parameters of the source. For this source the data have been taken from spectral modelling rather than from dynamical modelling as for other sources. Photometric redshift. Data taken from or calculated according to Kuzmicz2017.