87-100 Toruń, Poland
11email: bakowska@umk.pl 22institutetext: Department of Physics, University of Warwick, Coventry CV4 7AL, United Kingdom 33institutetext: Department of Astrophysics/IMAPP, Radboud University, P O Box 9010, NL-6500 GL Nijmegen, The Netherlands 44institutetext: Institute of Astronomy, KU Leuven, Celestijnenlaan 200D, B-3001 Leuven, Belgium 55institutetext: SRON, Netherlands Institute for Space Research, Sorbonnelaan 2, NL-3584 CA Utrecht, The Netherlands 66institutetext: Department of Astronomy, University of Cape Town, Private Bag X3, Rondebosch, 7701, South Africa 77institutetext: South African Astronomical Observatory, P.O. Box 9, Observatory, 7935, South Africa 88institutetext: The Inter-University Institute for Data Intensive Astronomy, University of Cape Town, Private Bag X3, Rondebosch, 7701, South Africa
Spectroscopy of the helium-rich binary ES Ceti reveals accretion via a disc and evidence for eclipses
Abstract
Context. Amongst the hydrogen-deficient accreting binaries known as the ”AM CVn stars” are three systems with the shortest known orbital periods: HM Cnc (321 s), V407 Vul (569 s) and ES Cet (620 s). These compact binaries are predicted to be strong sources of persistent gravitational wave radiation. HM Cnc and V407 Vul are undergoing direct impact accretion in which matter transferred from their donor hits the accreting white dwarfs directly. ES Cet, is the longest period of the three and is amongst the most luminous AM CVn stars, but it is not known whether it accretes via a disk or direct impact. ES Cet displays strong HeII 4686 line emission, which is sometimes a sign of magnetically-controlled accretion. Peculiarly, although around one third of hydrogen accreting white dwarfs show evidence for magnetism, none have been found amongst helium accretors.
Aims. We present the results of Magellan and VLT spectroscopic and spectropolarimetric observing campaigns dedicated to ES Cet with the aim of understanding its accretion structure.
Methods. Based on the data collected, we derived trailed spectra, computed Doppler maps of the emission lines, and looked for circular polarisation and variability.
Results. We find strong variability in our spectra on the 620 s period. The lines show evidence for double-peaked emission, characteristic for an accretion disc, with an additional component associated with the outermost disc, rather than a direct impact, that is broadly consistent with ”S”-wave emission from the gas stream/disc impact region. This confirms beyond any doubt that 620 s is the orbital period of ES Cet. We find no significant circular polarisation (below %). The trailed spectra show that ES Cet’s outer disc is eclipsed by the mass donor, revealing at the same time that the photometric minimum coincides with the hitherto unrecognised eclipse.
Conclusions. ES Cet shows spectroscopic behaviour consistent with accretion via a disc, and is the shortest orbital period eclipsing AM CVn star known.
Key Words.:
binaries: close, stars: white dwarfs, cataclysmic variables, individual: ES Ceti1 Introduction
AM CVn stars are ultra-compact binary systems with orbital periods of 5-65 minutes in which white dwarfs accrete from degenerate or semi-degenerate companions (recent reviews in Solheim 2010; Ramsay et al. 2018). Only hydrogen-deficient material can attain the density necessary to fit within Roche lobes at such short orbital periods and the spectra of AM CVn stars are devoid of hydrogen lines, and are dominated instead by helium, sometimes along with with heavier elements(see Warner 1995 for a detailed review).
AM CVn stars and cataclysmic variables (CVs) share many common features, including accretion discs which undergo semi-regular cycles of outburst and quiescence in some cases, and features characteristic of these discs are seen in the spectra of both classes. There are also differences between the two types; obviously their abundances and orbital periods are very different, but two other distinctions can be drawn. As yet there are no known examples of magnetic white dwarfs amongst almost 60 known AM CVn stars whereas around one third of CVs are magnetic (Pala et al., 2020); there is no obvious explanation for this difference. The other difference is that AM CVn stars can reach such short periods that a novel form of accretion becomes possible in which no accretion disc forms but matter directly impacts the accreting white dwarf instead (Marsh & Steeghs, 2002; Marsh, Nelemans & Steeghs, 2004).
For decades following the recognition of the nature of AM CVn itself (Smak, 1967), only a few members of the class were identified. Even by the year 2000, just six systems were known, but wide-field spectroscopic and photometric surveys have since had a significant impact. By the time of Solheim (2010) 25 systems were known, while 57 were listed by Ramsay et al. (2018). Because of their short orbital periods, the evolution of AM CVn stars is expected to be governed by gravitational-wave radiation (Paczyński, 1967). The radiation emitted from this hydrogen-deficient class of objects should be detectable by instruments such as the Laser Interferometer Space Antenna (LISA), hence they are test-beds of gravitational wave physics (Kupfer et al., 2018). AM CVn stars are also of interest as a potential progenitor class of Type Ia supernovae (Brown et al., 2011; Gilfanov & Bogdán, 2010; Shen & Bildsten, 2014) and can offer important insights into binary evolution and common-envelope evolution.
Three channels of formation for AM CVn stars have been proposed. One possibility is via a double degenerate system that initially starts out as detached and then evolves to become interacting via mass transfer. However, this path has been in doubt since Shen (2015) found that it was vulnerable to mergers caused by classical-nova-like eruptions from the accreting white dwarf. Another channel is via a semi-degenerate helium (He) star channel, while a third is to evolve from a hydrogen-rich CV (see e.g. Nelemans et al. 2001a, b; Podsiadlowski, Han & Rappaport 2003; Yungelson 2008; Brooks et al. 2015). We currently face a conundrum in understanding the origin of helium-rich CVs because all identified pathways to their formation face problems when confronted with observations, for example the recent study of the eclipsing AM CVn, Gaia 14aae, (Green et al., 2019).
ES Ceti (ES Cet) was discovered by Noguchi, Maehara & Kondo (1980) and classified as a CV by Downes & Shara (1993). The optical magnitude range of the star is , and with an absolute magnitude of , ES Cet is amongst the most luminous AM CVn stars (Ramsay et al., 2018). Warner & Woudt (2002) found a photometric period in optical photometry of ES Cet of 620 s. Photometric studies over a baseline of years showed the period to be highly coherent, albeit slowly increasing with time (Espaillat et al. 2005; Copperwheat et al. 2011; de Miguel et al. 2018). Combined with the helium-dominated emission line spectrum, it was natural to interpret the period as orbital. ES Cet has the third shortest orbital period currently known amongst AM CVn stars, after HM Cnc ( s, Roelofs et al. 2010) and V407 Vul ( s, Haberl & Motch 1995). ES Cet’s period increases at a rate consistent with expectations for mass transfer driven by gravitational radiation (de Miguel et al., 2018). However, the orbital periods of both HM Cnc and V407 Vul decrease (Esposito et al. 2014 and references therein). This was shown to be possible if the donors in these stars still have significant surface hydrogen layers as a result of the prior evolution (D’Antona et al., 2006; Kaplan, Bildsten & Steinfadt, 2012). There is indeed some evidence that hydrogen contributes to the emission line spectrum of HM Cnc (Roelofs et al., 2010). ES Cet may differ from these systems and is possibly more representative of the bulk of AM CVn stars.
Depending upon the size of the accretor in a mass-exchanging binary, it is possible that a disc is unable to form and instead the mass transferred ploughs directly into the accretor. This is familiar for main-sequence stars in the form of Algol binary stars. The same only becomes possible for typical white dwarfs at periods below min (e.g. Marsh & Steeghs, 2002; Roelofs et al., 2010). Such direct impact is likely to lead to strong asymmetries visible in both photometry and spectroscopy. On the other hand if a disc forms, it tends to be relatively axi-symmetric, albeit with a disturbance caused by the gas stream at the edge of the disc. In the case of discs we see broad absorption lines in some high-state systems or double-peaked line emission from the disc plus a feature associated with the gas stream/disc impact which executes a sinusoidal radial velocity curve with a full amplitude similar to the separation between the peaks (e.g. Marsh, 1999; Morales-Rueda et al., 2003). HM Cnc and V407 Vul both appear to be in a state of direct impact (Barros et al., 2007). The next known AM CVn star, with a longer orbital period than ES Cet, SDSS J135154.46-064309.0 ( min, Green et al. 2018) is disc-accreting system. ES Cet’s period is close to the likely dividing line between direct impact and disc accretion and so its mode of accretion is not clear ab initio. Based on an analysis of the light curves, Espaillat et al. (2005) suggested that in fact ES Cet might be in a state of direct-impact accretion as well, but this issue has not been settled in the years since.
The issues outlined above motivated us to carry out a spectroscopic study of ES Cet. Spectroscopy moreover is a means to confirm the basic hypothesis that the 620 s photometric period is indeed the binary period. Likely though this seems, given the nature of ES Cet and the way in which its period is evolving, it should certainly be put to the test. The structure of this paper is the following: Section 2 contains details about observations. In Section 3 are described the average spectra. Section 4 presents information about the trailed spectra. Doppler maps are presented in Section 5. Study of polarisation and pulsations are reported in Section 6 and 7, respectively. The summary and conclusions of our campaign are in Section 8.
2 Observations
We acquired spectroscopy of ES Cet during two campaigns in 2002 and 2003. During the first run, 528 spectra were obtained on two nights from 2002 October 27 to 28. The Boller & Chivens Spectrograph (B&C) was used to acquire low-resolution spectra on the 6.5-m Magellan-Clay telescope at Las Campanas Observatory, and covered the range from to Å. A 0.7-arcsec slit and a 1200 line mm-1 grating yielded a spectral resolution of 2 pixels and a dispersion of 0.80 Å pixel-1. A wide-slit exposure of the spectrophotometric standard star LTT377 was used to obtain a nominal count to flux calibration for the spectra.
The second run was conducted on 2003 October 28 using the FORS1 spectrograph on the VLT telescope. This time 230 spectra were obtained with the range from to Å. A -arcsec slit and a grism GRIS300V yielded a spectral resolution of 2 pixels and a dispersion of 5.30 Å pixel-1 for 2x2 binning.
Table 1 gives an overview of our observations. All images were bias-subtracted and flat field-corrected. Extraction and calibration were carried out using the software packages PAMELA and MOLLY111http://deneb.astro.warwick.ac.uk/phsaap/software/ (Marsh, 1989).
| Telescope | Date | Exp | UT interval | No. of |
|---|---|---|---|---|
| (sec) | frames | |||
| Magellan | 27 Oct 2002 | 30 - 40 | 03:04 - 08:04 | 357 |
| 28 Oct 2002 | 30 - 60 | 04:37 - 08:15 | 171 | |
| VLT | 28 Oct 2003 | 60 | 00:03 - 08:23 | 230 |
3 Average spectra
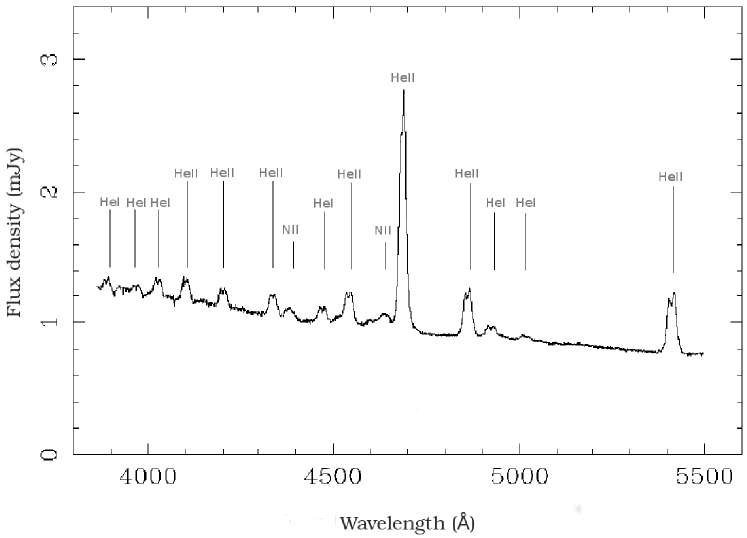
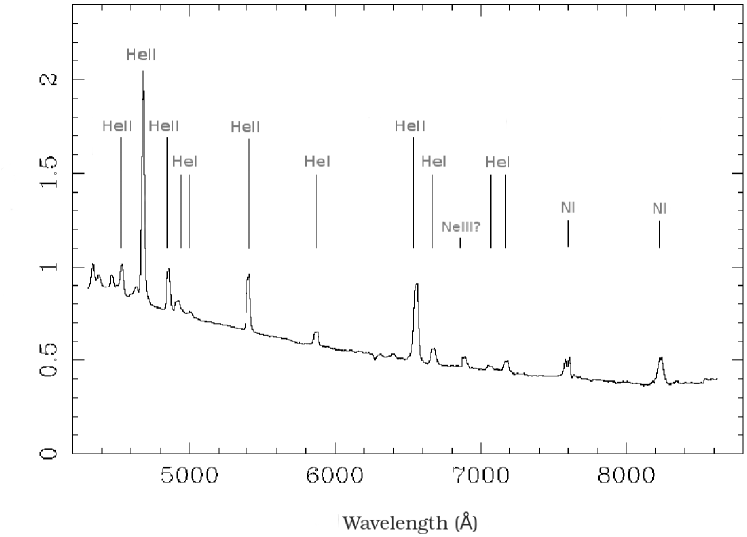
The average Magellan and VLT spectra of ES Cet are shown on the left and right panels in Fig. 1, respectively. They consist of a blue continuum with a series of strong emission lines. Most of the identifiable features can be interpreted as either neutral (HeI) or ionized (HeII) helium. The lines from neutral helium are weaker than the ionized helium peaks. Neither hydrogen nor metallic lines are detectable, apart from nitrogen. Nitrogen-rich matter is produced in the CNO-cycle, hence nitrogen seems to be abundant in most AM CVn stars (e.g. Marsh, Horne & Rosen 1991; Roelofs et al. 2009; Carter et al. 2014a; Kupfer et al. 2016).
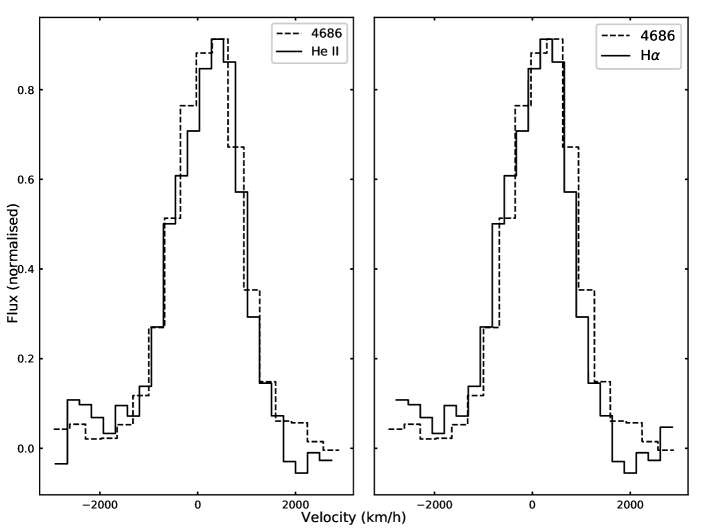
To test for the presence of hydrogen in ES Cet, we plotted the 6560 Å line as a function of velocity two times over, first relative to the central wavelength corresponding to the HeII line, and second for H line. We compare these to the velocity profile of HeII 4686 in Fig. 2. It is evident that the profiles are better aligned on the assumption that the 6560 line also comes from ionised helium rather than hydrogen. There is thus no evidence for hydrogen in ES Cet. We also measured the radial velocities of ES Cet from the HeII 4685.75 line, and from the wavelength corresponding to the 6560.10 HeII line and to the 6562.72 H line. The mean difference between the lines is km/s, while for the case this would be km/s. Neither is consistent with zero (not surprising because there are some profile differences), but the HeII identification is clearly favoured.
Our measurements of line fluxes and equivalent widths are given in Table 2. The majority of these spectral lines have a broad, double-peaked profile, clearly seen in spectra of ES Cet, e.g. in the HeII 5411 line. This is a key feature of binary systems with accretion. In some AM CVn stars, triple-peaked emission lines are observed, i.e. GP Com (Marsh, 1999), SDSS J120841.96+355025.2, SDSS J152509.57+360054.50 and SDSS J012940.05+384210.4 (Kupfer et al., 2013), SDSS J113732.32+405458.3, and SDSS J150551.58+065948.7 (Carter et al., 2014b). Smak (1975) and Nather, Robinson & Stover (1981) suggested that the lines are made up of a double-peaked profiles from an accretion disc, and a separate narrow component near the centre of the line known as a ’central spike’. This feature is thought to originate close to the surface of the accreting white dwarf (Marsh, 1999; Morales-Rueda et al., 2003). There is no evidence for the ’central spike’ feature in any of ES Cet’s emission lines.
| Magellan | VLT | ||||
|---|---|---|---|---|---|
| Line | Flux | EW | Line | Flux | EW |
| Å | Å | ||||
| HeI 3888 | HeII 4541 | ||||
| HeI 3964 | HeII 4686 | ||||
| HeI 4026 | HeII 4860 | ||||
| HeII 4100 | HeI 4921 | ||||
| HeII 4200 | HeI 5015 | ||||
| HeII 4339 | HeII 5411 | ||||
| NII 4379 | HeI 5876 | ||||
| HeI 4471 | HeII 6560 | ||||
| HeII 4541 | HeI 6678 | ||||
| NII 4643 | NeIII 6886? | ||||
| HeII 4686 | HeI 7065 | ||||
| HeII 4860 | HeI 7160 | ||||
| HeI 4921 | NI 7608a | - | - | ||
| HeI 5015 | NI 8242 | ||||
| HeII 5411 | |||||
-
a
Line present but could not be measured reliably, due to a blend with another line.
4 Trailed spectra
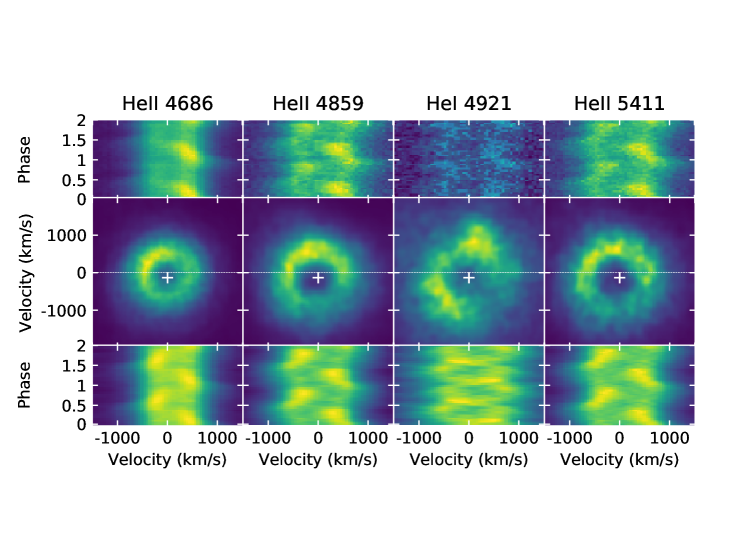
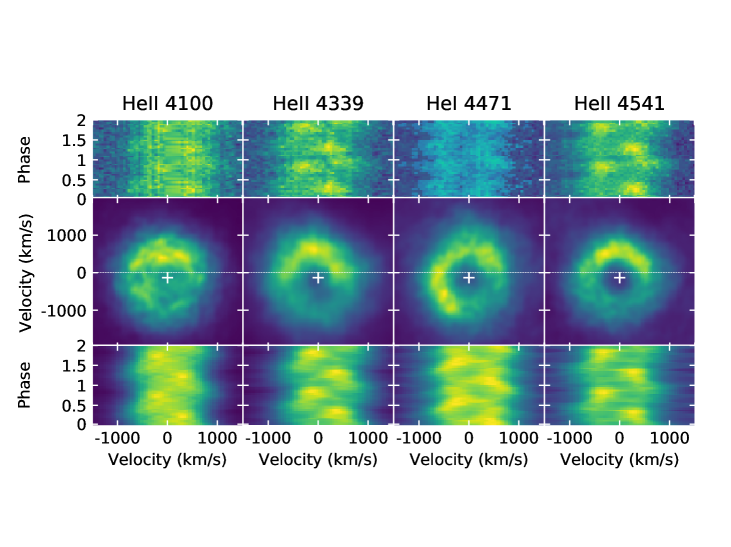
We present the phased-binned trailed spectra for the strongest HeII and HeI lines of ES Cet on the upper panels in Fig. 3 and Fig. 4. Twenty phase bins were equally spaced around the cycle and we have displayed one cycle repeated twice for clarity. The time-resolved spectra were folded on the ephemeris given by Copperwheat et al. (2011) (this spans the epochs of our spectra):
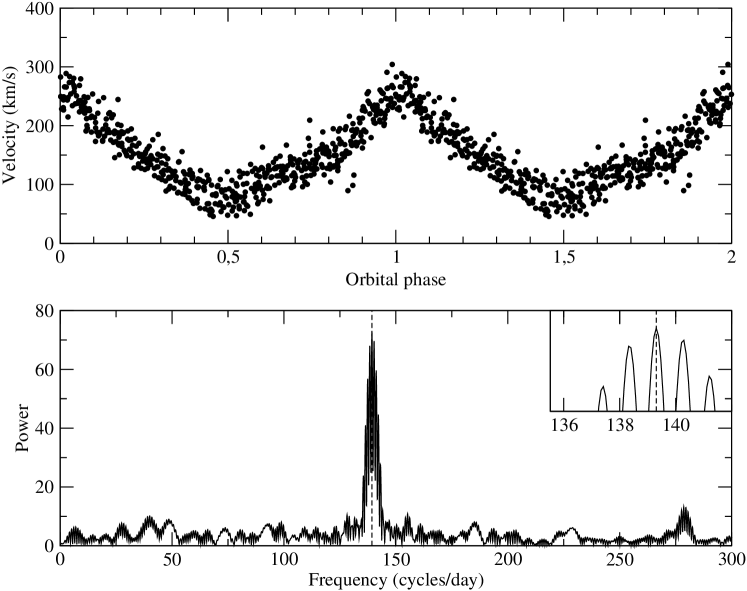
where is the cycle number. The trailed spectra show clear evidence for double-peaked emission lines with a sinusoidal ”S”-wave component superposed in most instances. Therefore, these data confirm that the 620 s photometric period is indeed orbital, beyond any doubt. To confirm this quantitatively, we measured radial velocities and computed the Lomb-Scargle periodogram corresponding to the strong HeII 4686 line (Fig. 6). A clear signal is seen at cycles per day. A weaker group of peaks appears at 2 times this frequency. Zooming in on the main signal, one can see that the strongest peak occurs at cycles per day ( days), with the two next-strongest peaks occurring at the usual cycle per day aliases. The period of the strongest peak corresponds to the one presented by Copperwheat et al. (2011), and hence represents the orbital period of the binary.
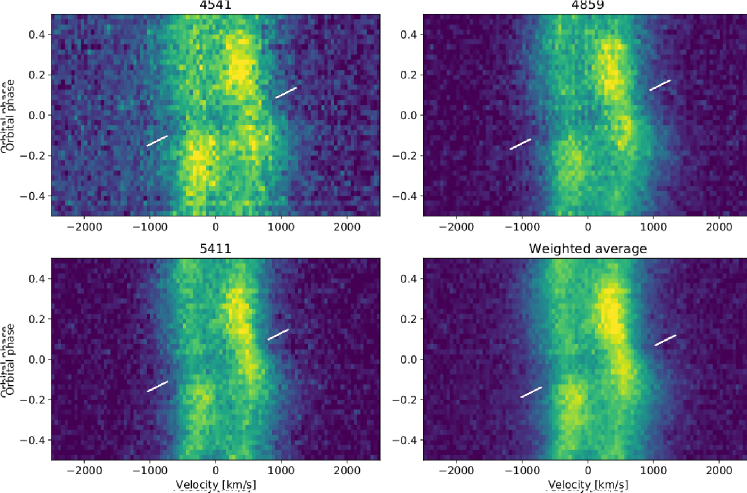
In the upper panels of Figs 3 and 4, one can see a dark, near-horizontal line on the blue-shifted side of the HeII 4859, HeII 5411, HeII 4339 and HeII 4541 trailed spectra. HeII 4859 shows it best of all, and shows that it extends to the red-shifted side of the line, although bright-spot emission dominates on the red-shifted side beyond km/s. The feature, which is shown magnified in Fig. 5 (indicated by the white lines), has all the signs of a ”rotational disturbance” (Greenstein & Kraft, 1959) caused as the disc is eclipsed by the mass donor. For instance, it occurs earliest in phase on the blue-shifted peak of the emission line, as expected for a prograde orbiting disc. The feature is seen close to phase zero on Copperwheat et al. (2011)’s ephemeris which is referenced to minimum light. This indicates that the photometric signal is primarily caused by eclipses of the disc. This association is further confirmed by the phasing of the S-wave which is in a standard location relative to phase zero in the trailed spectra, as also confirmed by the location of the bright emission in the Doppler maps.
Thus, we conclude that ES Cet’s outer disc is eclipsed. The eclipse can be traced as far as km/s (Fig. 5). Given that the outermost velocity in the disc is around km/s from the emission line peak velocity, and that in a Keplerian disc, the eclipse therefore reaches a radius in the disc which is a fraction % of the outer disc radius. The signal-to-noise ratio in the line wings prevents us from determining whether the eclipse reaches the white dwarf itself, although this seems unlikely given the 10 to 20% depth of the photometric eclipses (Copperwheat et al., 2011). Our spectra had exposure times of 60 s, corresponding to in terms of orbital phase, very comparable to the vertical extent of the eclipse feature in Fig. 5 at any one velocity in the lines. The data are therefore in effect vertically smeared by this amount, and so shorter exposure spectra have the potential to reveal deeper and sharper variations which may allow the orbital inclination of ES Cet to be pinned down. The eclipse may also encompass the bright spot, as is perhaps best indicated by the HeII 4859 trail in Fig. 5.
The various trails are similar, but not identical, and HeII 4686 in particular is noticeably asymmetric from red- to blue-shifted sides. The S-wave from the bright-spot also seems most visible at its extremes of radial velocity. These features may hint at vertical structure and self-obscuration within the disc. This may not be surprising as ES Cet is viewed at high inclination, and it is also a high accretion rate system.
5 Doppler maps
To accurately track the phase of the S-wave signal, we back-projected the trailed spectra into a Doppler tomogram (Marsh & Horne, 1988). The method of Doppler tomography enables the projection of a series of phase-resolved spectra on to a two-dimensional map in velocity coordinates (for review: Steeghs 2003; Marsh 2001). In Doppler tomograms, emission features that are not stationary in the binary frame or move on a period different from the orbital period will spread out over the resulting Doppler tomogram, while stationary emission features add up constructively. Not only is the method of Doppler tomography useful to separate features that move with a different amplitudes and/or phase, but it allows tracking of asymmetric structures in accretion discs and reveals details of the gas flow in a variety of systems. For analysis of AM CVn systems, Doppler tomography has also proved to be beneficial, e.g. for the investigation of the structure of an accretion disc (Breedt et al., 2012), the discovery of multiple bright spots (Roelofs et al., 2006a; Kupfer et al., 2013), or for searching for the presence of central spikes (Kupfer et al., 2016).
For all the trailed spectra, we computed the corresponding Doppler tomograms using the software package DOPPLER222https://github.com/trmrsh/trm-doppler (Marsh & Horne, 1988). The tomograms are presented in the second rows of Fig. 3 and Fig. 4. The bottom panels show trailed spectra computed from the maps. Once again, for each map and trailed spectrum, we used the ephemeris given by Copperwheat et al. (2011). All the Doppler tomograms show a similar structure, with a bright ring corresponding to emission from the accretion disc. In the case of the bright spot, the situation is more complicated. It is located mostly towards the upper-left, which, as remarked above, is the expected location, but it has a smeared structure and is not consistent from line to line. Partly this might be azimuthal smearing due to ES Cet’s short period and the 60 s-long exposures as discussed earlier for the eclipses, but in addition, ES Cet clearly is a very high accretion rate system, and the Doppler maps of high accretion rate CVs (nova-likes) have often proved hard to unravel, so we do not attach much significance to this finding. Indeed, compared to many nova-likes, which exhibit single-peaked lines even when deeply eclipsing, ES Cet is well-behaved.
6 Polarimetry
Given the strong HeII emission in the magnetic polar (AM Her) class of CVs, we decided to obtain spectropolarimetry of ES Cet. We took one night of circular spectropolarimetry using the FORS1 spectrograph of the VLT on 28 October 2003. We took spectra for slightly over 8 hours, obtaining 230 exposures of 60 seconds each, the remaining time taken up with overheads of rotating the Wollaston prism.
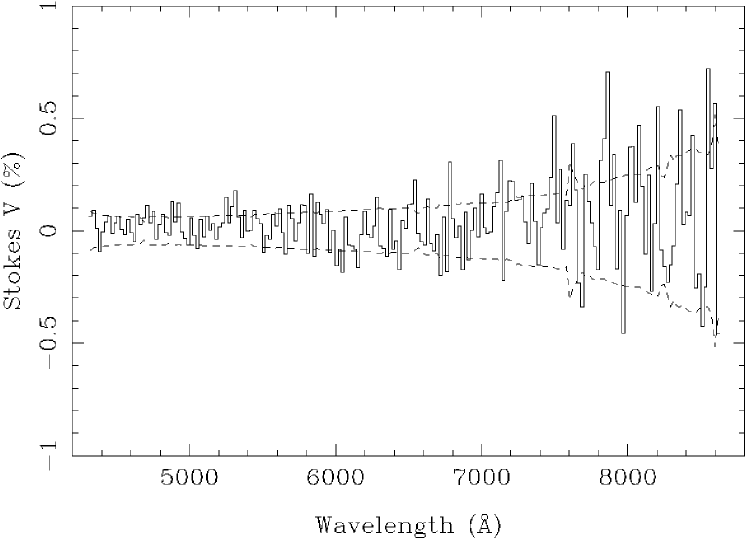
The average polarisation is consistent with zero, with an uncertainty of order % (Fig. 7).
To check that this could not be the result of cancellation of opposing senses of circular polarisation, we also calculated the power spectrum of the polarisation light curve integrated from to Å (Fig. 8).
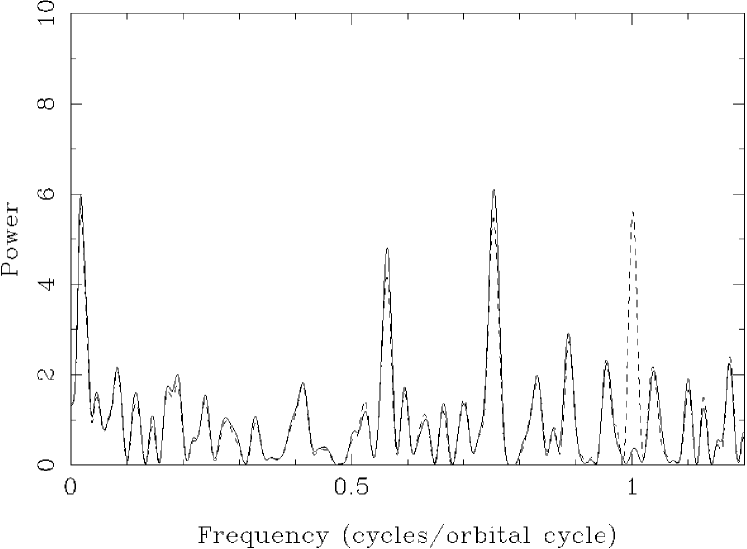
This is also a null result, and in this case we would have expected to detect a semi-amplitude of %. We illustrate this by injection of such a signal at the expected frequency (dashed line in Fig. 8) which produces a peak of height , which has a probability (frequency known in advance) of %. We conclude that there is no circular polarisation in ES Cet at a level of to %, and thus no direct sign of magnetic accretion; the mystery of the absence of signs of magnetism amongst AM CVn stars continues.
7 Discussion
Several models have been proposed to explain the observed properties of the two shortest period AM CVn stars, HM Cnc and V407 Vul (Ramsay et al., 2000; Israel et al., 2003; Barros et al., 2007). The intermediate polar (IP) model (Motch et al., 1996) model holds that these systems are not ultra-compact binaries at all, but rather have orbital periods of several hours and the ultra-short periods then represent the spins of magnetic white dwarfs. The unipolar induction (UI) model (Wu et al., 2002) model is the only model without a Roche lobe filling secondary and is essentially equivalent to the model proposed by Goldreich & Lynden-Bell (1969) for the Jupiter–Io system. In the direct-impact accretion model (Marsh & Steeghs, 2002) a Roche lobe-filling white dwarf loses its mass to its more massive white dwarf companion, and the accretion stream hits the accretor directly without forming a disc. This is presently the most widely-accepted model of HM Cnc and V407 Vul (Steeghs et al., 2006; Wood, 2009; Roelofs et al., 2010). The natures of AM CVn stars with longer orbital periods, e.g. SDSS J135154.46-064309.0 ( min, Green et al. 2018) and AM CVn itself ( min, Nelemans, Steeghs & Groot 2001c), are better established. Their spectra show an absence of hydrogen, the presence of helium lines, many of which are the double-peaked emission (or absorption) lines characteristic of sources accreting via discs. Also, detection of one or even two bright spots are frequently reported (Kupfer et al., 2016). Based on the photometric observations, Espaillat et al. (2005) concluded that ES Cet follows the direct-impact scenario and is therefore similar to HM Cnc and V407 Vul. However, we find instead clear evidence of an accretion disc along with a smeared spot-like structure, placing it very much in the same bracket as the bulk of longer period AM CVn systems.
Although, ES Cet has a disc and is more like the other ultra-compact binaries, AM CVn stars at longer periods than ES Cet tend to have very different spectra with weak absorption lines, e.g. HP Lib (Roelofs et al., 2007). AM CVn itself (Roelofs et al., 2006b) shows an absorption spectrum dominated by HeI, with only HeII 4686 in emission whereas ES Cet is very much an emission line system without any presence of absorption lines. This suggests a difference in the vertical temperature structure within the disk. That is, in AM CVn one sees light from a region where the temperature drops along the line of sight towards the observer, whereas in ES Cet it increases. The high orbital inclination implied by the eclipses may also play a role. Support for this comes from Burdge et al. (2020)’s discovery of ZFT J1905+3134, an eclipsing AM CVn system with a period of minutes which also shows strong HeII emission features similar to ES Cet.
8 Conclusions
We have described results of Magellan and VLT spectroscopic and spectropolarimetric surveys aimed at understanding the internal accretion structure of the helium-rich binary ES Cet.
Time-resolved spectra reveal strong variability in the emission lines on the 620 s period found from photometry. Double-peaked emission is clearly visible in the lines in our spectra, as is characteristic of an accretion disc. This confirms that the photometric period of 620 s first reported by Warner & Woudt (2002) is ES Cet’s orbital period. We find no periodic signals on periods unrelated to the 620 s orbital period.
Due to the strong HeII emission in magnetic CVs, which is also seen in ES Cet, we conducted one night of circular spectropolarimetry, but we found no circular polarisation placing an upper limit of . The strength of HeII in ES Cet more likely reflects its high accretion rate and state of excitation.
We discovered a short-lived, phase-dependent flux deficit in the trailed spectra of the HeII 4859, HeII 5411, HeII 4339 and HeII 4541 lines, consistent with a ”rotational disturbance” (Greenstein & Kraft, 1959). This shows that the outermost parts of the disc in ES Cet are eclipsed by the mass donor. The timing of the deficit is consistent with the phase of photometric minimum light, indicating that a significant part of the orbital light curve may be caused by eclipses. The eclipse extends over about half the outer disc in radius, but probably does not reach the white dwarf itself given the relatively shallow photometric eclipse. Higher time resolution spectroscopy of ES Cet could refine the exact radial extent of the eclipse and therefore constrain the orbital inclination.
For all the trailed spectra, we computed the corresponding Doppler tomograms. All the Doppler tomograms show evidence for a similar structure, with a bright ring corresponding to emission from the accretion disk. Several also show a brightness maximum at the expected location of the gas stream / disc impact (”bright spot”).
We conclude that, with the third shortest orbital period of any AM CVn star ( s), ES Cet is the system with the shortest orbital period that hosts an accretion disc, and that the disc is eclipsed.
Acknowledgements.
Project was supported by Polish National Science Center grants awarded by decisions: DEC-2015/16/T/ST9/00174 for KB. TRM and DS acknowledge support from the Science and Technology Facilities Council (STFC) grant numbers ST/P000495/1 and ST/T000406/1. Based on observations collected at the European Organisation for Astronomical Research in the Southern Hemisphere under ESO programme 072.D-0119(A) as well as data gathered with the 6.5 meter Magellan Telescopes located at Las Campanas Observatory, Chile.References
- Barros et al. (2007) Barros, S.C.C. et al., 2007, MNRAS, 374, 1334
- Breedt et al. (2012) Breedt, E. et al., 2012, MNRAS, 425, 2548
- Brooks et al. (2015) Brooks, J., Bildsten, L., Marchant, P., & Paxton, B., 2015, ApJ, 807, id. 78,
- Brown et al. (2011) Brown, W.R. et al., 2011, ApJ Letters, 737, id. L23
- Burdge et al. (2020) Burdge, K.B. et al., 2020, arXiv:2009.02567
- Carter et al. (2014a) Carter, P. J. et al., 2014a, MNRAS, 437, 2894
- Carter et al. (2014b) Carter, P. J. et al., 2014b, MNRAS, 439, 2848
- Copperwheat et al. (2011) Copperwheat, C. M. et al., 2011, MNRAS, 413, 3068
- D’Antona et al. (2006) D’Antona, F., Ventura, P., Burderi, L. & Teodorescu, A., 2006, ApJ, 653, 1429
- de Miguel et al. (2018) de Miguel, E. et al., 2018, ApJ, 852
- Downes & Shara (1993) Downes, R.A. & Shara, M.M., 1993, PASP, 105, 127
- Espaillat et al. (2005) Espaillat, C. et al., 2005, PASP, 117, 189
- Esposito et al. (2014) Esposito, P., Israel, G. L., Dall’Osso, S. & Covino, S., 2014, A&A, 561, id. A117
- Green et al. (2018) Green, M. J. et al., 2018, MNRAS, 477, 5646
- Green et al. (2019) Green, M. J. et al., 2019, MNRAS, 485, 1947
- Greenstein & Kraft (1959) Greenstein, J. L. & Kraft, R. P., ApJ, 130, 99
- Gilfanov & Bogdán (2010) Gilfanov, M. & Bogdán, Á., 2010, Nature, 463, 924
- Goldreich & Lynden-Bell (1969) Goldreich, P. & Lynden-Bell, D, 1969, ApJ, 156, 59
- Haberl & Motch (1995) Haberl, F. & Motch, C., 1995, A&A, 297, L37
- Israel et al. (2003) Israel G. L. et al., 2003, ApJ, 598, 492
- Kaplan, Bildsten & Steinfadt (2012) Kaplan, D. L., Bildsten, L. & Steinfadt, J. D. R., 2012, ApJ, 758, id. 64
- Kupfer et al. (2013) Kupfer, T. et al., 2013, MNRAS, 432, 2048
- Kupfer et al. (2016) Kupfer, T. et al., 2016, MNRAS, 457, 1828
- Kupfer et al. (2018) Kupfer, T. et al., 2018, MNRAS, 480, 302
- Marsh (1989) Marsh, T.R., 1989, PASP, 101, 1032
- Marsh (1999) Marsh, T.R., 1999, MNRAS, 304, 443
- Marsh & Horne (1988) Marsh, T.R. & Horne, K., 1988, MNRAS, 235, 269
- Marsh, Horne & Rosen (1991) Marsh, T.R., Horne, K. & Rosen, S. 1991, ApJ, 366, 535
- Marsh (2001) Marsh, T.R., 2001, in Boffin, H.M.J., Steeghs, D. & Cuypers, J., eds, Lecture Notes in Physics, Springer Verlag, Berlin, 573, 1
- Marsh & Steeghs (2002) Marsh, T.R. & Steeghs, D., 2002, MNRAS, 331, L7
- Marsh, Nelemans & Steeghs (2004) Marsh, T.R., Nelemans, G. & Steeghs, D., 2004, MNRAS, 350, 113
- Morales-Rueda et al. (2003) Morales-Rueda, L. et al., 2003, A&A, 405, 249
- Motch et al. (1996) Motch, C. et al., 1996, A&A, 307, 459
- Nather, Robinson & Stover (1981) Nather, R. E., Robinson, E., L., & Stover, R., J., 1981, ApJ, 244, 269
- Nelemans et al. (2001a) Nelemans, G. et al., 2001a, A&A, 365, 491
- Nelemans et al. (2001b) Nelemans, G. et al., 2001b, A&A, 368, 939
- Nelemans, Steeghs & Groot (2001c) Nelemans, G., Steeghs, D., & Groot, P. J., 2001c, MNRAS, 326, 621
- Noguchi, Maehara & Kondo (1980) Noguchi, T.; Maehara, H. & Kondo, M., 1980, Tokyo Astronomical Observatory, Annals, 18, 55
- Paczyński (1967) Paczyński, 1967, Acta Astron., 17, 287
- Pala et al. (2020) Pala, A. F. et al., 2020, MNRAS, 494, 3799
- Podsiadlowski, Han & Rappaport (2003) Podsiadlowski, P., Han, Z., & Rappaport, S., 2003, MNRAS, 340, 1214
- Ramsay et al. (2000) Ramsay G., Cropper M., Wu K., Mason K. O. & Hakala P., 2000, MNRAS, 311, 75
- Ramsay et al. (2018) Ramsay, G. et al., 2018, A&A, 620, A141
- Roelofs et al. (2006a) Roelofs, G.H.A. et al., 2006a, MNRAS, 365, 1109
- Roelofs et al. (2006b) Roelofs, G.H.A. et al., 2006b, MNRAS, 371, 1231
- Roelofs et al. (2007) Roelofs, G.H.A. et al., 2007, MNRAS, 379, 176
- Roelofs et al. (2009) Roelofs, G.H.A. et al., 2009, MNRAS, 394, 367
- Roelofs et al. (2010) Roelofs, G.H.A. et al., 2010, ApJ Letters, 711, L138
- Shen & Bildsten (2014) Shen, K. J. & Bildsten, L., 2014, ApJ, 785, id. 61
- Shen (2015) Shen, K. J., 2015, ApJ, 805, id. L6
- Smak (1967) Smak, J., 1967, Acta Astron., 17, 255
- Smak (1975) Smak, J., 1975, Acta Astron., 25, 227
- Solheim (2010) Solheim, J.-E., 2010, PASP, 122, 1133
- Steeghs (2003) Steeghs, D., 2003, MNRAS, 344, 448
- Steeghs et al. (2006) Steeghs, D. et al., 2006, ApJ, 649, 382
- Warner (1995) Warner, B., 1995, Cataclysmic Variable Stars, Cambridge Univ. Press, Cambridge
- Warner & Woudt (2002) Warner, B. & Woudt, P.A., 2002, PASP, 114, 129
- Wood (2009) Wood, M.A., 2009, MNRAS, 395, 378
- Wu et al. (2002) Wu, K. et al., 2002, MNRAS, 331, 221
- Yungelson (2008) Yungelson, L. R., Astronomy Letters, 34, 620