Learning drivers of climate-induced human migrations with Gaussian processes
Abstract
In the current context of climate change, extreme heat waves, droughts and floods are not only impacting the biosphere and atmosphere but the anthroposphere too. Human populations are forcibly displaced, which are now referred to as climate-induced migrants. In this work we investigate which climate and structural factors forced major human displacements in the presence of floods and storms during years 2017-2019. We built, curated and harmonized a database of meteorological and remote sensing indicators along with structural factors of 27 developing countries world-wide. We show how we can use Gaussian Processes to learn what variables can explain the impact of floods and storms in a context of forced displacements and to develop models that reproduce migration flows. Our results at regional, global and disaster-specific scales show the importance of structural factors in the determination of the magnitude of displacements. The study may have both societal, political and economical implications.
“When we escaped, we ran, without taking our belongings. Some of us ran barefoot. Some women lost their children – they have seen a lot.” - Anonymous migrant in Nigeria.
1 Introduction
An average of 25.3 million displacements has been brought on each year since 2008 due to extreme climate events with devastating consequences on human communities[1]. Particularly, vulnerable regions are the most affected with 95% of climate migrants belonging to low-middle income regions of the globe[2]. Recent studies have shown how changes in climate patterns and the increase in frequency and intensity of climate disasters are inducing newly emerging and changing patterns on human mobility[3, 4], making migration dynamics more difficult to anticipate. In the light of these events, not only novel predictive modelling approaches are needed, but also determining the drivers of climate-induced displacement is crucial to link and quantify climate change impact on migration and to eventually aid effective climate policies and pressure legislative reform[5].
The relationship between climate change and human migration is challenging to quantify and disentangle since it is a multi-causal phenomena with complex a interplay between its drivers[6]. Forced displacement occurs when a severity threshold is reached in the affected region[7], depending on the intensity of the shock but also on a range of socio-economic, demographic, environmental and political factors, among others[8, 9]. Contrarily to popular narratives, some empirical studies show that greater shock severity does not necessarily need to be proportional to the displacement magnitude[3], and displacement is usually modelled by using gravity or radiation equations [10, 11], which assume linear or log-linear relationships between displacement and the potentially explanatory covariates, calling the need for multivariate and non-linear modelling tools.
While international migration has been more extensively studied, internal displacement has received little attention, probably due to data acquisition challenges. We advocate recent advances in displacement monitoring, together with the increase of airbone, satellite, and meteorological data in sparse-data regions can be exploited for closing this climate-migration gap. Here we propose Gaussian Processes as a machine learning approach to learn from available data how to model internal displacements induced by flood and storm events.
2 Gaussian processes for modeling and interpretability
Gaussian Processes (GPs) are non-parametric probabilistic approaches for machine learning problems, mainly for regression and classification. The goal of the GP regression method [12] is to learn a nonparametric function able to estimate our target variable (internally displaced person, IDP111IDP is defined as someone who is forced to flee his/her home but remains within his/her country’s borders.) at country level from a set of input features (e.g. satellite, meteorological and structural variables), . We assume an additive noise model , where the noise is additive independent and identically Gaussian distributed with zero mean and variance , . Let us define the stacked output values , and denote the test points and predictions with a subscript asterisk and respectively. The output values are distributed as a a Gaussian with a zero mean and a covariance matrix of size that contains all pairwise similarities between countries and , . The GP model prediction for a test point is obtained by computing the posterior distribution over the unknown output as , where is the training dataset. This posterior can be shown to be a Gaussian distribution, = , for which one can estimate the predictive mean (point-wise predictions) as , where are model weights.
GPs are not black boxes, they allow not only modeling but also gaining some insights about the problem. Here we use a composite covariance formed by a linear and the automatic relevance determination (ARD) kernel function, where is a scaling factor, are dedicated hyperparameters controlling the spread of the signal relations in each dimension , is the noise standard deviation, and is the Kronecker’s symbol. The linear kernel copes with linear features and to mimic the best linear decision, the (anisotropic) exponential kernel deals with locality and nonlinearities to modify the linear solution, and the noise term to regularize the solution. The hyperparameters of our GP model were inferred by Type-II Maximum Likelihood. We work in a very data-limited high-noise regime which induces an error surface with many local minima. Therefore, instead of using the conjugate gradient ascend strategies, we used a more robust Bayesian optimization procedure [13]. After optimization, we studied the for model interpretability.
3 Data collection and preprocessing
The database contains displacement and climatic data from severe floods and storms events in countries during the period alongside a wide range of structural factors in each country. See Fig. 1 for the total number of IDPs per considered country.
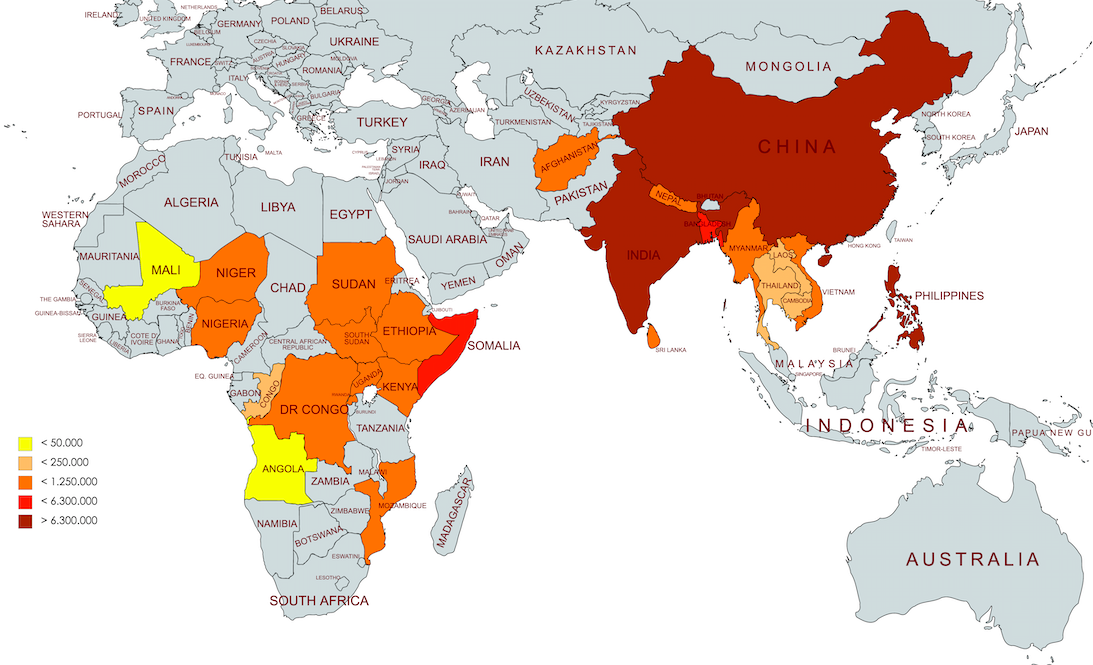
Displacement data comes from the Internal Displacement Monitoring Centre (IDMC) which provides Internally Displaced Person (IDP) (our target variable) data on a disaster event basis since [14]. We collected a total of IDP events belonging to Africa and Asia regions and identified the affected areas within each country for each catastrophe consulting different disaster sources, such as IDMC, Relief and EM-DAT [14, 15, 16]. According to the IDMC, of these events correspond to flood disasters (seasonal rains or displacements of large masses of water) and of them to storm disasters (tropical cyclones, torrential rain etc). The number of events in each country and the magnitude of displacement are summarized in Appendix I.
To characterize the severity of the disaster we extracted climate extremes using the Google Earth Engine platform. The chosen products provide data in sparse data regions, where meteo-hydrological data is poorly available such as Sub-Saharan Africa, from the simulation and combination of satellite and in situ data [17, 18, 19]. We selected the maximum valued pixel for each climate feature in the affected area with a monthly resolution. The dates of IDP events and climate extremes were matched by consulting the peak of the catastrophe in different disaster sources [14, 15, 16]. Lastly, variables used in this study comprising socio-economic, demographic, political and environmental features were collected from different sources as shown in Appendix II. Before training, we standardized data so that was not inflated towards high-variance variables, and a log-scale was applied to IDPs and to the total population in the affected area (Pop).
4 Results
| Models | r2 | ME | RMSE | |
|---|---|---|---|---|
| Africa | ||||
| Asia | ||||
| Flood | ||||
| Storm | ||||
| Global |
Results in Table 1 show moderate accuracy (RMSE0.9 and r) and low bias (ME) levels for all developed models of IDP, either regionally, disaster-specific or globally. This is a necessary observation before the more ambitious goal of model interpretability. In this section we analyze the rankings in a context of displacement at the different scales.
4.1 Climate-induced migrations in Africa and Asia
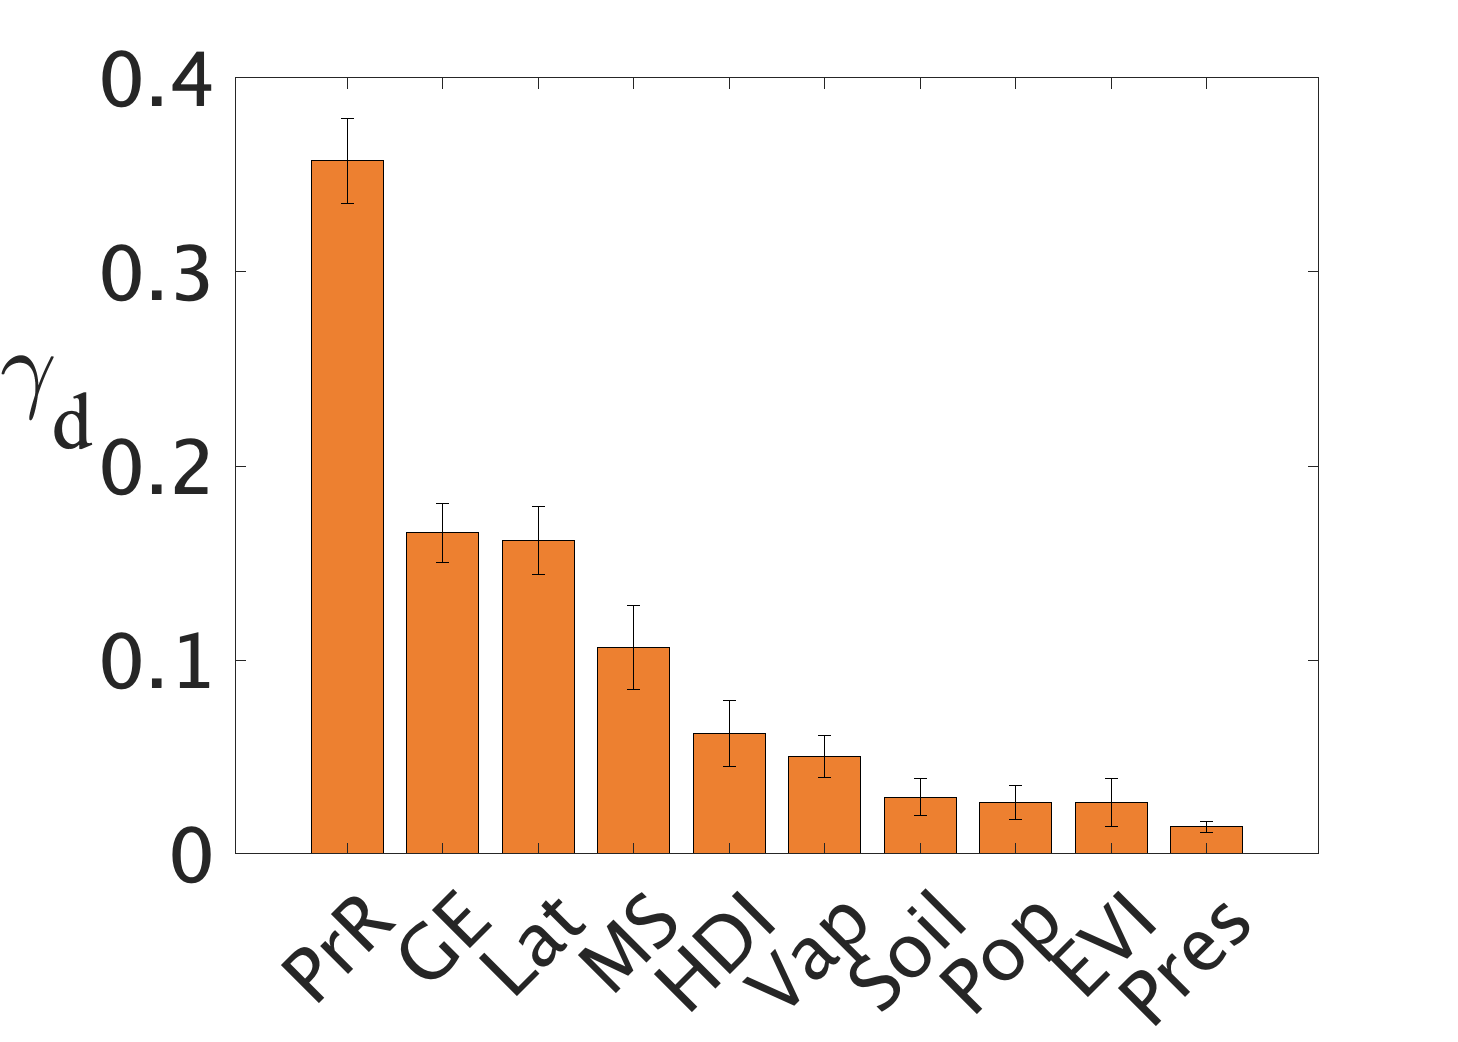
We study here Africa and Asia as the most important regions of forced migration. Two individual models were thus developed for each continent. The ranking of covariates extracted by the GP model for migrations in Africa is shown in Fig. 2[top] and indicates that precipitation rate (PrR) is the most relevant factor, answering to the great impact of rain across the African continent. Both government effectiveness (GE) and mortality due to lack of sanitation (MS) follow, which are related to the socio-economic vulnerability of countries such as South Sudan, Sudan, DR Congo, Somalia or Nigeria and that also present a significant number of IDPs. Another relevant factor is latitude (Lat), which could account for the high displacement magnitudes observed above the Equator. An interesting finding is that Pop scores little importance, suggesting that displacement magnitude in Africa does not relate to the most populated areas but to those which climate disasters have been more devastating.
Results for Asia in Fig. 2[bottom] suggest that Pop is the most relevant feature to explain the IDP in the region. This result is supported by the fact that 84% of total IDPs in Asia come from disaster events in Bangladesh, China, India and Philippines alone, which represent tremendous population densities. Among climate features, evapotranspiration anomalies (Eva) is by far the most relevant one. We hypothesize here that this is related to the evaporation of water accumulations after heavy flood and storm extreme events, which could be possibly due to the impact of Monsoon floods in the most populated cities. Monitoring population density and evapotranspiration are suggested to effectively quantify IDP in Asia.
4.2 Climate-induced migrations by flood and storm disasters
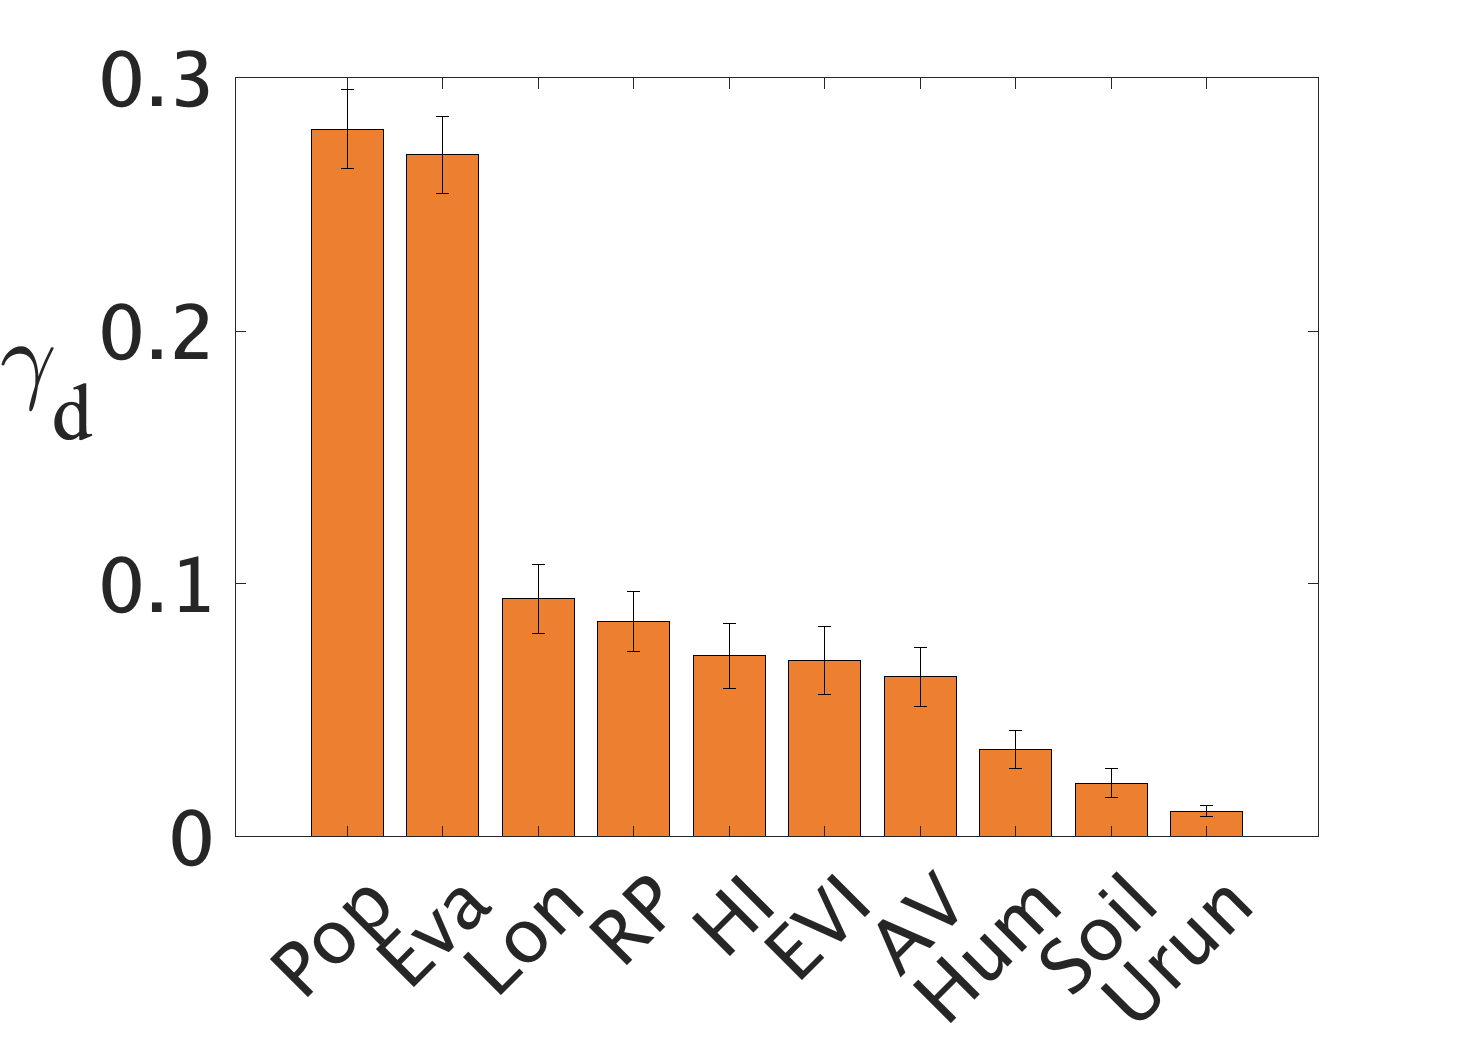
The previous regional studies could be affected by the type of disaster. Let us now study the factors impacting migrations induced by floods and storms separately. Flood modelling in Fig. 3[top] reveals that life expectancy (LE) and percentage of arable land (ARL) are the most dominant factors driving migrations after floods, and indicate that the GP model learned to associate IDP magnitude with specific countries. Maximum temperature (T) importance could also be interpreted in this regard, taking into account temperature differences between Asia and Africa regions. For this reason, LE importance must not be interpreted as a socio-economic vulnerability driving flood displacement. Nonetheless, the most severe IDP flood events occur in countries such as China, Philippines, Bangladesh, India, Nigeria or Ethiopia which have high ARL values. This result could be displaying the effect of intensive agricultural practices, land degradation and deforestation on flood risk as a global scale problem[20, 21].
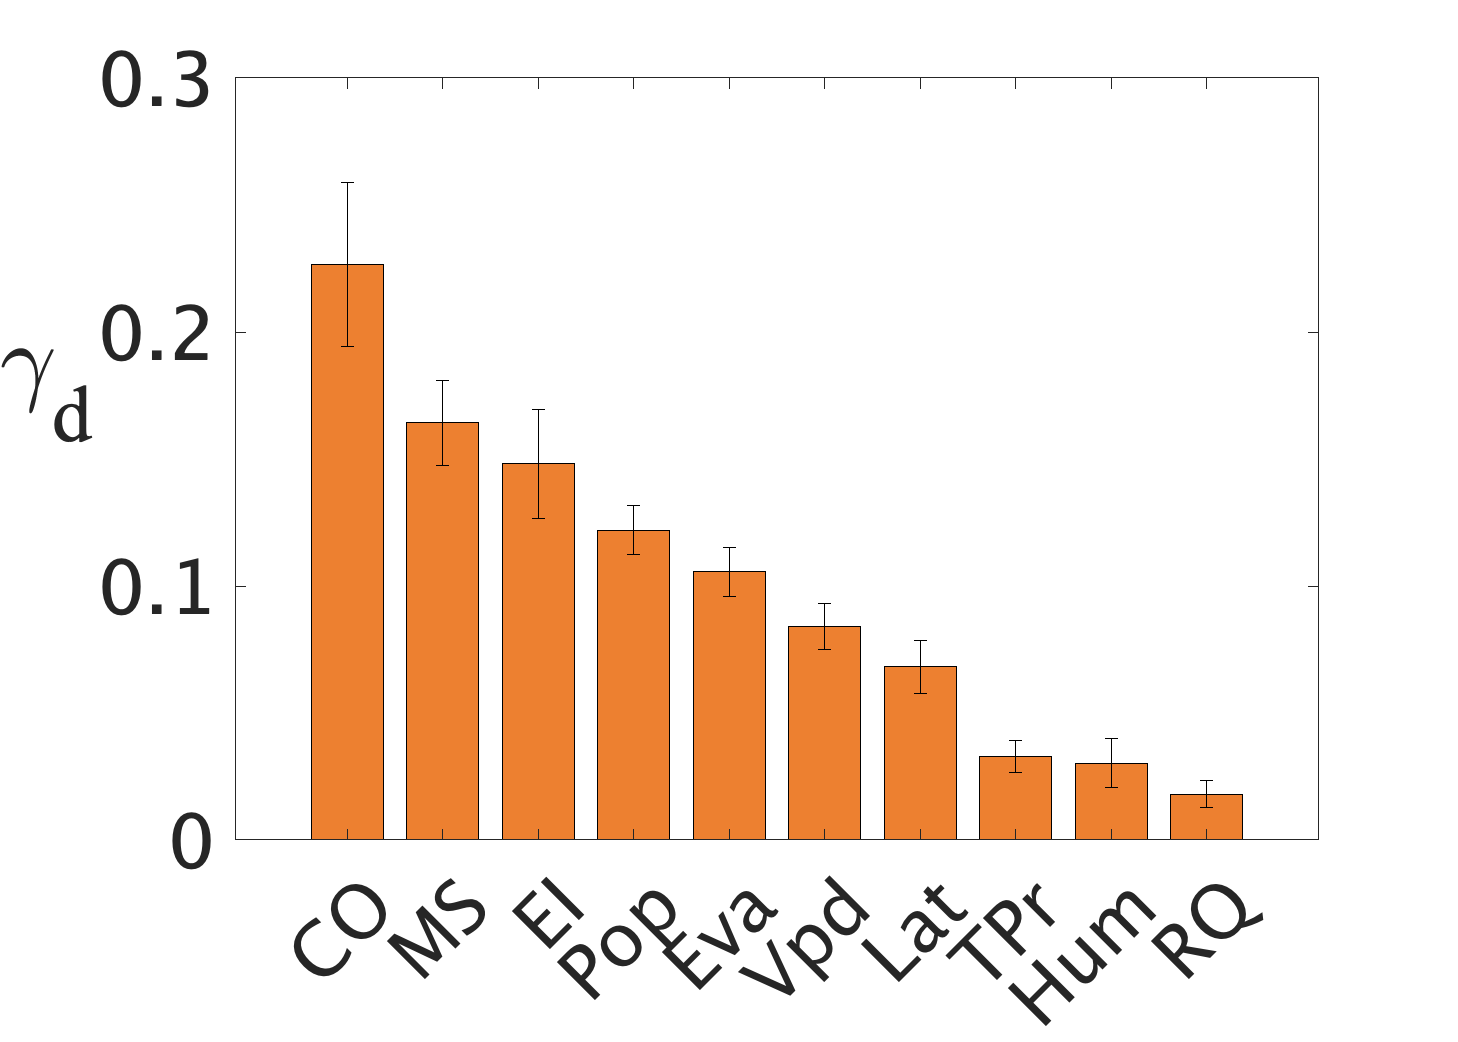
Storm events in Bangladesh, China, India and Philippines account for 80% of the IDPs caused by storms in our datataset. The storm model, cf. Fig. 3[bottom], must be interpreted on these terms. Results present the highest relevance for length of coastline in km (CO) feature accounting for the severe impact of tropical cyclones in the coastal regions of China, India, Bangladesh and Philippines, but also the severe cyclones in Mozambique (Idai cyclone) and Vietnam (e.g. Vinta-Tembin cyclone), before dissipating inland. Pop and Lat features arise again, mainly due to the high IDP magnitudes present in South Asia, while Eva and Water Vapour Deficit (VPD) are variables associated to floods and cyclone forming conditions, respectively.
4.3 Climate-induced migrations globally
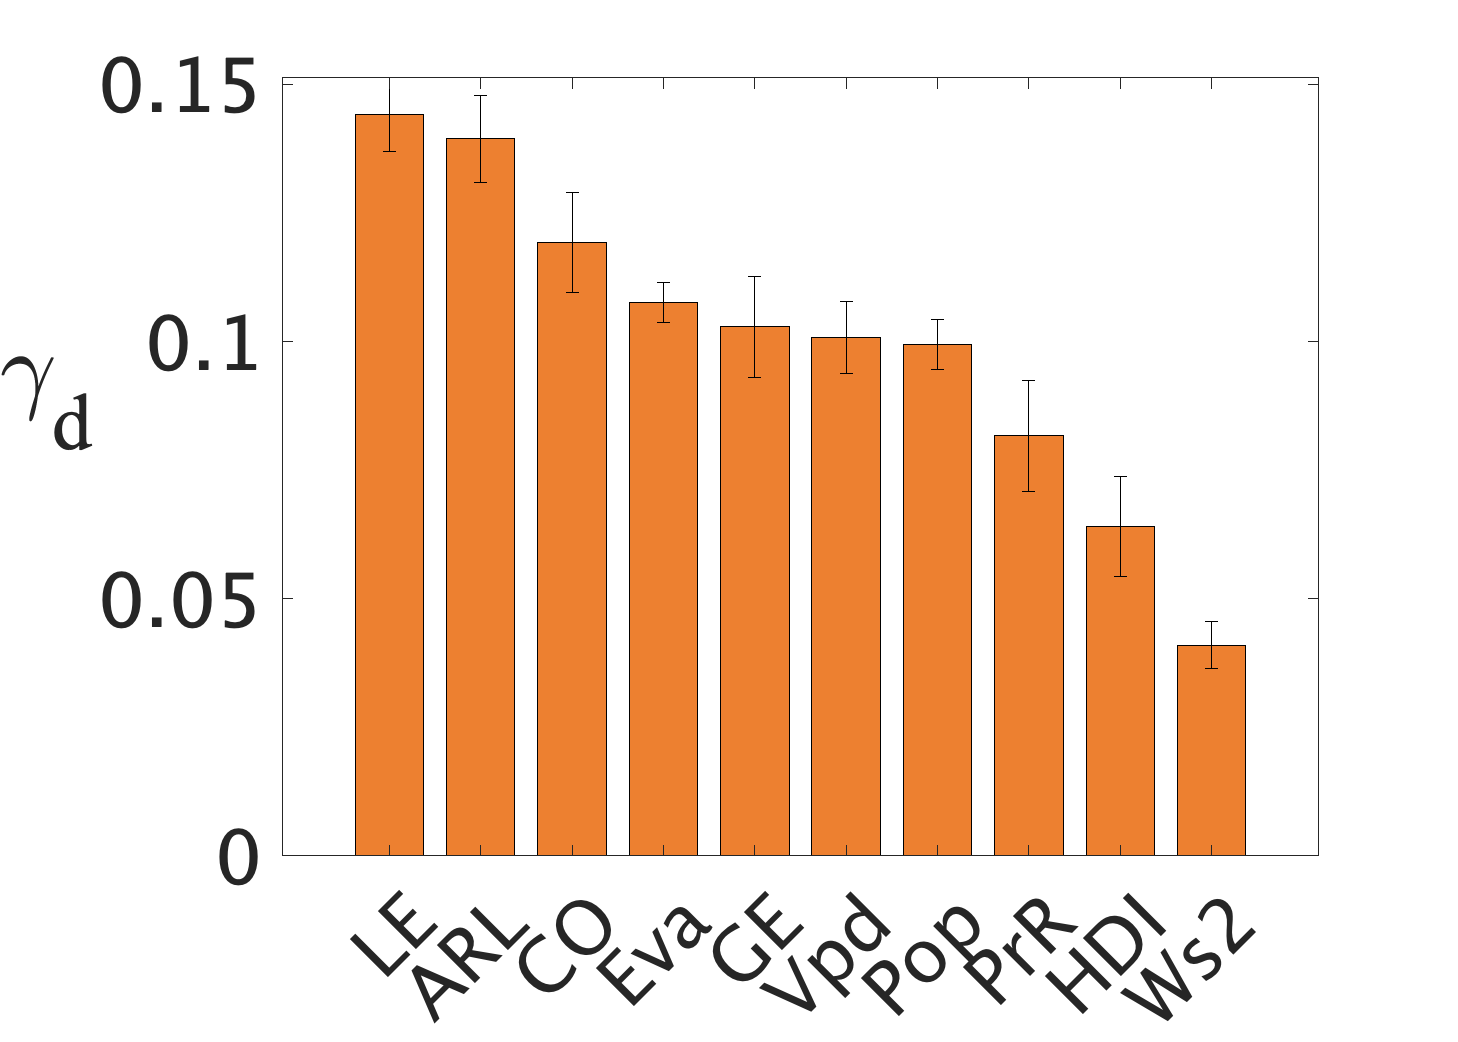
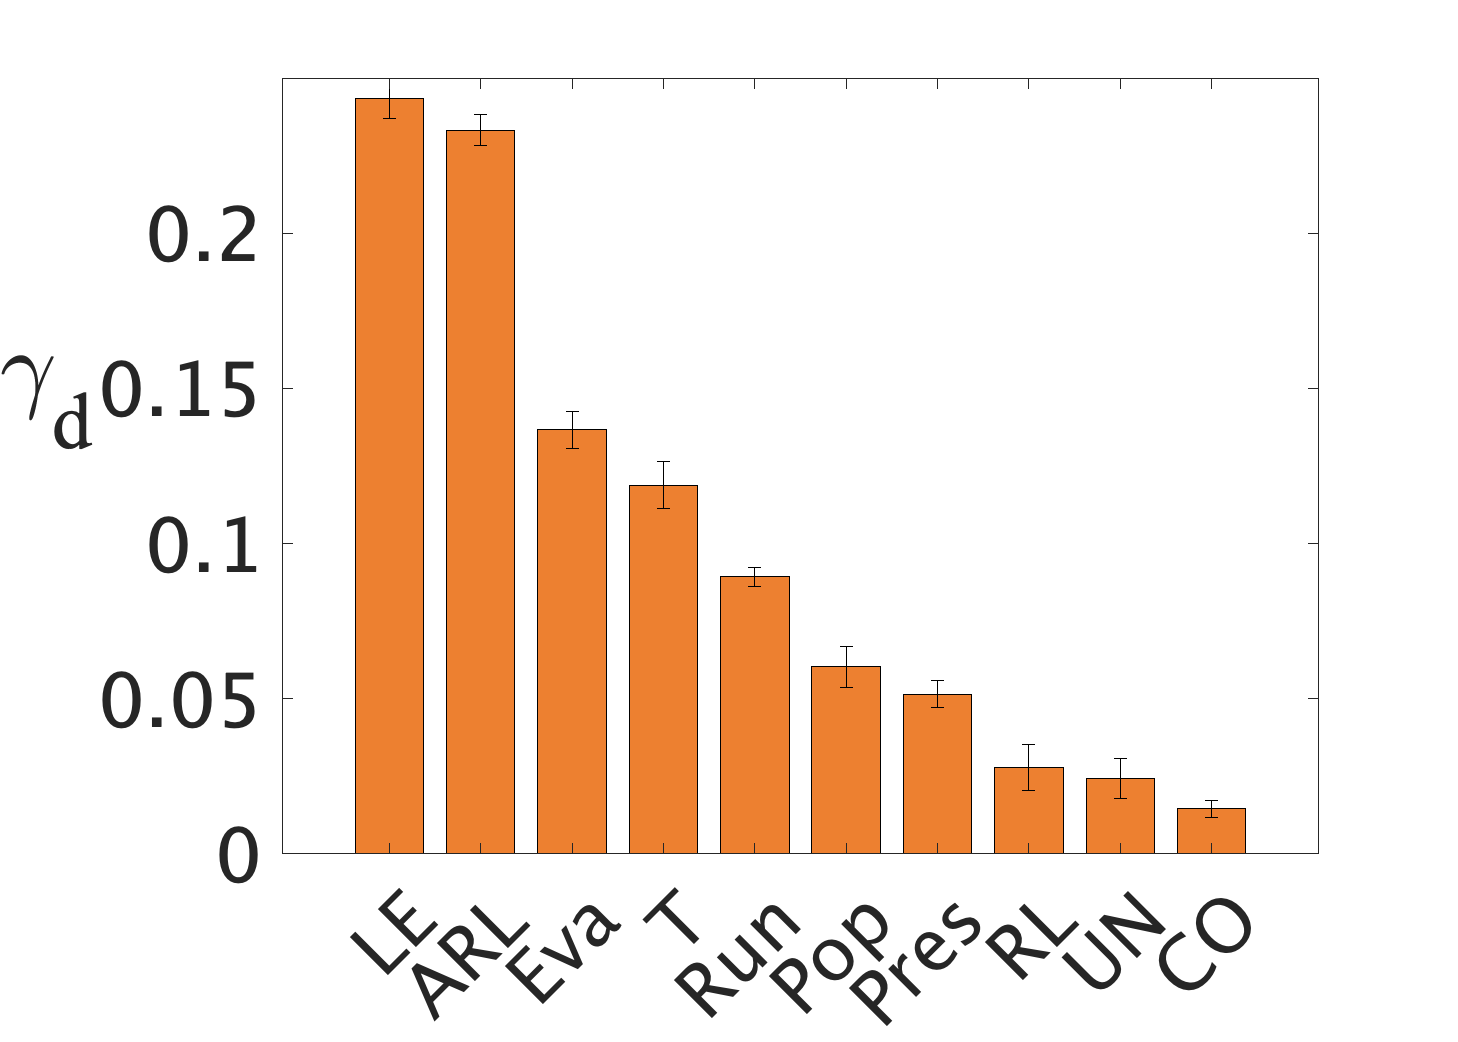
Global model results, cf. Fig. 4, are consistent with flood and storm models returning highest feature relevance for LE, ARL and CO features which account for the most affected regions by flood and storms. Next, Eva and Vpd appear as the most relevant climate predictors of global displacements accounting for flood and storm events alongside with GE, Pop which appear in Asia and Africa Models. As many events and regions are combined together in the same model, the relative relevance of covariates is more even, yet still reflecting on the great importance of the combination of societal (life expectancy) and economical (land arable) factors.
5 Conclusions
We introduced the use of Gaussian processes in the challenging problem of interpreting the relative relevance of climate-induced human migrations. We collected and harmonized a database of meteorological, satellite-derived and socio-economic indicators to undertake our investigations. Results at regional, global and disaster-specific (floods and storms) showed the high importance of structural (socio-economic) covariates as the driving forces to determine the magnitude of displacements. The results obtained have both societal and economic implications in disaster management and monitoring, which should be not only type but also country-specific
Despite these encouraging results there are a number of limitations to sort out in the future. Catastrophes are not the only drivers triggering forced migrations. It is widely accepted that turning points and complex saturation effect exist on life conditions [7], which should be considered too. Actually, accumulation of previous disasters can be a discriminative factor, but inclusion requires longer time series. This is a challenging problem with a high level of noise and uncertainty, and with a great number of involved counfounders, where causal discovery could -and should- say a word.
Acknowledgments and Disclosure of Funding
Research partly funded by the ‘Ayudas Fundación BBVA a equipos de investigación científica 2019’ in the project ‘Causal inference in the human-biosphere coupled system’, and the EU H2020 DeepCube ‘Explainable AI pipelines for big Copernicus data’. Gustau Camps-Valls were supported by the European Research Council (ERC) under the ERC-CoG-2014 SEDAL (647423) project.
References
- [1] IDMC. Global report on internal displacement. 2019. https://www.internal-displacement.org/global-report/grid2019/.
- [2] World Bank Climate Change Group. Groundswell : Preparing for internal climate migration. 2019. http://hdl.handle.net/10986/29461.
- [3] D.J. Kaczan and J. Orgill-Meyer. The impact of climate change on migration: a synthesis of recent empirical insights. Climatic Change, 158:281–300, 2020.
- [4] Intergovernmental Panel on Climate Change (IPCC). Changes in climate extremes and their impacts on the natural physical environment. 2018. https://www.ipcc.ch/site/assets/uploads/2018/03/SREX-Chap3_FINAL-1.pdf.
- [5] E. Wilkinson and A. Kirbyshire. Climate-induced migration and displacement: closing the policy gap. ODI Briefing, 2016.
- [6] C. Cattaneo, M. Beine, Frohlich C., D. Kniveton, I. Martinez, M. Mastrorillo, K. Millock, E. Piguet, and B. Schravenl. Human migration in the era of climate change. Review of Environmental Economics and Policy, 13:189–206, 2019.
- [7] Safra de Campos R., Bell M., and Charles-Edwards E. Collecting and analysing data on climaterelated local mobility: the mistic toolkit. Population, Space and Place, 236:e2037, 2017.
- [8] M. Beine and C. Parsons. Climatic factors as determinants of international migration. Scand. J. Econ., 117, 2015.
- [9] R. Black and W. N. Adger. The effect of environmental change on human migration, globalenvironmental change. Review of Environmental Economics and Policy, 21:3–11, 2011.
- [10] M. Beine, S. Bertoli, and J. F. Moraga. A practitioners’ guide to gravity models of international migration. The World Economy, 39(4):496-512, 2016.
- [11] A. Masucci, Paolo, J. Serras, A. Johansson, and M. Batty. Gravity versus radiation models: On the importance of scale and heterogeneity in commuting flows. Phys. Rev. E, 88:022812, 2013.
- [12] C. E. Rasmussen and C. K. I. Williams. Gaussian Processes for Machine Learning. The MIT Press, New York, 2006.
- [13] Michael A. Gelbart, Jasper Snoek, and Ryan P. Adams. Bayesian optimization with unknown constraints. In Proceedings of the Thirtieth Conference on Uncertainty in Artificial Intelligence, UAI’14, pages 250–259, Arlington, Virginia, USA, 2014. AUAI Press.
- [14] IDMC. Internal displacement monitoring centre website. https://www.internal-displacement.org/.
- [15] Reliefweb by OCHA Services. Reliefweb disaster reports. 2019. https://reliefweb.int/disasters.
- [16] Centre for Research on the Epidemiology of Disasters. The international disasters database. 2019. https://www.emdat.be/database.
- [17] NASA/GSFC/HS. McNally, A. Ldas noah land surface model l4 global monthly 0.1 x 0.1 degree (merra-2 and chirps). USA, Goddard Earth Sciences Data and Information Services Center (GES DISC), 2018.
- [18] Copernicus Climate Change Service (C3S). Era5: Fifth generation of ecmwf atmospheric reanalyses of the global climate. Copernicus Climate Change Service Climate Data Store (CDS), 2017.
- [19] John T Abatzoglou, Solomon Z Dobrowski, Sean A Parks, and Katherine C Hegewisch. Terraclimate, a high-resolution global dataset of monthly climate and climatic water balance from 1958–2015. Scientific data, 5:170191, 2018.
- [20] Intergovernmental Panel on Climate Change (IPCC). Climate change and land: A summary for policy makers. 2019. https://www.ipcc.ch/site/assets/uploads/2019/08/4.-SPM_Approved_Microsite_FINAL.pdf.
- [21] K. Gunnella, M. Mark Mulligana, R. A. Francisa, and G. D. Holebc. Evaluating natural infrastructure for flood management within the watersheds of selected global cities. Elsevier: Science of The Total Environment, 670:Pages 411–424, 2019.
- [22] Center for International Earth Science Information Network CIESIN Columbia University. Gridded population of the world, version 4 (gpwv4): Population density, revision 11. NASA Socioeconomic Data and Applications Center (SEDAC), 2018.
- [23] United Nations Development Programme: Human Development Reports. Human development data (1990-2018). http://www.hdr.undp.org/en/data.
- [24] World Bank. World development indicators. 2018. https://databank.worldbank.org/source/world-development-indicators.
- [25] World Bank. World development indicators. 2018. https://databank.worldbank.org/source/world-development-indicators.
- [26] K. Didan. Mod13a2 modis/terra vegetation indices 16-day l3 global 1km sin grid v006 [data set]. ASA EOSDIS Land Processes DAAC., 2015.
- [27] D. Kaufmann and A. Kraay. The worldwide governance indicators (wgi). 2019. http://info.worldbank.org/governance/wgi/.
Appendix I. Details on the IDP database
| Flood | Storm | ||||
| Country | Region | Events | IDPs | Events | IDPs |
| Afghanistan | Asia | ||||
| Bangladesh | Asia | ||||
| Cambodia | Asia | ||||
| China | Asia | ||||
| India | Asia | ||||
| Iraq | Asia | ||||
| Laos | Asia | ||||
| Myanmar | Asia | ||||
| Nepal | Asia | ||||
| Philipines | Asia | ||||
| Thailand | Asia | ||||
| Sri-Lanka | Asia | ||||
| Vietnam | Asia | ||||
| Angola | Africa | ||||
| Congo | Africa | ||||
| DR Congo | Africa | ||||
| Ethiopia | Africa | ||||
| Kenya | Africa | ||||
| Mali | Africa | ||||
| Mozambique | Africa | ||||
| Niger | Africa | ||||
| Nigeria | Africa | ||||
| Rwanda | Africa | ||||
| Somalia | Africa | ||||
| South Sudan | Africa | ||||
| Sudan | Africa | ||||
| Uganda | Africa | ||||
| Africa | |||||
| Asia | |||||
| Total | |||||
Appendix II. Details on the covariates
| Feature | Short | Years | Description | Reference |
| Domain: Migration | ||||
| Internally Displaced Person | IDP | 2017-2019 | Person forced to leave home, in particular as a response of a climate disaster and that has not crossed any international border. | IDMC website [14] |
| Domain: Atmospheric | ||||
| Evapotranspiration | Eva | 2017-2019 | Evapotranspiration from VIC4.1.2 (and Noah3.3) is the sum of three weighted components by their surface contribution: canopy intercepted evaporation, vegetation transpiration and earth evaporation. Units: kg m-2 s-1. | FLDAS Noah Land Surface Model L4 Global Monthly 0.1 x 0.1 degree [17] |
| Specific Humidity | Hum | 2017-2019 | Units: kg kg-1 | FLDAS Noah Land Surface Model L4 Global Monthly 0.1 x 0.1 degree [17] |
| Total Precipitation Rate | PrR | 2017-2019 | Monthly total precipitation rate combining data from GDAS, MERRA-2 and CHIRPS. Units: kg m-2 s-1 | FLDAS Noah Land Surface Model L4 Global Monthly 0.1 x 0.1 degree [17] |
| Wind Speed 1 | Ws1 | 2017-2019 | Wind speed at surface level (10m). Units: m s-1 | FLDAS Noah Land Surface Model L4 Global Monthly 0.1 x 0.1 degree [17] |
| Near Surface Temperature (2m) | T | 2017-2019 | Units: K | FLDAS Noah Land Surface Model L4 Global Monthly 0.1 x 0.1 degree [17]. |
| Water Vapour Pressure | Vap | 2017-2019 | Measure of the vertical column of water vapour Measure combining meteorological station datas of WorldClim v2, CRU Ts4.0 and JRA-55 Units: kPa | TerraClimate: Monthly Climate and Climatic Water Balance for Global Terrestrial Surfaces 2.5 arc minutes [19] |
| Water Vapour Deficit | Vpd | 2017-2019 | Measure of monthly water deficit around mean value of the dataset combining meteorological station datas of WorldClim v2, CRU Ts4.0 and JRA-55 Units: kPa | TerraClimate: Monthly Climate and Climatic Water Balance for Global Terrestrial Surfaces 2.5 arc minutes [19] |
| Precipitation Accumulation | PrA | 2017-2019 | Measure of monthly accumulated precipitation combining meteorological station datas of WorldClim v2, CRU Ts4.0 and JRA-55 Units: mm | TerraClimate: Monthly Climate and Climatic Water Balance for Global Terrestrial Surfaces 2.5 arc minutes [19] |
| Mean Total Precipitation | TPr | 2017-2019 | Precipitation rate over earth surface if it was uniformly distributed over the selected region. Precipitation is generated following ECMWF ”Integrated Forecasting System” (IFS) models. Units: kg m-2 s-1 | ERA5 Monthly aggregates 0.25 arc degrees - ECMWF / Copernicus Climate Change Service [18] |
| Wind Speed 2 | Ws2 | 2017-2019 | Horizontal wind component at 10m. Unidades: m s-1 | ERA5 Monthly aggregates 0.25 arc degrees - ECMWF / Copernicus Climate Change Service [18] |
| Sea Level Pressure | Pres | 2017-2019 | Minima of atmospheric pressure adjusted to sea level altitude. Units: Pa. | ERA5 Monthly aggregates 0.25 arc degrees - ECMWF / Copernicus Climate Change Service [18] |
| Domain: Earth | ||||
| Soil Moisture | Soil | 2017-2019 | Soil moisture at 0 - 10 cm underground. Units: m^3 m-3 | FLDAS Noah Land Surface Model L4 Global Monthly 0.1 x 0.1 degree [17] |
| Water Run-off | Run | 2017-2019 | In Noah3.3, water Run-off is computed using the two layers conceptual scheeme of Schaake et al.37 based on a simple water balance model. Units: kg m-2 s-1 | FLDAS Noah Land Surface Model L4 Global Monthly 0.1 x 0.1 degree [17] |
| Underground Water Run-off | Urun | 2017-2019 | Units: kg m-2 s-1 | FLDAS Noah Land Surface Model L4 Global Monthly 0.1 x 0.1 degree [17] |
| Domain: Demographic | ||||
| Total Population | Pop | 2015 | Population density estimate based on national registers adjusted by the ”United Nation’s World Population Prospects” (UN WPP) census in 2015 multiplied by the area of the affected region | GPWv411: Population Density (Gridded Population of the World Version 4.11) [22] |
| Rural Population | RP | 2018 | percentage of Rural Population the country. | United Nations Development Programme: Human Development Reports [23] |
| Birth Rate | BR | 2018 | Birth Rate in the country. | United Nations Development Programme: Human Development Reports [23] |
| Life Expectancy | LE | 2018 | Average Life Expectancy in the country. | United Nations Development Programme: Human Development Reports [23] |
| Median Age | MA | 2018 | Median Age of the population of the country | United Nations Development Programme: Human Development Reports [23] |
| Unemployment | UN | 2018 | Unemployment percentage in the country. | United Nations Development Programme: Human Development Reports [23] |
| Domain: Socio-economic variable | ||||
| Mortality due to lack of sanitation | MS | 2018 | Number of deaths due to poor hygiene and sanitary services per 100.000 inhabitants in the country. | United Nations Development Programme: Human Development Reports [23] |
| GDP per Capita | GDP | 2018 | FMI establishes that “GDP measures the monatary value of final goods and services, that are bought by the final user, produced in a country per capita” | World Development Indicator [24] |
| Exports & Imports | EI | 2018 | It’s a measurement on the trade of a country. measures the total exports and imports in dollars as a % of the GDP of the country. | United Nations Development Programme: Human Development Reports [23] |
| Electricity Access | AE | 2018 | Percentage of the population with access to electricity | United Nations Development Programme: Human Development Reports [23] |
| Cereal Yield | CY | 2018 | Kg of cereals produced in the country. | United Nations Development Programme: Human Development Reports [23] |
| Employment in Agriculture | EA | 2018 | Fracction of total employment that belong to agricultural practises. | United Nations Development Programme: Human Development Reports [23] |
| Paved Road | PR | 2018 | km of paved road in the country. | United Nations Development Programme: Human Development Reports [23] |
| Domain: Socio-economic Index | ||||
| Human Inequality | HI | 2018 | Measures the capability of citizens of accessing the same life conditions in a country if inequality conditions did not exist. | World Development Indicator [25] |
| Concentration Index | CI | 2018 | Defined as twice the area below the concentration curve, , and the line of equality. In case of not existing salary equality CI is equal to 0. | World Development Indicator [25] |
| Education Index | EDI | 2018 | 50% weighted average between the mean years of adult scholarization and the mean years of children scholarization. | World Development Indicator [25] |
| Human Development Index | HDI | 2018 | Summarizes a measurement of the development in the country: A health, life expectancy, education and life quality.HDI is the geometric average between life expectancy, Education Index and Income Index. | World Development Indicator [25] |
| Income Index | II | 2018 | Income Index o GNI per capita is defined as the GDP plus foreign money influx minus the money leaving the country per capita. | World Development Indicator [25] |
| Human Capital Index | HCI | 2018 | The index measures the capability of the country to mobilize the economic and profesional potential of its citizens. It also measures the capital loses trough a lack of education and sanitation. | World Development Indicator [25] |
| Domain: Environmental | ||||
| Coastline | CO | Static | Length of coastline in the area in km. | United Nations Development Programme: Human Development Reports [23] |
| Latitude | LAT | Static | Latitude | United Nations Development Programme: Human Development Reports [23] |
| Longitude | LON | Static | Longitude | United Nations Development Programme: Human Development Reports [23] |
| Altitude | AL | 2018 | Average altitude in the affected area. Units: m | SRTM Digital Elevation Data Version 4. 90m Resolution. http://srtm.csi.cgiar.org/ |
| Arable Land | ARL | 2018 | Percentage of land cultivated for crops like wheat, maize, and rice that are replanted after each harvest in a country. | United Nations Development Programme: Human Development Reports [23] |
| Enhanced Vegetation Index | EVI | 2017-2019 | EVI is an enhanced vegetation index designed to improve vegetation signal in regions with high biomass by reducing atmospheric effects. Used criteria for the value is low clouds, low vision angle and the highest value of EVI. | MOD13A2.006 Terra Vegetation Indices 16-Day Global 1km. [26] |
| Domain: Political Index | ||||
| Corruption Index | COR | 2018 | Captures the degree of perception of which public charges use public capital for private interests | Worldwide Governance Indicators [27] |
| Goverment Effectiveness | GE | 2018 | Captures the perceptions on the quality of public services, civil services and their independence from political pressures as well as the perception on credibility, compromise and quality of govermental policies. | Worldwide Governance Indicators [27] |
| Absence of Violence | AV | 2018 | Measures the perception and cases on political instability and absence of violence and terrorism. | Worldwide Governance Indicators [27] |
| Regulatory Quality | RQ | 2018 | Captures the perception of the ability of a goverment to enforce effective policies and regulations. | Worldwide Governance Indicators [27] |
| Rule of Law | RL | 2018 | Captures perception on the quality of laws and the degree of fairness in which the law is applied | Worldwide Governance Indicators [27] |
| Voice Accountability | VA | 2018 | Captures the perceptions on the level in which citizens from a country can actively engage with the selection of its goverment, freedom of speech, association and media. | Worldwide Governance Indicators [27] |