Evidence of galaxy interaction in the Narrow-line Seyfert 1 galaxy IRAS 17020+4544 seen by NOEMA
Abstract
The narrow-line Seyfert 1 galaxy IRAS 17020+4544 is one of the few sources where both an X-ray ultra-fast outflow and a molecular outflow were observed to be consistent with energy conservation. However, IRAS 17020+4544 is less massive and has a much more modest active galactic nucleus (AGN) luminosity than the other examples. Using recent CO(1-0) observations with the NOrthern Extended Millimeter Array (NOEMA), we characterised the molecular gas content of the host galaxy for the first time. We found that the molecular gas is distributed into an apparent central disc of , and a northern extension located up to 8 kpc from the centre with a molecular gas mass . The molecular gas mass and the CO dynamics in the northern extension reveal that IRAS 17020+4544 is not a standard spiral galaxy, instead it is interacting with a dwarf object corresponding to the northern extension. This interaction possibly triggers the high accretion rate onto the super massive black hole. Within the main galaxy, which hosts the AGN, a simple analytical model predicts that the molecular gas may lie in a ring, with less molecular gas in the nuclear region. Such distribution may be the result of the AGN activity which removes or photodissociates the molecular gas in the nuclear region (AGN feedback). Finally, we have detected a molecular outflow of mass in projection at the location of the northern galaxy, with a similar velocity to that of the massive outflow reported in previous millimeter data obtained by the Large Millimeter Telescope.
keywords:
galaxies:evolution - galaxies:ISM - galaxies:Seyfert - galaxies:individual:IRAS 17020+4544 - radio lines:galaxies1 Introduction
Active galactic nuclei (AGN) are assumed to play a major role in the evolution of galaxies. In particular, AGN feedback is often invoked as a key ingredient in regulating star formation. A viable feedback agent that is often proposed is the powerful outflows which eject gas from the innermost regions out to larger scales (see Harrison et al. 2018, and references within). These winds transport kinetic energy to the entire galaxy, that finally is converted into mechanical energy that heats the gas. As a consequence, star formation is quenched due to a lack of cold molecular gas reservoir. AGN-driven outflows can be observed in X-ray spectra as ultra-fast outflows (UFO at ; Tombesi et al. 2012; Gofford et al. 2013; Longinotti et al. 2015), in the optical band (e.g. Harrison et al. 2014) or in the molecular phase (as probed by mm-observations; Cicone et al. 2014; Aalto et al. 2017; Alonso-Herrero et al. 2019; Audibert et al. 2019; García-Burillo et al. 2019).
To date, there are only few sources where both an X-ray UFO and a molecular outflow were observed and physically related (Feruglio et al., 2015; Tombesi et al., 2015; Veilleux et al., 2017; Longinotti et al., 2018; Bischetti et al., 2019). Three of these sources are particularly interesting as the two outflow phases are found to follow an energy-conserving relation (see the review of King & Pounds 2015): Mrk 231, IRAS F11119+3257 and IRAS 17020+4544.
Contrary to the former two objects which are ultra-luminous infrared galaxies (ULIRG), the narrow line Seyfert 1 (NLSy1) galaxy IRAS 17020+4544 (hereafter IRAS17) is less luminous, contains less molecular gas and the central AGN is less powerful (; Longinotti et al. 2018). The central AGN is known to be characterized by a warm absorber seen as X-ray absorption (Leighly et al., 1997; Komossa & Bade, 1998; Vaughan et al., 1999) and by compact radio emission (Snellen et al., 2004). Using the B-magnitude, Wang & Lu (2001) derived the mass of the central super massive black hole: .
A recent rich multi-wavelength campaign for IRAS17 has revealed: (1) the presence of the sub-relativistic X-ray UFO (Longinotti et al., 2015) and of a massive, possibly galaxy-scale molecular outflow (Longinotti et al., 2018); (2) a non-thermal apparent milli-arcsec scale jet which seems to coexist with the different phases of the outflow (Giroletti et al., 2017); (3) multi-component X-ray winds (Sanfrutos et al., 2018) which can be interpreted as an evidence that a cocoon of hot gas is producing large-scale shocks in the interstellar medium (ISM).
| RA (J2000) | a |
|---|---|
| Dec (J2000) | 45:40:47.17a |
| z | 0.0612b |
| (Mpc) | 274.3 |
| Scale (kpc/′′) | 1.181 |
| () | |
| 26f |
Notes.
(a) Position of the unresolved 8.4 GHz emission (Doi et al., 2007)
(b) Derived from the CO emission
(c) Wang & Lu (2001)
(d) Longinotti
et al. (2018)
(e) Lee
et al. (2016)
(f) Murphy
et al. (2011); Kennicutt &
Evans (2012)
The IR luminosity was corrected for the AGN contamination before calculating the SFR.
Contrary to the central AGN which is widely studied, little is known about its host galaxy. The morphology of the galaxy remains debated. Based on observations from the University of Hawaii 88 inch telescope, Ohta et al. (2007) concluded that IRAS17 is a barred spiral. On the contrary, using B- and R-bands observations from the Nordic Optical Telescope (NOT), Olguín-Iglesias et al. (2020) do not report complex morphology. Lee et al. (2016) studied the infrared (IR) spectral energy distribution of a sample of 14 galaxies. They derive an IR luminosity between 8 and of for IRAS17 (LDOG-45 in their article), with a contribution of the AGN of about 44% of the IR luminosity, which led them to classify it as a DOG (Dust Obscured Galaxy). Table 1 summarizes general properties of IRAS17.
In this paper, for the first time we characterise the molecular gas of the galaxy using new NOrthern Extended Millimeter Array (NOEMA) observations of the CO(1-0) line. This paper is organised as follow. The observations are presented in Section 2. In Sections 3 and 4, we analysed the molecular gas content and the CO kinematics, respectively. Finally, our results are discussed in Section 5. Throughout this paper, we assume , , .
2 Observations
2.1 NOrthern Extended Millimeter Array
IRAS17 was observed in CO(1-0) with NOEMA (project W17CR; PI: Patiño-Álvarez). The observations were carried out in April-May 2018 with 9 antennas in C configuration (baselines from 15 to 290m) during 4.8h on-source. The bright QSO 3C454.3 (9.3 Jy at 108 GHz) was used as RF calibrator for the receiver bandpass calibration, while the QSOs 1726+455 and 1656+482 were used as phase/amplitude calibrators. Finally, the star MWC349 was used as absolute flux calibrator. Absolute flux calibration has an uncertainty of about 10%.
The calibration of phase, absolute flux and amplitude was performed using the GILDAS software111http://www.iram.fr/IRAMFR/GILDAS. Then, we imaged and cleaned the data using the GILDAS package mapping. We first extracted the continuum in the uv plane by averaging the channels which do not contain CO emission. We have imaged the continuum emission at 3mm and found that it is unresolved at a resolution of . Using the GILDAS task uv_fit, we have fitted a point source in the uv plane. The continuum flux density peaks at an offset of arcsec, relative to the position of the unresolved 8.4 GHz emission from Doi et al. (2007), with a total flux of at 108 GHz.
The observations covered a large bandwidth of 8 GHz at a nominal spectral resolution of 2 MHz. In this paper, we focus on the molecular gas within the galaxy. We therefore select a conservative velocity range to have all the CO emission. After subtracting the continuum within the uv plane, we decreased the spectral resolution to in order to improve the signal-to-noise without affecting our study of the kinematics. We used the hogbom method with a threshold at to clean the data, where is the noise given by the deconvolution for channels of . The final datacube has a resolution of (∘).
2.2 Large Millimeter Telescope
IRAS17 was previously observed with the Large Millimeter Telescope Alfonso Serrano (LMT), located on the Sierra Negra Volcano in Mexico. The observations were carried out on May-June 2015 with the Redshift Search Receiver instrument (RSR), which covers the frequency range 73-111 GHz with a spectral resolution of 31 MHz. The galaxy was observed for a total of 525 minutes, giving an overall rms of 0.2 mK. For more details on the observations and data reduction, we refer to Longinotti et al. (2018).
2.3 Optical spectra

The nuclear region of the galaxy IRAS 17020+4544 and a northern optical-bright spot were observed on 13 March 2015, and 09 May 2016 respectively with the 2.12-m telescope of the San Pedro Mártir Observatory in Mexico. It used a Boller & Chivens spectrograph and a pixels E2V-4240 CCD, which was tuned approximately to the range. A 2.5 arcsec slit was used and the position of the slit for each observation is presented in Figure 1. The exposure time is for the slit centred on the nuclear region, and 1200s for the slit in the north. The spectral resolution is and in terms of FWHM, respectively. The data reduction was carried out with the IRAF software222IRAF is distributed by the National Optical Astronomy Observatories operated by the Association of Universities for Research in Astronomy, Inc. under cooperative agreement with the National Science Foundation. following standard procedures. The spectra were bias-subtracted and corrected with dome flat-field frames. Cosmic rays were removed interactively from all of the images. Arc-lamp (CuHeNeAr) exposures were used for the wavelength calibration. Note that, due to the bad sky conditions during the night of March 2015, the spectrophotometric standard was not observed, and therefore the spectrum was not calibrated in flux.
In the nuclear region, the spectrum (Figure 1 - right-bottom panel) shows 11 emission lines from which we could derive a redshift , confirming the value of de Grijp et al. (1992). The emission line ratios and widths confirm the nature of the core as NLSy1 type AGN. The spectrum of the northern region (Figure 1 - right-top panel) is more complex, with emission and absorption lines. The absorption lines present a redshift zero and are typical of a late-type, foreground star that is visible in the optical image of the galaxy (see Figure 1 - left panel). On the contrary, the emission lines are redshifted to a velocity , relative to the nuclear region (). The lines are narrow and typical of H\@slowromancapii@ regions. The uncertainties on the redshifts are the standard deviation.
3 Analysis of the molecular gas content
3.1 CO distribution
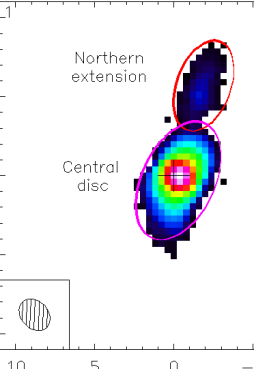
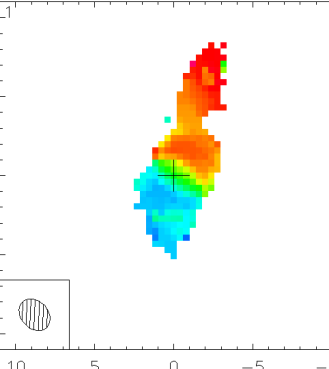
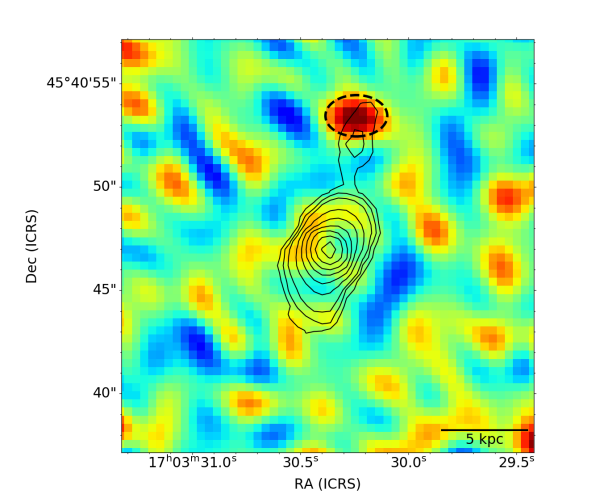
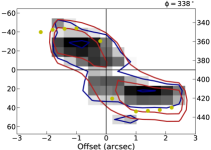
We use the dedicated GILDAS task with a threshold at (where ) to produce moment maps of the CO emission. After removing the noise-isolated pixels, we obtained the maps presented in Figure 2. Most of the CO emission is distributed into a central apparent disc which extends over (magenta ellipse in Figure 2), with a similar position angle (∘) that the stellar bar-like structure observed by Ohta et al. (2007), suggesting a spatial association (Figure 3). A velocity gradient of oriented south-east to north-west is reminiscent of an inclined rotating disc.
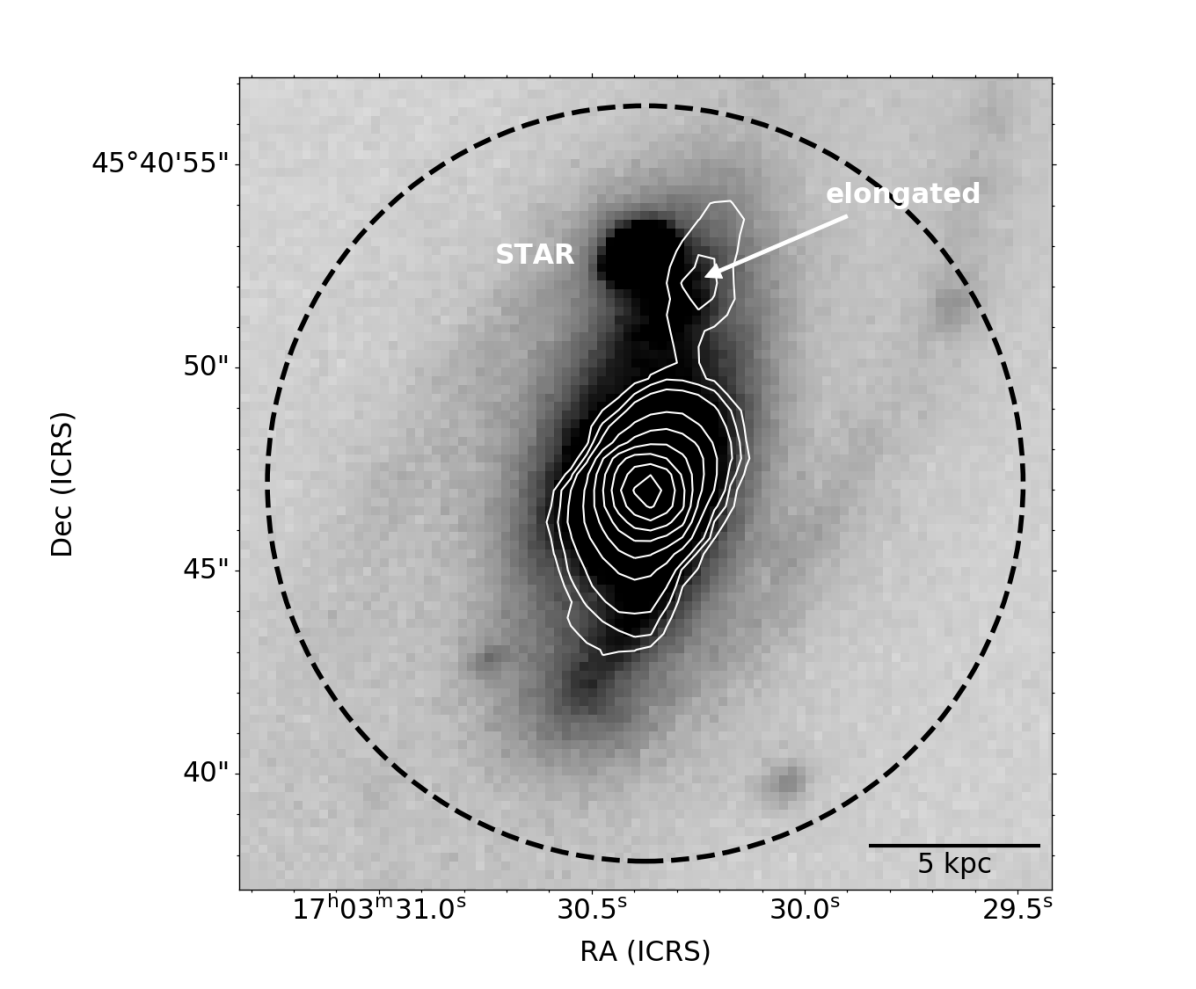
No CO emission is observed in the spiral arms seen in optical (see Figure 3). As presented below, NOEMA recovered the same integrated flux as the LMT. The non-detection of CO in the spiral arms could be therefore the result of an intrinsic lack of molecular gas or a too low sensitivity in both the LMT and the NOEMA datasets. Deeper observations would be necessary to answer this question.
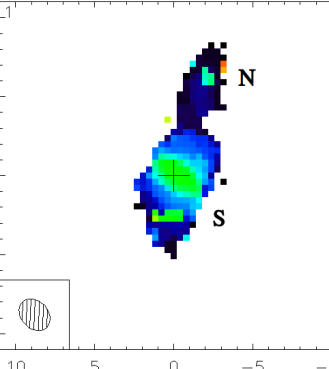
On the opposite, we clearly detected an elongated ( long) CO emission centred on an offset of arcsec north of the nucleus. This northern extension is highlighted by the red ellipse in Figure 2. Finally, we identified two small spots, named here N and S, at respective offsets of and arcsec which have large velocity dispersions of . Note that while having similar offsets, the N spot and the northern extension identified in CO emission do not refer to the same region: the N spot being part of the northern extension in projection. In the middle panel of Figure 2, the CO emission in the spots N and S is blueshifted and redshifted, respectively, with respect to the surrounding emission.
3.1.1 Origin of the high velocity dispersion
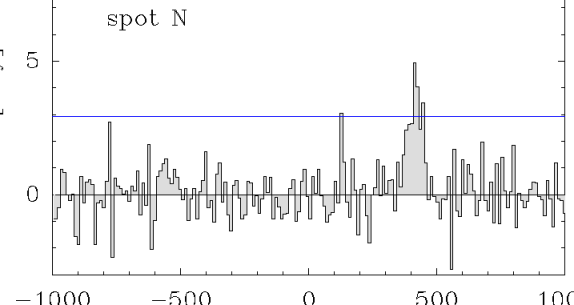
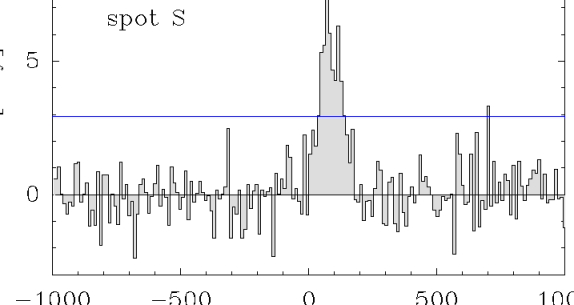
Each spot consists in less than 10 pixels for which we extracted the CO(1-0) spectrum. In Figure 4, we show the spectrum of the pixel with the highest velocity dispersion for each spot. The horizontal blue line shows the threshold we used to compute the moment maps. In each spectrum, a strong one-channel, isolated peak (likely noise) lies above the threshold. Therefore, it is taken into account in the calculation of the moments. The high velocity dispersion is thus produced by this isolated peak. Moreover, we note that the peak is blueshifted in the case of the spot N and redshifted for the spot S, with respect to the prominent emission. This also explains the velocity shifts observed in both spots. We therefore conclude that the spots of high velocity dispersion are not physical and result from noise contamination, with a noisy channel stronger than our threshold when producing the moment maps.
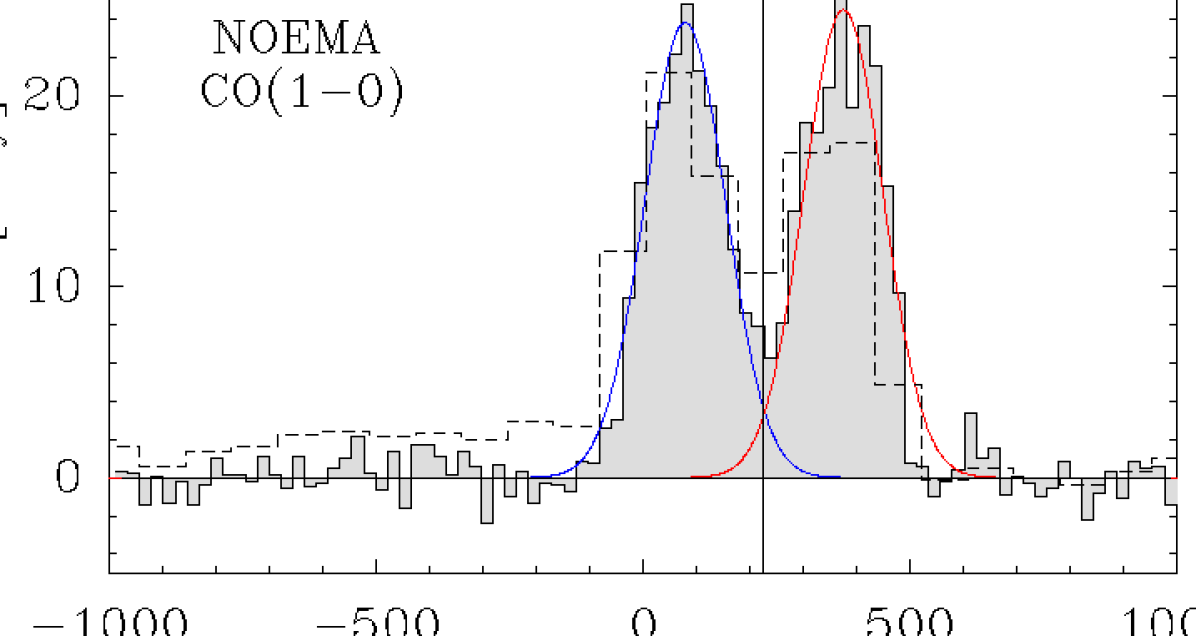
3.2 Double-peak spectrum
We now focus on the main galaxy and extracted the spatially-integrated spectrum where CO emission is detected at (colored pixels in Figure 2). The spectrum of the whole CO(1-0) emission (Figure 5) shows a double-peak profile, similar to the profile previously observed with the LMT (Longinotti et al., 2018). For both the LMT and NOEMA spectra, we fitted each velocity components with a Gaussian function to determine its characteristics (Table 2). The line widths were measured as the full width at half maximum (FWHM), while the fluxes correspond to the integration of the Gaussians. Using the flux density per main beam temperature ratio for a point source ( for the LMT), we find that the integrated flux of the LMT and NOEMA are consistent within .
| LMT | |||||
|---|---|---|---|---|---|
| Line | |||||
| (mK) | () | () | () | () | |
| blue | 6.00 | ||||
| red | 5.63 | ||||
| NOEMA | |||||
| Line | |||||
| (mJy) | () | () | () | () | |
| blue | 23.9 | ||||
| red | 24.5 | ||||
Notes.
is the flux density, while refers to the intensity collected in the main beam of the LMT, in units of temperature (i.e. main beam temperature).
For the LMT data, we recalculated the molecular gas mass using the new redshift estimate and .
While the peak temperature of the blue component is higher for the LMT spectrum, the height of both components is similar for the NOEMA spectrum. Such difference is likely due to the lower spectral resolution of the LMT observations (about ) which dilutes the signal into large sampling beams. The low spectral resolution can also explain the difference in the peak velocities (slightly higher with NOEMA) and in the line width of the blue component (larger with the LMT).
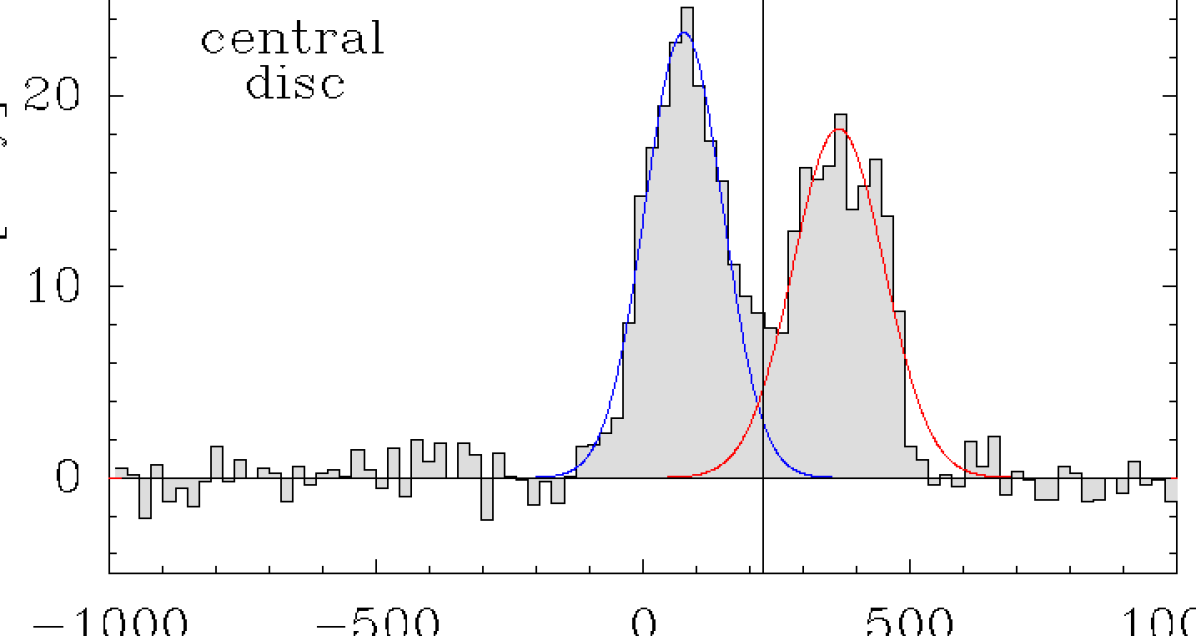
We then extracted the spatially-integrated spectrum for the central disc only (magenta ellipse in Figure 2). The spectrum also shows a double-peak profile (Figure 6), indicating that the molecular gas within the central disc is rotating. However, both CO velocity components have positive peak velocities, while a negative and a positive components are expected in the case of rotation. This indicates that the optical and CO emission do not have the same zero velocity.
| Line | |||||
|---|---|---|---|---|---|
| (mJy) | () | () | () | () | |
| blue | 23.4 | ||||
| red | 18.3 |
Note. A conversion factor was used for the molecular gas mass.
The nominal redshifted frequency of our NOEMA observations is 108.705 GHz, based on the optically estimated redshift. Using the CO emission, we find a new systemic velocity (corresponding to the centre of the double-peak) redshifted by from the nominal frequency. This corresponds to a redshifted frequency of 108.6233 GHz. We thus get a CO-estimated redshift , which corresponds to a luminosity distance of 274.3 Mpc. Note that two independent measurements with NOEMA and LMT give the same results on the shape of the molecular emission. The difference between the optical and CO redshifts is about a factor of 3 larger than the uncertainty on the optical redshift. Therefore, we conclude that this difference is real and might be the result of outflowing gas within the narrow-line region. Future integral field spectroscopy observations will be necessary to investigate in more detail the difference of redshifts.
3.3 Molecular gas mass
In order to estimate the mass of the molecular gas, we used the formulae from Solomon et al. (1997) for the CO luminosity:
| (1) | |||||
| (2) |
where is the telescope main beam in arcsec2, is the luminosity distance in Mpc, is the integrated line intensity in , is the velocity-integrated flux in , and is the rest frequency of CO in GHz. The CO luminosity is given in . Then, applying a CO luminosity-to-H2 mass conversion factor , typical for ULIRGs (Solomon & Vanden Bout, 2005), we found a total molecular gas mass within the central disc. Lee et al. (2016) reported an IR luminosity , with AGN contributing to about 44%. Therefore, after correcting the IR luminosity for the AGN contamination, we derived a star formation rate using the formula of Murphy et al. (2011); Kennicutt & Evans (2012). This gives a molecular depletion time , in agreement with the depletion times found by Combes et al. (2013) for a sample of 39 ULIRGs. We note that the central disc contains most of the molecular gas with a mass (Table 3).
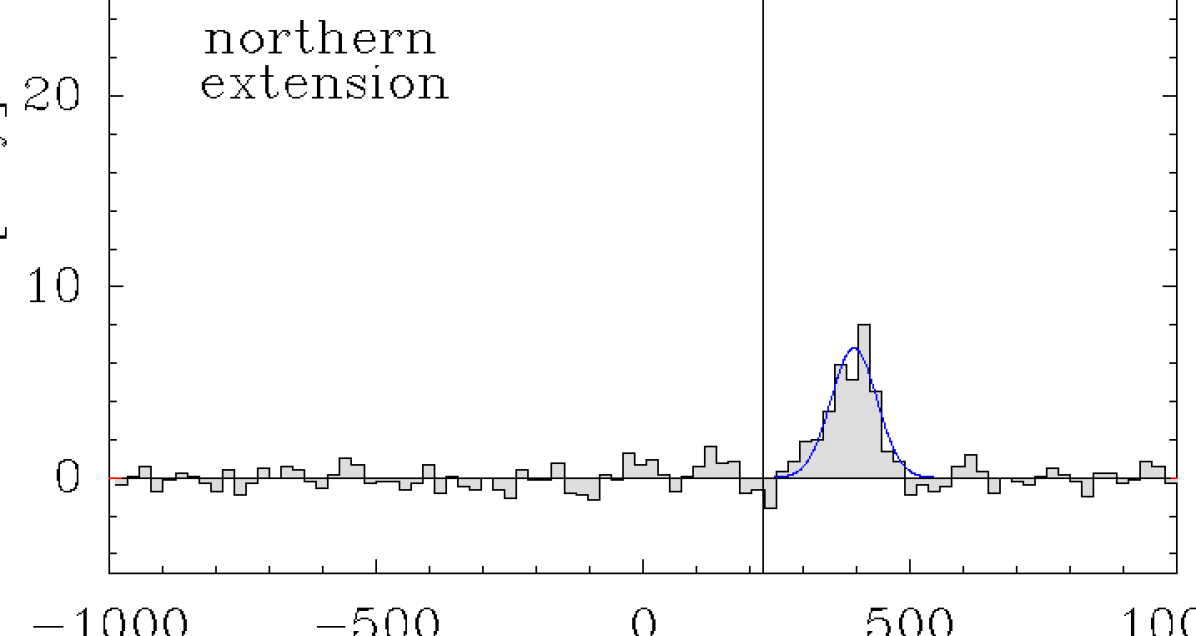
We extracted the CO spectrum from the northern extension (Figure 7). The CO emission shows one single line at a peak velocity of about (see Table 4). Therefore, the northern extension is moving away from the central disc at . The integrated flux is , which corresponds to a CO luminosity . Assuming the same CO-to-H2 conversion factor as in the main galaxy, we find a molecular gas mass .
| (mJy) | () | () | () | () |
|---|---|---|---|---|
| 6.8 |
Note. A conversion factor was used for the molecular gas mass.
3.4 A molecular outflow in the north
In the left panel of Figure 4, there is an hint of an extra component in the velocity range . We thus investigated this velocity range and found a bright spot of radius at an offset of , in projection on the northern extension (Figure 8). We extracted the integrated spectrum over the spot. An additional line is detected at at a velocity of (Figure 8). After redshift correction, the velocity with respect to the main galaxy is , similar to the velocity of the massive molecular outflow reported in the LMT data by Longinotti et al. (2018)
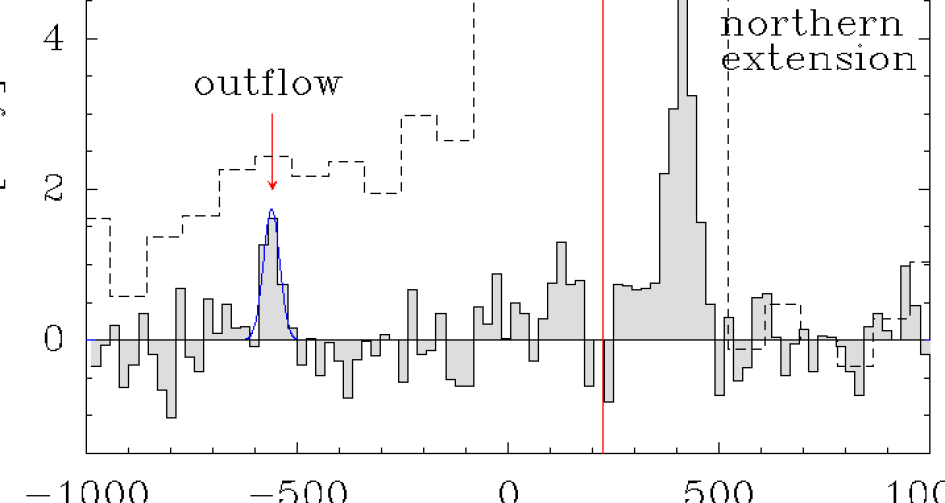
The integrated flux is (Table 5), which gives a CO luminosity . Note that the uncertainty is mainly due to the uncertainty on the line width. Estimating the molecular gas mass of the outflow is not straightforward due to the CO-to-H2 conversion factor . So far, there is no data set which can be used to evaluate precisely in the outflow of IRAS17. Therefore, we estimate the molecular gas mass using two values of : 0.5 (ie. 1/10 the Galactic value Feruglio et al. 2010; Longinotti et al. 2018) and 0.8 (ie. the typical value for ULIRGS Cicone et al. 2012; Cicone et al. 2014; Veilleux et al. 2017). We therefore derive a molecular gas mass within the outflow of (Table 5). Since the ongoing study of the massive molecular outflow of IRAS17 as seen with NOEMA will be presented in a companion paper (Longinotti et al., in prep.), more details on the properties of this additional outflow will be included and discussed in the context of the outflowing molecular gas within the system.
| (mJy) | () | () | () | () |
|---|---|---|---|---|
| 1.74 |
Note. To calculate the molecular gas mass, we used two value for the conversion factor : (1/10 of the Galactic value) and (typical of ULIRG).
4 Analysis of the CO kinematics

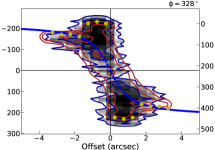
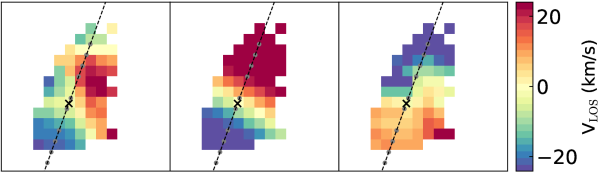
In this section, we will focus on the molecular gas kinematics. We started by producing the position-velocity (PV) diagram along the major axis (∘) of the whole CO(1-0) emission using the ”3D-Based Analysis of Rotating Objects from Line Observations” software (3DBAROLO; Di Teodoro & Fraternali 2015). The northern extension is clearly identified: while the average velocity is consistent with the rotation curve, most of the emission in this region does not follow the rotation (Figure 9 - left panel). We therefore conduct a separate analysis for the central disc (hereafter the main galaxy) and the northern extension.
4.1 The main galaxy: a disc or a ring?
We used 3DBAROLO to compute and characterise the PV diagram of the main galaxy along the major axis (∘). We run the code using a fixed central position at the brightest pixel in the moment 0 map and a fixed position angle. We enable the inclination to vary in between ∘∘. The PV diagram shows the presence of two components (Figure 9 - middle panel): (1) a ”flat” rotation curve reaching in a few hundred parsecs, and (2) a lower velocity component reaching at a radius of several kiloparsecs. Such PV diagram is typical of a barred galaxy, where the bar produces higher velocities in the inner region (Binney et al., 1991; García-Burillo & Guelin, 1995). The outer yellow dots in Figure 9 likely correspond to the rotation of the molecular gas. We thus parametrise the rotation curve by fitting these points with the function:
| (3) |
where {, } are free parameters (Courteau, 1997; Lang et al., 2020).
We then used a simple analytical axisymmetric model which computes the velocity spectrum (Wiklind et al., 1997; Salomé et al., 2015). Given a radial rotation velocity profile and a gas distribution , the model calculates the velocity spectrum:
| (4) |
Here, we use the rotation curve derived from equation 3. The gas distribution is described by a Toomre disc of order 2 (Toomre, 1964) or a ring, which is the difference between two Toomre discs of caracteristic radii and . To take into account the gas velocity dispersion, we convolve the computed spectrum with a Gaussian of . The observed resolution is (the channel width). Considering the velocity dispersion given by 3DBAROLO, we therefore convolved by a Gaussian with .
We ran a grid of models for a disc/ring of (see Figure 6 and Table 3), with an outer characteristic radius from a few hundred parsecs to 6 kpc and an inner characteristic radius from 0 to a few tens of parsecs below ( corresponds to a disc). We evaluate the best fitting models by looking at the peak velocity of the double peak. The peak velocity is between (Table 3 with correction of the velocity shift). However, to be conservative, we use the central 5% which correspond to . Therefore, we consider the models for which the peak velocity is .
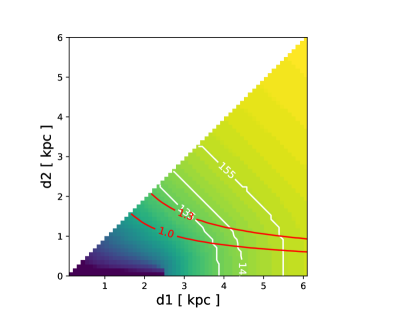

We find that the gas distribution can be described by and (Figure 10 - left). This corresponds to either a disc or a ring of molecular gas with surface density-weighted average radii and a maximum surface density reached at a radius (Figure 10 - right). However, an extended ring of gas with is very unlikely as it would be partially resolved in our observations. Therefore, the best fitting model is likely and . In the case of a ring, this can indicate that the AGN activity affects the molecular gas within the centre, by expelling the molecular gas via a wind/outflow, or by photodissociating the molecular gas.
Observations at higher resolution will be necessary to disentangle between these two possibilities: disc or ring. Note that we cannot exclude that the molecular gas of the main galaxy is distributed neither in a disc nor a ring, as observed in star-forming barred spiral galaxies (Sheth et al., 2002).
4.2 The northern extension: a dwarf companion
In this section, we investigate the nature of the northern extension. As seen in Section 2.3, the optical redshift in this region differs from the central disc by (Figure 1), which corresponds to a velocity difference . Moreover, the CO emission within the northern extension is redshifted by about with respect to the centre of the main galaxy (Figure 7). Finally, as shown in Figure 9, we do not observe a southern counterpart and the CO emission does not follow the global rotation of the galaxy. All this suggests that the northern extension could be dynamically separated from IRAS 17020+4544.
We produced the PV diagram of the northern extension with 3DBAROLO. The PV diagram reveals a clear rotation pattern with an amplitude of (Figure 9 - right panel). For a rotation velocity of , we derive a dynamical mass , one order of magnitude larger than the molecular gas. This is suggesting that the rotation is likely driven by a dark matter halo, strenghtening our hypothesis on the presence of a previously unknown dwarf galaxy.
5 Discussion and conclusion
In this article, we have presented new NOEMA observations of the CO(1-0) emission within the nearby NLSy1 IRAS 17020+4544. These observations allow the spatially resolved properties of the molecular gas content within the galaxy to be characterised for the first time. Most of the CO emission is distributed within an apparent central disc of radius and of mass . Molecular gas was also found up to 8.2 kpc north from the centre.
In this northern extension, the molecular gas has a mass of about (see Section 3.3), much larger than the typical mass of a giant molecular cloud (, e.g. Miville-Deschênes et al. 2017). The PV diagram reveals that the gas dynamics is dominated by rotation (see Section 4.2), however this rotation is highly distorted (see Figure 11). Finally, a ”bridge” of material between the northern extension and the central disc is observed (Figure 12), at a velocity relative to the northern extension ( relative to the central disc). All this indicates that the CO emission in the northern extension likely comes from a companion galaxy of diameter which is interacting with IRAS17. This gives a completely new vision of IRAS17. Before the present discovery, it was difficult to reconcile the presence of multi-phase outflows, as traced by the X-ray UFO and the massive molecular wind, in an apparently unperturbed and perfectly standard spiral galaxy. Instead, it is now conceivable that the interaction plays a major role in triggering the nuclear activity via accretion onto the central super massive black hole.
Nevertheless, IRAS17 does not show noticeable disturbances in optical images, neither in the dynamics of the CO emission. Therefore, the two galaxies are probably at an early phase of a minor merger (first passing?), which could have driven gas to the central region of the main galaxy, producing a starburst (making IRAS17 a LIRG) and initiating the active phase. Recently Olguín-Iglesias et al. (2020) reported deep near-infrared imaging for 29 radio-loud NLSy1 which is strongly indicating that their hosts are preferentially disc galaxies with signs of interaction. This result tells us about the importance of the interaction process in triggering the relativistic jets since a clear majority of the jetted NLSy1 studied so far are found in interacting systems (see also Antón et al. 2008; Järvelä et al. 2018; Berton et al. 2019). However, for IRAS17, Olguín-Iglesias et al. (2020) did not report any sign of interaction, which supports the idea of an early phase of a minor merger.
Note that the optical emission lines at the northern position (spectrum A in Figure 1) are blueshifted by with respect to the CO emission. However, the line ratios in this region are typical of ionization by massive stars. The velocity shift thus tends to indicate that the optical emission is unlikely associated with H\@slowromancapii@ regions. This suggests that the optical emission might not be coming from the companion galaxy, but from the main galaxy. With the present optical observations it is not possible to conclude about this velocity difference, but proprietary data recently collected with the optical integral field spectroscopy instrument MEGARA on the GTC telescope may shed light on this issue (Robleto-Orús et al., in prep.).
The resolution of the NOEMA observations enabled us to study the gas dynamics within the main galaxy. The PV diagram is typical of a barred galaxy. We fitted the rotational part of the PV diagram, which at large galactic radii reaches an asymptotic rotation velocity around . The analytical axisymmetric model of Wiklind et al. (1997) was used to compute the velocity spectrum, given a radial rotation velocity profile and a gas distribution. This simple model reveals that the molecular gas as traced by the CO emission is distributed within a disc or a ring with an inner radius smaller than the resolution of our observations.
By applying a new modeling of the morphology of the host galaxy on the NOT observations from Olguín-Iglesias et al. (2020), Olguín-Iglesias et al. (in prep.) are finding that their model predicts a disk-like (pseudo-)bulge morphology with presence of a bar. Their results show that that the bar is long (according to Hubble types SB0-SBa), while the bar strength is rather average along all Hubble types. Moreover, the surface brightness matches the morphology of a barred spiral galaxy, namely SBa. This is challenging the distribution of the CO emission in IRAS17, as the molecular gas usually presents a more complex distribution in star-forming barred spiral galaxies (Sheth et al., 2002). Higher resolution is now necessary to disentangle between the two scenarios (disc/ring vs. complex distribution) and study the effect of the central AGN on the host galaxy ISM at small scales. The MEGARA data will bring complementary information, which is critical to better understand the host galaxy.
Finally, we have detected a molecular outflow of within the north, in projection on the companion galaxy, with a radial velocity in agreement with that of the outflow detected with the LMT by Longinotti et al. (2018). The properties of this outflow and its possible connection with the X-ray UFO will be discussed in a companion paper (Longinotti et al., in prep.) dedicated to the study of the massive molecular outflow as observed by NOEMA.
Acknowledgements
We thank the referee for his/her comments. We also thank África Castillo-Morales for the constructive discussions.
This work is based on observations carried out under project number W17CR with the IRAM NOEMA Interferometer. IRAM is supported by INSU/CNRS (France), MPG (Germany) and IGN (Spain).
Q.S. and A.L.L. acknowledge support from CONACyT research grant CB-2016-01-286316.
YK acknowledges support from UNAM-DGAPA-PAPIIT grant IN106518 and PAPIIT-PASPA.
This work was partially supported by CONACyT research grant 280789.
Data availability
The NOEMA data underlying this article will be shared on reasonable request to the corresponding author.
References
- Aalto et al. (2017) Aalto S., et al., 2017, A&A, 608, A22
- Alonso-Herrero et al. (2019) Alonso-Herrero A., et al., 2019, A&A, 628, A65
- Antón et al. (2008) Antón S., Browne I. W. A., Marchã M. J., 2008, A&A, 490, 583
- Audibert et al. (2019) Audibert A., et al., 2019, A&A, 632, A33
- Berton et al. (2019) Berton M., et al., 2019, AJ, 157, 48
- Binney et al. (1991) Binney J., Gerhard O. E., Stark A. A., Bally J., Uchida K. I., 1991, MNRAS, 252, 210
- Bischetti et al. (2019) Bischetti M., et al., 2019, A&A, 628, A118
- Cicone et al. (2012) Cicone C., Feruglio C., Maiolino R., Fiore F., Piconcelli E., Menci N., Aussel H., Sturm E., 2012, A&A, 543, A99
- Cicone et al. (2014) Cicone C., et al., 2014, A&A, 562, A21
- Combes et al. (2013) Combes F., García-Burillo S., Braine J., Schinnerer E., Walter F., Colina L., 2013, A&A, 550, A41
- Courteau (1997) Courteau S., 1997, AJ, 114, 2402
- Di Teodoro & Fraternali (2015) Di Teodoro E. M. D., Fraternali F., 2015, MNRAS, 451, 3021
- Doi et al. (2007) Doi A., et al., 2007, PASJ, 59, 703
- Feruglio et al. (2010) Feruglio C., Maiolino R., Piconcelli E., Menci N., Aussel H., Lamastra A., Fiore F., 2010, A&A, 518, L155
- Feruglio et al. (2015) Feruglio C., et al., 2015, A&A, 583, A99
- García-Burillo & Guelin (1995) García-Burillo S., Guelin M., 1995, A&A, 299, 657
- García-Burillo et al. (2019) García-Burillo S., et al., 2019, A&A, 632, A61
- Giroletti et al. (2017) Giroletti M., Panessa F., Longinotti A. L., Krongold Y., Guainazzi M., Costantini E., Santos-Lleo M., 2017, A&A, 600, A87
- Gofford et al. (2013) Gofford J., Reeves J. N., Tombesi F., Braito V., Turner T. J., Miller L., Cappi M., 2013, MNRAS, 430, 60
- Harrison et al. (2014) Harrison C. M., Alexander D. M., Mullaney J. R., Swinbank A. M., 2014, MNRAS, 441, 3306
- Harrison et al. (2018) Harrison C. M., Costa T., Tadhunter C. N., Flütsch A., Kakkad D., Perna M., Vietri G., 2018, Nature Astronomy, 2, 198
- Järvelä et al. (2018) Järvelä E., Lähteenmäki A., Berton M., 2018, A&A, 619, A69
- Kennicutt & Evans (2012) Kennicutt R. C., Evans N. J., 2012, ARA&A, 50, 531
- King & Pounds (2015) King A., Pounds K., 2015, ARA&A, 53, 115
- Komossa & Bade (1998) Komossa S., Bade N., 1998, A&A, 331, L49
- Lang et al. (2020) Lang P., et al., 2020, ApJ, 897, 122
- Lee et al. (2016) Lee J. C., Hwang H. S., Lee G., 2016, ApJ, 833, 188
- Leighly et al. (1997) Leighly K. M., Kay L. E., Wills B. J., Wills D., Grupe D., 1997, ApJ, 489, L137
- Longinotti et al. (2015) Longinotti A. L., Krongold Y., Guainazzi M., Giroletti M., Panessa F., Costantini E., Santos-Lleo M., Rodriguez-Pascual P., 2015, ApJ, 813, L39
- Longinotti et al. (2018) Longinotti A. L., et al., 2018, ApJ, 867, L11
- Miville-Deschênes et al. (2017) Miville-Deschênes M., Murray N., Lee E. J., 2017, ApJ, 834, 57
- Murphy et al. (2011) Murphy E. J., et al., 2011, ApJ, 737, 67
- Ohta et al. (2007) Ohta K., Aoki K., Kawaguchi T., Kiuchi G., 2007, ApJS, 169, 1
- Olguín-Iglesias et al. (2020) Olguín-Iglesias A., Kotilainen J., Chavushyan V., 2020, MNRAS, 492, 1450
- Salomé et al. (2015) Salomé Q., Salomé P., Combes F., 2015, A&A, 574, A34
- Sanfrutos et al. (2018) Sanfrutos M., Longinotti A. L., Krongold Y., Guainazzi M., Panessa F., 2018, ApJ, 868, 111
- Sheth et al. (2002) Sheth K., Vogel S. N., Regan M. W., Teuben P. J., Harris A. I., Thornley M. D., 2002, AJ, 124, 2581
- Snellen et al. (2004) Snellen I. A. G., Mack K., Schilizzi R. T., Tschager W., 2004, MNRAS, 348, 227
- Solomon & Vanden Bout (2005) Solomon P., Vanden Bout P., 2005, ARA&A, 43, 677
- Solomon et al. (1997) Solomon P. M., Downes D., Radford S. J. E., Barrett J. W., 1997, ApJ, 478, 144
- Tombesi et al. (2012) Tombesi F., Cappi M., Reeves J. N., Braito V., 2012, MNRASL, 422, L1
- Tombesi et al. (2015) Tombesi F., Meléndez M., Veilleux S., Reeves J. N., González-Alfonso E., Reynolds C. S., 2015, Nature, 519, 436
- Toomre (1964) Toomre A., 1964, ApJ, 139, 1217
- Vaughan et al. (1999) Vaughan S., Reeves J., Warwick R., Edelson R., 1999, MNRAS, 309, 113
- Veilleux et al. (2017) Veilleux S., Bolatto A., Tombesi F., Meléndez M., Sturm E., González-Alfonso E., Fischer J., Rupke D. S. N., 2017, ApJ, 843, 18
- Wang & Lu (2001) Wang T., Lu Y., 2001, A&A, 377, 52
- Wiklind et al. (1997) Wiklind T., Combes F., Henkel C., Wyrowski F., 1997, A&A, 323, 727
- de Grijp et al. (1992) de Grijp M. H. K., Keel W. C., Miley G. K., Goudfrooij P., Lub J., 1992, A&A, 96, 389