Variation of dust properties with cosmic time implied by radiative torque disruption
Abstract
Dust properties within a galaxy are known to change from the diffuse medium to dense clouds due to increased local gas density. However, the question of whether dust properties change with redshift remains elusive. In this paper, using the fact that the mean radiation intensity of the interstellar medium (ISM) of star-forming galaxies increases with redshift, we show that dust properties should change due to increasing efficiency of rotational disruption by radiative torques, an effect named RAdiative Torque Disruption (RATD). We first show that, due to RATD, the size distribution of interstellar dust varies with redshift, such as dust grains become smaller at higher . We model the extinction curves and find that the curve becomes steeper with increasing redshift. The ratio of total-to-selective extinction, , decreases with redshift and achieves low values of for grains having a composite structure. We also find that dust properties change with the local gas density due to RATD, but the change is dominated by the radiation field for the diffuse ISM. The low values of implied by RATD of interstellar dust could reproduce anomalous dust extinction observed toward type Ia supernovae (SNe Ia) and Small Magellanic Cloud (SMC)-like extinction curves with a steep far-UV rise toward high-z galaxies. Fluctuations in due to interstellar turbulence and varying radiation intensity may resolve the tension in measurements of the Hubble constant using SNe Ia. We finally discuss the implications of evolving dust properties for high-z astrophysics.
1 Introduction
Interstellar dust is an essential component of the interstellar medium (ISM) and plays critical roles in astrophysics, including gas heating, star and planet formation, and grain-surface chemistry (see Mathis 1990 and Draine 2003 for reviews). Dust extinction and emission are key for extragalactic astrophysics, including measurements of star formation efficiency and understanding cosmic evolution (Calzetti 2001; see Salim & Narayanan 2020 for a review). Accurate measurements of star formation rate (SFR) depend crucially on dust properties, including grain size distribution, shape, and composition. Among the different dust properties, the grain size distribution is the most important parameter that determines emission, extinction, and polarization of dust.
Following the popular paradigm of dust evolution, stardust grains form in the dense outflows of evolved stars and in the dense ejecta of core-collapse supernovae, which dominantly produce large grains (Nozawa et al. 2003). Such large grains are then fragmented into small grains by shattering in shocks when being released into the diffuse ISM (Jones et al. 1994). Subsequently, interstellar dust is reprocessed in the ISM by growth (gas accretion and coagulation) and destruction processes, including sublimation, sputtering and shattering in shocks. Thus, the size distribution of interstellar dust is determined by the balance between growth and destruction processes in the ISM. On the other hand, dust properties are expected to change from the diffuse ISM (with gas density less than ) to dense molecular clouds (density above ) due to gas accretion and grain coagulation (Zhukovska et al. 2016). This process is mostly determined by gas density that controls gas-grain and grain-grain collision rates. The above dust evolution cycle inevitably changes the internal structure of grains, from a presumably compact structure for stardust to a composite structure for interstellar dust (Mathis 1990; Draine & Hensley 2020). Therefore, dust properties in the ISM of a galaxy are expected to change. The question now is, assuming the same gas density of the ISM, whether and how dust properties change with cosmic time (i.e., redshift).
Recently, Hoang et al. (2019) introduced a new physical mechanism of dust destruction that changes the size distribution of interstellar grains due to radiative torques (RATs), which was termed Radiative Torque Disruption (RATD). The basic idea of the RATD mechanism is that, dust grains of irregular shape, when irradiated by anisotropic radiation field, experiences RATs (Dolginov & Mitrofanov 1976; Draine & Weingartner 1996; Lazarian & Hoang 2007) and can be spun-up to extremely fast rotation (Draine & Weingartner 1996; Hoang & Lazarian 2009). Resulting centrifugal stress can exceed the maximum tensile strength of grain material, resulting in the disruption of the grain into fragments. Previously, Silsbee & Draine (2016) noticed that interplanetary grains of fluffy structure could be disrupted by RATs induced by solar radiation. Since rotational disruption acts to break loose bonds between the grain constituents, unlike breaking strong chemical bonds between atoms in thermal sublimation, RATD can work with the average interstellar radiation field (see Hoang 2020 for a review). The RATD mechanism introduces a new environment parameter for dust evolution, namely local radiation intensity, and is found to be the most efficient mechanism that constrains the upper limit of the size distribution (Hoang 2019). Simulations of grain evolution with cosmic time in Hirashita & Hoang (2020) show that RATD is indeed the key factor determining the upper cutoff of the size distribution. The efficiency of RATD depends on the local conditions, including gas density and radiation field, grain properties (internal structure, size, and shape) (Hoang, 2019), and grain alignment (Lazarian & Hoang 2020). Therefore, if the density and radiation strength vary with redshift, the local environment changes, dust properties should change accordingly.
It is well-known that star formation rate (SFR) increases with redshift (see Bethermin et al. 2015 and references therein). Since the mean intensity of the ISM of galaxies is governed by star formation activity, it is expected to increase with . Numerous observations reveal the increase of dust temperature with redshift (Ouchi et al. 1999; Magdis et al. 2012; Faisst et al. 2017; Bethermin et al. 2015; Ferrara et al. 2017; Hirashita et al. 2017; Sommovigo et al. 2020). Theoretical studies (del P Lagos et al. 2012; Cowley et al. 2017; Imara et al. 2018) and cosmological simulations (Narayanan et al. 2018) imply the increase of the mean radiation intensity with redshift. Hwang et al. (2010) also found the increase of with redshift using Herschel. Other studies of star-forming galaxies also report the increase of the mean radiation intensity with redshift (Magdis et al. 2012; Lim et al. 2020). Thus, the interstellar radiation field is stronger in higher-z galaxies than in the Galaxy. As a result, interstellar grains experience stronger RATs, and rotational disruption is more efficient, resulting in smaller grains with increasing . We will quantify this effect using the established relationship of the mean radiation intensity with and explore its observational consequences.
The structure of the present paper is as follows. In Section 2, we describe the interstellar radiation field of galaxies at different redshift inferred from observations that will be used for our study. In Section 3, we briefly review the basic features of Radiative Torques (RATs) and rotational disruption by radiative torques (RATD) mechanism, and derive the critical grain size for rotational disruption. In Section 4, we present numerical results for the disruption size and calculate resulting extinction curves using the size distribution constrained by RATD for different redshift and local gas density. In Section 5, we discuss the implications of our results for understanding anomalous dust properties observed toward type Ia supernovae (SNe Ia) and high-z astrophysics. A summary of our main findings is given in Section 6.
2 Interstellar radiation field of galaxies
Let be the spectral energy density of radiation field at wavelength . The energy density of the radiation field is then . To describe the strength of a radiation field, let define with being the energy density of the average interstellar radiation field (ISRF) in the solar neighborhood as given by Mathis et al. (1983). Thus, the typical value for the ISRF in the solar neighborhood is .
For star-forming galaxies, Bethermin et al. (2015) derived the best-fit for the increase of the mean radiation intensity with redshift from as
| (1) |
where is the mean intensity at and is the power-law index (Magdis et al. 2017; Schreiber et al. 2018).
3 Review of Rotational Disruption by Radiative Torques
3.1 Radiative torques of irregular grains
Dust grains of irregular shape irradiated by an anisotropic radiation experience Radiative Torque (RAT). The magnitude of RAT is defined as
| (3) |
where is the anisotropy degree of the radiation field, is the RAT efficiency, and is the effective size of the grain which is defined as the radius of the sphere with the same volume as the irregular grain (Draine & Weingartner 1996; Lazarian & Hoang 2007).
The magnitude of RAT efficiency, , can be approximated by a power-law (Hoang & Lazarian 2008):
| (4) |
where for and for .
Numerical calculations of RATs for several shapes of different optical constants in Lazarian & Hoang (2007) find the slight difference in RATs among the realization. An extensive study for a large number of irregular shapes by Herranen et al. (2019) shows little difference in RATs for silicate, carbonaceous, and iron compositions. Moreover, the analytical formula (Equation 4) is also in a good agreement with their numerical calculations. Therefore, one can use Equation (4) for the different grain compositions and grain shapes, and the difference is an order of unity
Let be the mean wavelength of the radiation field. For the spectrum of the ISRF in our galaxy, (Hoang et al. 2020). We assume that the spectrum of the ISRF of galaxies is similar to the Galaxy, so that the value of remains the same with redshift. In reality, is expected to be smaller for higher due to bluer radiation emitted by more massive stars.
The average radiative torque efficiency over the spectrum is defined as
| (5) |
where the integrals are taken over the entire radiation spectrum.
For interstellar grains with , can be approximated to (Hoang & Lazarian 2014)
| (6) |
where , and for . Hoang et al. (2020) used rigorous mathematical derivations for the mean RAT and find that the above scaling is a good fit to numerical calculations for the ISRF.
Therefore, the average RAT can be given by
| (7) | |||||
for , and
| (8) |
for , where the mean wavelength is normalized over the optical wavelength,
The well-known damping process for a rotating grain is sticking collision with gas species (atoms and molecules), followed by their thermal evaporation. Thus, for a gas with He of abundance, the characteristic damping time is
| (9) | |||||
where is the grain inertia moment of spherical grain of effective radius , with being the dust mass density, is the thermal velocity of a gas atom of mass in a plasma with temperature and density (Draine & Weingartner 1996; Hoang & Lazarian 2009). The gas damping time is estimated for spherical grains, and we disregard the factor of unity due to grain shape.
Infrared (IR) photons emitted by the grain carry away part of the grain’s angular momentum, resulting in the damping of the grain rotation. For strong radiation fields or not very small sizes, grains can achieve equilibrium temperature, such that the IR damping coefficient (see Draine & Lazarian 1998) can be calculated as
| (10) |
Other rotational damping processes include plasma drag, ion collisions, and electric dipole emission. These processes are mostly important for polycyclic aromatic hydrocarbons (PAHs) and very small grains of radius (Draine & Lazarian 1998; Hoang et al. 2010; Hoang et al. 2011). Thus, the total rotational damping rate by gas collisions and IR emission can be written as
| (11) |
For strong radiation fields of and not very dense gas, one has . Therefore, , which does not depend on the gas properties. In this case, the only damping process is caused by IR emission.
For radiation sources with stable luminosity considered in this paper, radiative torque, , is constant, and the grain velocity is steadily increased over time. The equilibrium rotation can be achieved at (see Lazarian & Hoang 2007; Hoang & Lazarian 2009; Hoang & Lazarian 2014):
| (12) |
The rotation rate by RATs is given by
| (13) | |||||
for grains with , and
| (14) | |||||
for grains with .
Above, , , is the anisotropy of radiation field relative to the typical anisotropy of the diffuse interstellar radiation field. The radiation anisotropy degree also varies with the location, between for the diffuse ISM (Draine & Weingartner 1997) to for molecular clouds (Bethell et al. 2007), and for grains close to a star. For our study here for the diffuse ISM, we adopt the typical value of . The mean wavelength is fixed to , although it may decrease with redshift due to harder radiation field.
3.2 Maximum grain size constrained by Radiative Torque Disruption
A spherical dust grain of radius rotating at velocity develops an average tensile stress due to centrifugal force which scales as (see Hoang et al. 2019)
| (15) |
When the rotation rate is sufficiently high such as the tensile stress exceeds the maximum limit, namely tensile strength , the grain is disrupted. The critical rotational velocity is given by :
| (16) | |||||
where (Hoang et al. 2019).
The tensile strength of interstellar dust depends on grain structure (compact vs. composite vs core-mantle), which is uncertain (Mathis 1990). Compact grains should have large tensile strength of , whereas composite/fluffy grains have much lower tensile strength (Hoang, 2019). Large grains (radius ) are expected to have composite structure as a result of coagulation process in molecular clouds or in the ISM. Numerical simulations for porous grain aggregates from Tatsuuma et al. (2019) find that the tensile strength decreases with increasing the monomer radius and can be fitted with an analytical formula (see Kimura et al. 2020 for more details)
| (17) | |||||
where is the surface energy per unit area of the material, is the monomer radius, and is the volume filling factor of monomers. For large grains () made of monomers of radius and , Equation (17) implies .
Throughout this paper, we assume that large grains have composite structure, as expected from grain evolution model in the ISM (Mathis 1990) and adopt , yielding the typical tensile strength of . We also explore the possibilities that grains are made of smaller monomers () or have core-mantle and compact structures with larger tensile strength of .
For an arbitrary radiation field and , one obtains
| (18) | |||||
which depends only on the local gas density and temperature. The disruption size is the function of two parameters, gas density and the radiation strength.
Using the relationship between and redshift (Eq. 1), one obtains
| (19) | |||||
where . This equation implies the inversely decrease of the disruption size with redshift as .
Due to the decrease of the rotation rate for (see Eq. 14), there exist a maximum size, , of grains that can still be disrupted by centrifugal stress (Hoang & Tram 2020). Setting given by Equation (14) yields,
| (20) | |||||
which implies for with .
For strong radiation fields or low density such as , IR damping dominates, then, the disruption size becomes independent of gas density,
| (21) | |||||
which corresponds to
| (22) | |||||
for .
In general, due to dependence of on the grain size , one cannot obtain analytical as in Equation (21). Thus, we first calculate numerically using Equation (13) and compare it with to find numerically, which will be referred to as numerical results. Note that the disruption size is assumed to be the same for silicate and carbonaceous grains. The results are shown in the next section.
4 Grain Size Distribution and Extinction curves across cosmic time
4.1 Grain size distribution
The grain size distribution of dust is usually described by a power law,
| (23) |
where denotes the grain composition (silicate and graphite), is the normalization constant, and is the power slope.
For the standard ISM in our galaxy, Mathis et al. (1977) derived the slope , for silicate grains, and for graphite grains. The size distribution has a lower cutoff of Å determined by thermal sublimation due to temperature fluctuations of very small grains (see e.g., Draine et al. 2007), and an upper cutoff of (Mathis et al. 1977). To account for the potential existence of large grains in the ISM, we assume when RATD is not accounted for. In the presence of RATD, the maximum size is determined by because . Therefore, as changes with redshift due to RATD (see Equation 19), the grain size distribution should change accordingly.
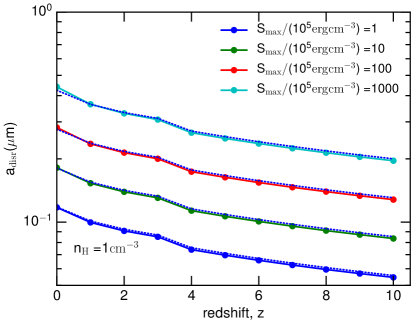
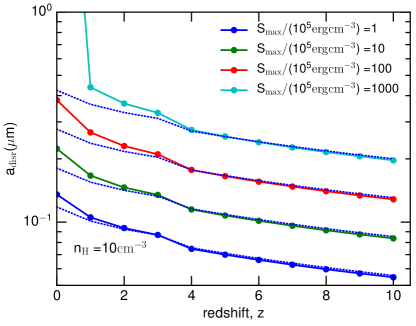
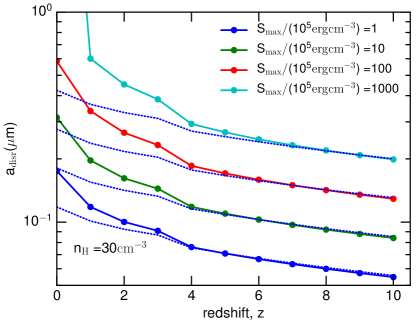
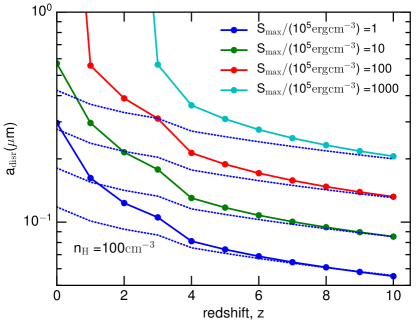
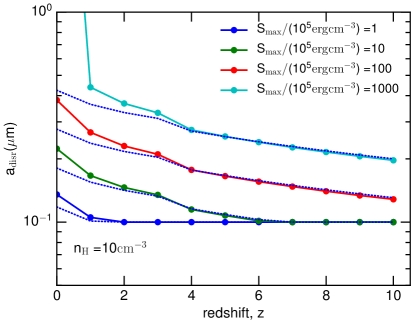
Figure 1 shows the variation of the disruption size with redshift for different density () and tensile strength () obtained from numerical calculations (solid lines) and analytical results where the gas damping is disregarded (dotted lines). We consider the maximum redshift of , corresponding to the age of Gyr. In general, analytical results obtained from Equation (21) converge to numerical results for sufficiently high with large radiation intensity but are lower than the numerical results for high density and low due to the effect of gas damping. For a given density, decreases gradually with redshift. For the typical density of and typical tensile strength of composite grains (), the disruption size decreases from at to at , and at . The disruption size is lower for grains with a lower tensile strength, as implied by Equation (18).
We also see that, for the low density cases (e.g., ), the disruption size changes slowly with as given by Equation (22) due to dominance of IR damping. However, its change with is stronger for a higher density () until the radiation field becomes sufficiently large for dominance of IR damping.
4.2 Extinction curves and
The extinction of starlight by interstellar dust at wavelength in the unit of magnitude per H is calculated as
| (24) |
where with the path length is the column density, is the grain size distribution of dust component with the minimum size and the maximum size is taken to be , is the cross-section of dust component which are calculated for oblate spheroidal grains of axial ratio of in Hoang et al. (2013) assuming optical constant of astrosilicate and graphite (Draine & Lee, 1984).
Using the disruption size obtained in Figure 1, we can calculate the wavelength-dependence extinction by dust being modified by RATD using Equation (24).
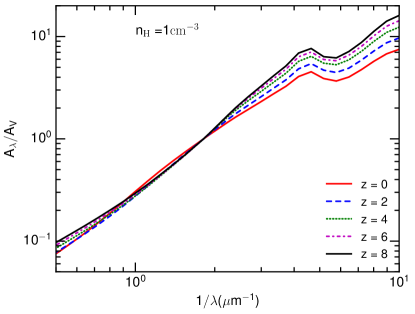
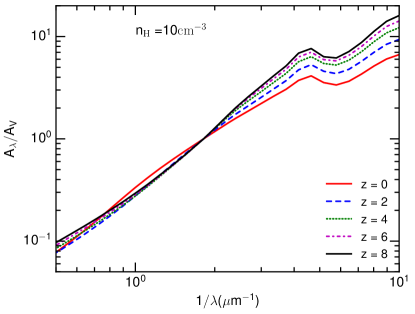
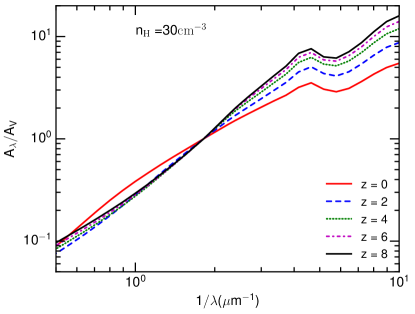
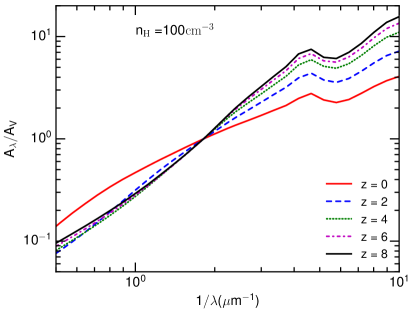
Figure 2 shows the normalized extinction curves () at different redshift for different gas density and , assuming that grains have composite structure with . In general, the UV extinction increases while the optical-NIR extinction decreases with redshift, resulting in steeper extinction curves. This arises from the effect of RATD that breaks large grains of into smaller ones. Indeed, since larger grains have higher contribution to extinction at optical-NIR wavelength and small grains contribute more to UV extinction, the conversion of large to small grains decreases optical-NIR extinction and increases UV extinction. One can see that the magnitude of the increase in UV extinction with redshift appears to be stronger for higher density. This can be seen from the variation of disruption size with in Figure 1 where a larger variation in is seen for larger .
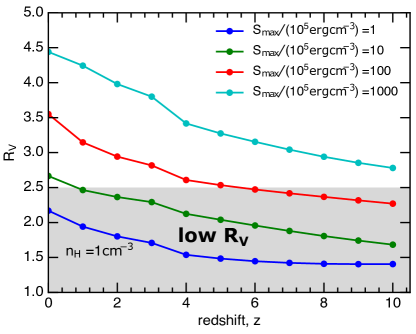
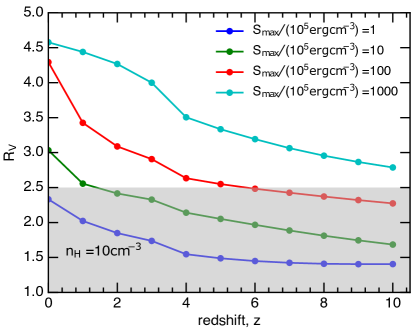
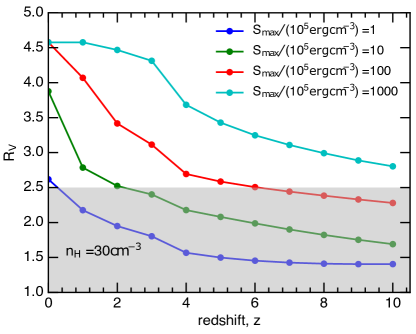
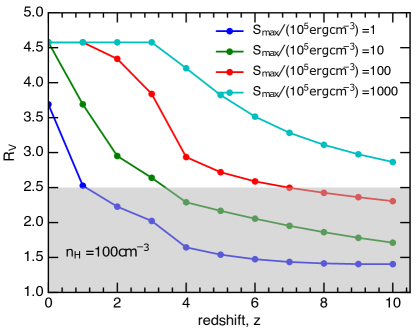
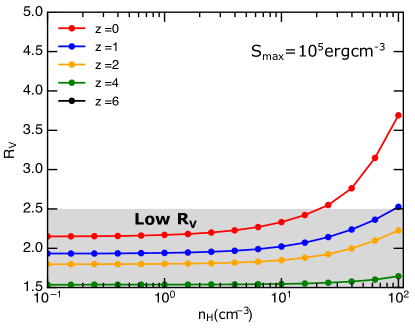
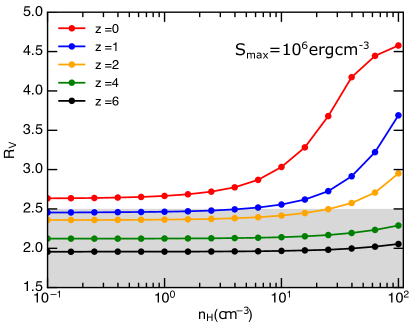
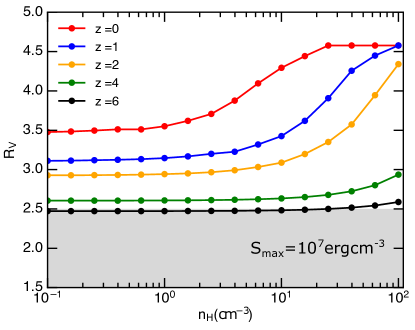
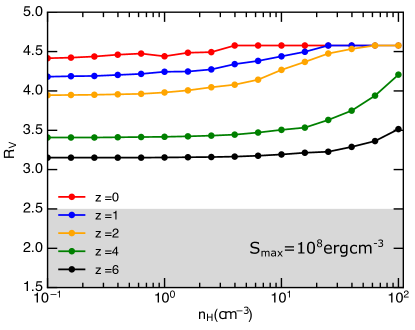
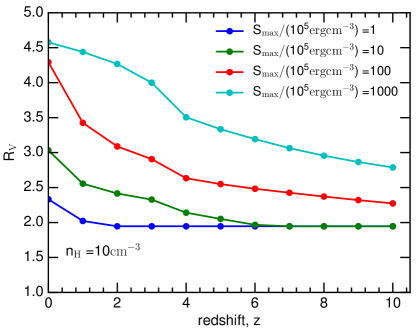
Using the obtained extinction curves, we calculate the ratio of total-to-selective extinction, . Figure 3 shows the decreases of with for different and gas density. The shaded regions highlight low values of .
For a given density, rapidly decreases with redshift. At a given redshift, decreases with decreasing . For the typical strength of composite grains (), one obtains for the considered gas densities, decreasing from at to for (see blue lines). For grains of strong material with (e.g., compact structure), one also see the decrease of with redshift, from at to at . For the diffuse medium with , composite grains all have low at high-z. We find that the decrease of occurs rapidly for . Above , the decrease of is slower because radiation intensity become sufficiently large that IR damping becomes dominant, and the disruption size slowly decreases with (see Eq. 21).
In Figure 4 we show the variation of with for different redshift and tensile strength. The value of increases with for , but it becomes saturate at higher due to the high radiation intensity that makes disruption independent of . For , the value is almost constant for and starts to increase rapidly for . At larger , the variation of is less pronounced in the considered range of gas density due to dominance of IR damping over gas damping.
4.3 Effect of varying tensile strength with grain structure
We now assume that grains smaller than are compact and have a high tensile strength of . Therefore, the disruption size cannot go below as shown in the left panel of Figure 5. We then run calculations of extinction curves and obtain as shown in the right panel of Figure 5. The value of decreases rapidly to its saturated value at for two cases of low strength of and . Grains with larger cannot be disrupted down to the core radius, so does not change.
5 Discussion
5.1 Smaller grains at higher redshifts
We have applied the RATD mechanism to study the variation of the grain size distribution across cosmic time. Since the grain internal structures that determine the tensile strength are uncertain, we consider a range of tensile strength between , which are implied by composite or core-mantle structures. We note that such structures are expected for interstellar dust due to various destruction and coagulation processes between the diffuse ISM and dense clouds (Mathis 1990; Draine & Hensley 2020).
Using the fact that the mean intensity of interstellar radiation increases with redshift (plausibly due to a higher star formation efficiency), we find that the disruption size that determines the maximum size of grains decreases rapidly with . Depending on the internal structure of grains, the maximum size can be larger for more compact grains of larger . If grains have a typical composite structure of , their maximum size is largest of at and rapidly decreases to at higher . Therefore, dust at higher is consequently dominated by small grains. Nevertheless, the presence of larger grains at high-z is not ruled out if they have a compact structure.
The disruption size also varies with the local gas density , but it becomes independent of for when the radiation intensity is sufficiently strong for rotational damping by IR emission becomes dominant over the gas damping at . We note that grain disruption is inefficient for dense molecular clouds without embedded stars where grain growth is driven by coagulation (Hirashita & Li, 2013). If molecular clouds contain embedded sources, rotational disruption is still efficient in proximity of the sources, as found in Hoang et al. (2020).
5.2 Steeper extinction curves, smaller , and implications for observations
Due to RATD, large grains are converted into smaller ones. As a result, the extinction curve becomes steeper with increasing redshift (see Figure 2).
The ratio of total-to-selective extinction, , is found to decrease with redshift. For composite grains, one has in the diffuse regions with (see Figure 3). For grains of higher tensile strength, could be larger than the standard , but its decreasing trend is observed. At , composite grains are not disrupted for dense regions of and increases to larger than . However, at high-z, disruption is still efficient at such high density and only exceeds if grains are compact (see Figure 4).
In starburst galaxies with star formation activities and supernova explosions, observations usually show peculiar extinction curves with a steep far-UV rise, SMC-like curve (Gordon et al., 1997). The SMC-like extinction curves are also observed toward the host galaxies of gamma-ray-bursts (Schady et al. 2012; Heintz et al. 2019), quasars (Hopkins et al., 2004), and high-z star-forming galaxies (Reddy et al., 2018). Our theoretical modeling of extinction induced by RATD implies steep extinction curves with for if grains do not have compact structure with tensile strength of (see Figure 3), which successfully reproduce the SMC-like extinction curves observed toward high-z galaxies using quasars or gamma ray bursts.
5.3 Origins of anomalous dust extinction toward SNe Ia
Extinction curves toward SNe Ia are known to be anomalous, with unusually low value of with the mean value of (Burns et al. 2014; Cikota et al. 2016) and (Cikota et al., 2016). The exact origin of such low is unknown. Goobar (2008) suggested a multiple scattering model by circumstellar dust as a cause of low . Yet, the non-detection of NIR emission from SN 2014J by Spitzer (Johansson et al. 2017) as expected from hot circumstellar dust casts doubt on this scenario. Rotational disruption of grains by RATs proposed by Hoang et al. (2019) could reproduce such low values based on disruption induced by SNe flash (Giang et al. 2020). In this scenario, there must exist a dust cloud within 4 pc from the source. The unique prediction of disruption by SNe flash is the variation of extinction and polarization of SNe light with time.
Our results here show that if grains have a composite structure and are located in the diffuse environment (), is small, for (see Figure 3), which adequately explain the estimated low values of SNe Ia. In particular, some SNe, including SNe 2006X, 2008fp, 2014J, exhibit extreme values of (see Hoang 2017). The adopted radiation intensity for main sequence galaxies cannot produce these extreme values. If the mean intensity of these galaxies is enhanced by starburst for which the grain temperature can reach () (Zavala et al. 2018), corresponding to if Equation (2) is used. For this radiation intensity, can be reproduced by RATD if grains have composite structures (see Figure 3). Note that, due to its interstellar nature, extinction and polarization curves implied by RATD do not vary with the observational time (cf. disruption by SNe light, Giang et al. 2020).
5.4 Space and time variation of and Implications for SNe cosmology
The well-known crisis in cosmology is the tension in measurements of the Hubble constant using SNe Ia and Cosmic Microwave Background (CMB) radiation. SNe Ia measurements report (Riess et al. 2019), whereas CMB measurements by Collaboration et al. (2020) report . Moreover, Freedman et al. (2019) report using on the Tip of the Red Giant Branch.
Dust extinction is critical to the precise measurements of H0 using SNe Ia standardized candles. Brout & Scolnic (2020) suggested that the scatter in could be completely reproduced by allowing the variation of . Recent analysis in González-Gaitán et al. (2020) also confirms the importance host galaxies dust. Since most of SNe Ia are expected to explode in the low density diffuse medium, it is unclear what causes the variation of .
Our modeling results in Figure 3 show that, due to rotational disruption by RATs, varies with the physical parameters of the local environment, including the gas density and the radiation field. It also changes with the grain structures. It is known that the ISM is turbulent (Armstrong et al. 1995), producing fluctuations in the gas density. Moreover, the local intensity depends on the distribution of stars. Therefore, the value of experiences strong fluctuations along the different lines of sight in the host galaxy. Such fluctuations in inevitably induce the scatter in the inferred measurements of the Hubble constant.
5.5 Implications for high-z astrophysics
ALMA is revolutionizing our research on dust and gas in early universe up to redshift (see Bouwens et al. 2020). The relationship between the infrared (IRX) and UV slope (), namely IRX-, of the spectral energy density (SED) is a key parameter to estimate the star-formation rate (SFR) in galaxies (e.g., Bouwens et al. 2016). Therefore, an accurate extinction curve is critically important for reliable estimates of SFR. In light of our study, the extinction curves at high-z are steeper than the standard Milky Way, and the steepness increases with redshift. Therefore, it poses a challenge to an accurate determination of star-formation activity in early universe.
6 Summary
We study the variation of dust properties with redshift resulting from rotational disruption by RATs (RATD mechanism) induced by interstellar radiation field (ISRF). The main results are summarized as follows:
-
•
The efficiency of RATD increases with redshift due to the increase in the mean radiation intensity. The maximum size of the grain size distribution thus decreases with increasing redshift but increases with the gas density. For , the disruption size of dust in the diffuse medium becomes independent of the density.
-
•
Rotational disruption converts large grains into smaller, thus, grains become smaller at higher redshifts. Resulting extinction curves become steeper, and the ratio of total-to-selective extinction, , decreases rapidly with redshift.
-
•
If grains have composite structures of tensile strength , is small, between , much smaller than the standard value of in the Galaxy. This can reproduce the popular SMC-like extinction curves observed toward high-z galaxies.
-
•
Unusually low values of observed toward SNe Ia of could be reproduced by RATD induced by ISRF if grains have composite structures, but the extreme values of observed for several SNe Ia require an enhanced radiation field. Alternatively, it can be reproduced by RATD if there exist some nearby clouds within several parsecs could.
-
•
The fluctuations of due to variation of the local gas density by interstellar turbulence, radiation intensity, and redshift inevitably affect the accurate measurements of the Hubble constant . This might help to resolve the tension between local SNe measurements and early measurements using CMB.
-
•
The variation of dust properties also affects the star-formation rate measured toward high-z galaxies. Thus, one should account for the variation of extinction curves with to achieve accurate measurements.
References
- Armstrong et al. (1995) Armstrong, J. W., Rickett, B. J., & Spangler, S. R. 1995, ApJ, 443, 209
- Bethell et al. (2007) Bethell, T. J., Chepurnov, A., Lazarian, A., & Kim, J. 2007, ApJ, 663, 1055
- Bethermin et al. (2015) Bethermin, M., Daddi, E., Magdis, G., et al. 2015, A&A, 573, A113
- Bouwens et al. (2020) Bouwens, R., González-López, J., Aravena, M., et al. 2020, arXiv:2009.10727, 2009.10727v1
- Bouwens et al. (2016) Bouwens, R. J., Aravena, M., Decarli, R., et al. 2016, ApJ, 833, 72
- Brout & Scolnic (2020) Brout, D., & Scolnic, D. 2020, arXiv:2004.10206, 2004.10206v1
- Burns et al. (2014) Burns, C. R., Stritzinger, M., Phillips, M. M., et al. 2014, ApJ, 789, 32
- Calzetti (2001) Calzetti, D. 2001, PASP, 113, 1449
- Cikota et al. (2016) Cikota, A., Deustua, S., & Marleau, F. 2016, ApJ, 819, 152
- Collaboration et al. (2020) Collaboration, P., Aghanim, N., Akrami, Y., et al. 2020, A&A, 641, A6
- Cowley et al. (2017) Cowley, W. I., Bethermin, M., Lagos, C. d. P., et al. 2017, MNRAS, 467, 1231
- del P Lagos et al. (2012) del P Lagos, C., Bayet, E., Baugh, C. M., et al. 2012, MNRAS, 426, 2142
- Dolginov & Mitrofanov (1976) Dolginov, A. Z., & Mitrofanov, I. G. 1976, Ap&SS, 43, 291
- Draine (2003) Draine, B. T. 2003, ARA&A, 41, 241
- Draine & Hensley (2020) Draine, B. T., & Hensley, B. S. 2020, arXiv:2009.11314, 2009.11314v1
- Draine & Lazarian (1998) Draine, B. T., & Lazarian, A. 1998, ApJ, 508, 157
- Draine & Lee (1984) Draine, B. T., & Lee, H. M. 1984, ApJ, 285, 89
- Draine & Weingartner (1996) Draine, B. T., & Weingartner, J. C. 1996, ApJ, 470, 551
- Draine & Weingartner (1997) —. 1997, ApJ, 480, 633
- Draine et al. (2007) Draine, B. T., Dale, D. A., Bendo, G., et al. 2007, ApJ, 663, 866
- Faisst et al. (2017) Faisst, A. L., Capak, P. L., Yan, L., et al. 2017, ApJ, 847, 21
- Ferrara et al. (2017) Ferrara, A., Hirashita, H., Ouchi, M., & Fujimoto, S. 2017, MNRAS, 471, 5018
- Freedman et al. (2019) Freedman, W. L., Madore, B. F., Hatt, D., et al. 2019, ApJ, 882, 0
- Giang et al. (2020) Giang, N. C., Hoang, T., & Tram, L. N. 2020, ApJ, 888, 93
- González-Gaitán et al. (2020) González-Gaitán, S., de Jaeger, T., Galbany, L., et al. 2020, arXiv.org, 2009.13230v1
- Goobar (2008) Goobar, A. 2008, ApJ, 686, L103
- Gordon et al. (1997) Gordon, K. D., Calzetti, D., & Witt, A. N. 1997, ApJ, 487, 625
- Heintz et al. (2019) Heintz, K. E., Zafar, T., De Cia, A., et al. 2019, MNRAS, 486, 2063
- Herranen et al. (2019) Herranen, J., Lazarian, A., & Hoang, T. 2019, ApJ, 878, 96
- Hirashita et al. (2017) Hirashita, H., Burgarella, D., & Bouwens, R. J. 2017, MNRAS, 472, 4587
- Hirashita & Hoang (2020) Hirashita, H., & Hoang, T. 2020, MNRAS, 494, 1058
- Hirashita & Li (2013) Hirashita, H., & Li, Z.-Y. 2013, MNRAS, 434, L70
- Hoang (2017) Hoang, T. 2017, ApJ, 836, 13
- Hoang (2019) —. 2019, ApJ, 876, 13
- Hoang (2020) —. 2020, Galaxies, 8, 52
- Hoang et al. (2010) Hoang, T., Draine, B. T., & Lazarian, A. 2010, ApJ, 715, 1462
- Hoang & Lazarian (2008) Hoang, T., & Lazarian, A. 2008, MNRAS, 388, 117
- Hoang & Lazarian (2009) —. 2009, ApJ, 695, 1457
- Hoang & Lazarian (2014) —. 2014, MNRAS, 438, 680
- Hoang et al. (2011) Hoang, T., Lazarian, A., & Draine, B. T. 2011, ApJ, 741, 87
- Hoang et al. (2013) Hoang, T., Lazarian, A., & Martin, P. G. 2013, ApJ, 779, 152
- Hoang & Tram (2020) Hoang, T., & Tram, L. N. 2020, ApJ, 891, 38
- Hoang et al. (2019) Hoang, T., Tram, L. N., Lee, H., & Ahn, S.-H. 2019, Nature Astronomy, 3, 766
- Hoang et al. (2020) Hoang, T., Tram, L. N., Lee, H., Diep, P. N., & Ngoc, N. B. 2020, arXiv:2010.07742, 2010.07742v1
- Hopkins et al. (2004) Hopkins, P. F., Strauss, M. A., Hall, P. B., et al. 2004, AJ, 128, 1112
- Hwang et al. (2010) Hwang, H. S., Elbaz, D., Magdis, G., et al. 2010, MNRAS, 409, 75
- Imara et al. (2018) Imara, N., Loeb, A., Johnson, B. D., Conroy, C., & Behroozi, P. 2018, ApJ, 854, 36
- Johansson et al. (2017) Johansson, J., Goobar, A., Kasliwal, M. M., et al. 2017, MNRAS, 466, 3442
- Jones et al. (1994) Jones, A. P., Tielens, A. G. G. M., Hollenbach, D. J., & McKee, C. F. 1994, ApJ, 433, 797
- Kimura et al. (2020) Kimura, H., Wada, K., Yoshida, F., et al. 2020, MNRAS, 496, 1667
- Lazarian & Hoang (2007) Lazarian, A., & Hoang, T. 2007, MNRAS, 378, 910
- Lazarian & Hoang (2020) —. 2020, arXiv:2010.15301, submitted to ApJ
- Lim et al. (2020) Lim, C.-F., Wang, W.-H., Smail, I., et al. 2020, ApJ, 889, 80
- Magdis et al. (2012) Magdis, G. E., Daddi, E., Bethermin, M., et al. 2012, ApJ, 760, 6
- Magdis et al. (2017) Magdis, G. E., Rigopoulou, D., Daddi, E., et al. 2017, A&A, 603, A93
- Mathis (1990) Mathis, J. S. 1990, ARA&A, 28, 37
- Mathis et al. (1983) Mathis, J. S., Mezger, P. G., & Panagia, N. 1983, A&A, 128, 212
- Mathis et al. (1977) Mathis, J. S., Rumpl, W., & Nordsieck, K. H. 1977, ApJ, 217, 425
- Narayanan et al. (2018) Narayanan, D., Dave, R., Johnson, B. D., et al. 2018, MNRAS, 474, 1718
- Nozawa et al. (2003) Nozawa, T., Kozasa, T., Umeda, H., Maeda, K., & Nomoto, K. 2003, ApJ, 598, 785
- Ouchi et al. (1999) Ouchi, M., Yamada, T., Kawai, H., & Ohta, K. 1999, ApJ, 517, L19
- Reddy et al. (2018) Reddy, N. A., Oesch, P. A., Bouwens, R. J., et al. 2018, ApJ, 853, 56
- Riess et al. (2019) Riess, A. G., Casertano, S., Yuan, W., Macri, L. M., & Scolnic, D. 2019, ApJ, 876, 85
- Salim & Narayanan (2020) Salim, S., & Narayanan, D. 2020, arXiv:2001.03181, arXiv:2001.03181
- Schady et al. (2012) Schady, P., Dwelly, T., Page, M. J., et al. 2012, A&A, 537, 15
- Schreiber et al. (2018) Schreiber, C., Elbaz, D., Pannella, M., et al. 2018, A&A, 609, A30
- Silsbee & Draine (2016) Silsbee, K., & Draine, B. T. 2016, ApJ, 818, 133
- Sommovigo et al. (2020) Sommovigo, L., Ferrara, A., Pallottini, A., et al. 2020, arXiv:2004.09528, 2004.09528v3
- Tatsuuma et al. (2019) Tatsuuma, M., Kataoka, A., & Tanaka, H. 2019, ApJ, 874, 159
- Zavala et al. (2018) Zavala, J. A., Aretxaga, I., Dunlop, J. S., et al. 2018, MNRAS, 475, 5585
- Zhukovska et al. (2016) Zhukovska, S., Dobbs, C., Jenkins, E. B., & Klessen, R. S. 2016, ApJ, 831, 147