Entanglement swapping between independent and asynchronous integrated photon-pair sources
Abstract
Integrated photonics represents a technology that could greatly improve quantum communication networks in terms of cost, size, scaling, and robustness. A key benchmark for this is to demonstrate their performance in complex quantum networking protocols, such as entanglement swapping between independent photon-pair sources. Here, using time-resolved detection, and two independent and integrated Si3N4 microring resonator photon-pair sources, operating in the CW regime at telecom wavelengths, we obtained spectral purities up to and a HOM interference visibility between the two sources of . This results in entanglement swapping visibility as high as .
I Introduction
Entanglement swapping Żukowski (1993), where two independent particles can be entangled without ever directly interacting, is a fascinating phenomenon, offering a rich insight into the foundations of quantum physics Peres (2000); Branciard et al. (2010). Additionally, the protocol is of paramount importance for quantum communication networks, such as quantum repeaters Briegel et al. (1998); Duan et al. (2001); Sangouard et al. (2011), enabling efficient long-distance entanglement distribution. Following the seminal work on entanglement swapping Boschi et al. (1998); Pan et al. (1998), the protocol has been implemented in a wide array of systems, exploiting entanglement encoded in various degrees of freedom de Riedmatten et al. (2005); Pan et al. (2012); Bernien et al. (2013); Rosenfeld et al. (2017). However, these have typically been large, bulky experiments that are not suited to real-world deployment.
Photonic integrated circuits (PIC) provide a promising solution, in terms of size, scalability, and robustness Wang et al. (2019). However, while the performance of integrated photon-pair sources in the telecom regime has advanced in recent years, the demonstration of entanglement swapping between completely independent sources has remained outstanding. Of particular interest for quantum communication, photon-pair sources based on spontaneous four-wave mixing (SFWM) in microring resonators (MRR) Grassani et al. (2015); Hemsley et al. (2016); Ma et al. (2017); Samara et al. (2019); Oser et al. (2020) are emerging as a viable technology Pasquazi et al. (2018); Kues et al. (2019), not only due to their compact size but also their compatibility with standard telecom systems and devices - both the photons and the pump laser are in the telecom regime. In the case of multi-photon experiments, teleportation and entanglement swapping was recently demonstrated using two MRR photon-pair sources Llewellyn et al. (2019). However, this was realized with both sources integrated on the same chip and pumped with the same laser, thus not addressing many of the challenges associated with real-world quantum communication.
A key challenge for distributing entanglement in such scenarios is the synchronization of the sources or the network in general Aboussouan et al. (2010). Most of the previous demonstrations of entanglement swapping relied on pulsed photon-pair sources, where pump synchronization is indispensable Kaltenbaek et al. (2006); Yang et al. (2006); Kaltenbaek et al. (2009); Sun et al. (2017a, b). Alternatively, the combination of continuous-wave (CW) photon-pair sources, and time-resolved detection allows for asynchronous entanglement swapping to be realized Żukowski (1993); Halder et al. (2007). Time-resolved detection refers to the uncertainty in detection time being smaller than the photons’ coherence time. While simplifying the synchronization of sources for entanglement distribution in networks, this approach also overcomes problems due to path length changes and chromatic dispersion in pulsed systems Sun et al. (2017a), facilitating high-quality entanglement distribution over long distances.
Central to the entanglement swapping protocol is an interference measurement between one photon from each of the two photon-pair sources, requiring not only a high degree of indistinguishability but also spectral purity Osorio et al. (2013). Here, we exploit two independent MRR photon-pair sources, developed on silicon nitride () platform, in combination with state-of-the-art, low jitter detectors, to demonstrate high-quality HOM and CW entanglement swapping. The based photonic integrated platform has gained a lot of interest in many linear and nonlinear fields due to its ultra-low propagation loss (1 dB/m) Liu et al. (2020), wide transparency range, high power handling capability Gyger et al. (2020), CMOS and space compatibility Brasch et al. (2014). In particular, based soliton microcombs and supercontinuum generation have been already implemented in many system-level applications Kippenberg et al. (2018) and can facilitate integrated quantum optics devices.
II The concept
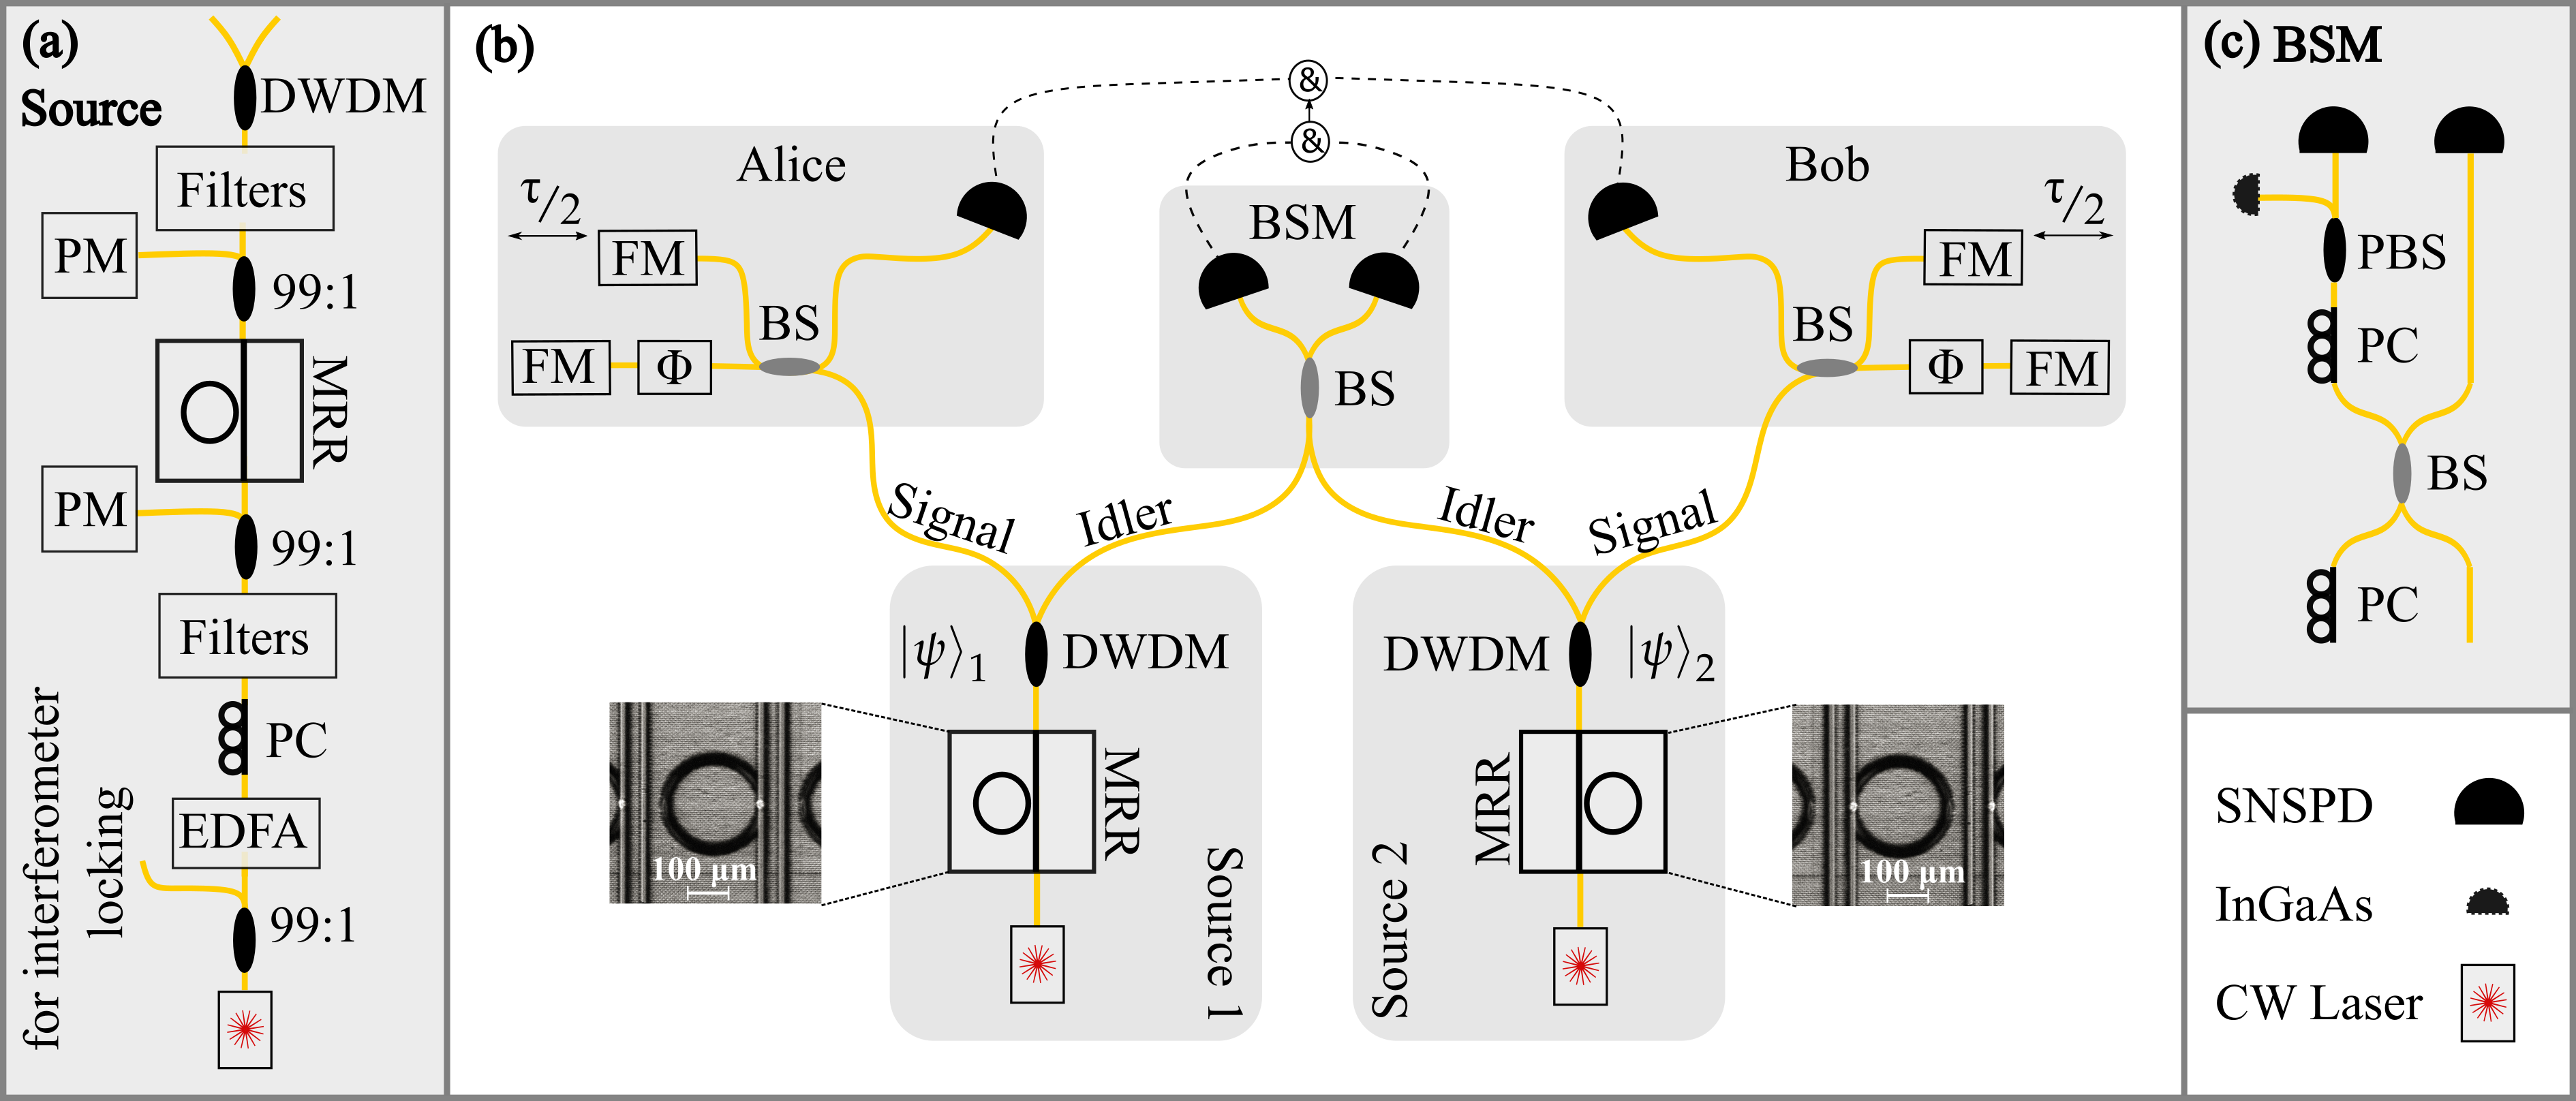
A schematic of our entanglement swapping implementation is shown in Fig. 1. Two autonomous sources, labeled 1 and 2, independently generate energy-time entangled photon-pairs. The individual photon-pair states belonging to one of the two sources can be written as , where the subscripts and refer to the signal and idler respectively. The combined state of both photon-pairs generated by both sources is given by:
| (1) |
where is the relative delay between the emission times of the two photon sources, and is the pump coherence time. The Bell states in equation (1) are defined as:
| (2) |
Only one is post-selected in our experiment, facilitating the entanglement swapping analysis with fixed delay interferometers. To guarantee the quantum interference between and and to avoid single-photon interference, must satisfy the energy-time entanglement condition , where is the coherence time of the photons.
After the beam splitter (BS), the two idler photons are projected in one of the four Bell states (equation (2)). The two Bell states () correspond to both photons in the same (different) time mode (modes). The photons in the states will exit the BS in the same output. In our realization, only the two Bell states can be detected unambiguously. Nevertheless, the detection of the state is technically challenging, as it requires single-photon detectors with a recovery time shorter than . Indeed, after the beam splitter, the (anti-)symmetric state () corresponds to both photons exiting in (different) the same spatial (modes) mode. In light of such technical difficulties, and considering the recovery time of our detectors (ns), we consider only the state . As we see in equation (1), the detection of the state collapses the other two photons in the state . In other words, time-bin entanglement is post-selected from energy-time entanglement without the need for pulsed pumps or their synchronization, greatly facilitating distributed scenarios.
III Experimental implementation
The photon-pair sources use SFWM in microring resonators. The microring resonators are fabricated using the photonic Damascene process Pfeiffer et al. (2016), enabling devices with low propagation loss (dB/m) waveguides while maintaining anomalous dispersion
Each source, Fig. 1(a), is pumped on resonance by a CW laser (Toptica DL100) amplified by an erbium-doped fiber amplifier (EDFA) in the telecom band. The pump wavelength for source 1 (2) is nm (nm), while the pump power is set to mW (mW). The chosen pump power values for both sources correspond to a pair generation probability per coherence time () of 0.006. A tunable bandpass filter and two DWDM filters, reject the amplified spontaneous emission (ASE), giving rise to of pump isolation before the chip. The polarization of the pump light is aligned (using a polarization controller PC) to the quasi-transverse electric (TE)mode, achieving the best input-to-output transmission in the micro-ring resonator (MRR) chip. Lensed fibers are used to couple the light in and out of the waveguide. To reject the residual pump at the chip output and separate the signal and idler into different spatial modes, a second filtering block is implemented after the PIC.
This filtering block consists exclusively of low-loss commercial DWDMs (2 in notch configuration + 2 in passband configuration), which reject the residual pump and direct the signal and idler photons to the appropriate channels. This results in dB of pump rejection and dB signal-idler isolation. The DWDM’s passband of GHz is 400 times larger than the photons’ spectra (see Appendix), thus, apart from the insertion losses, no further reduction in the photons flux occurs due to spectral filtering. The average heralding efficiency for the four paths is (see Table S2 in Appendix for a complete breakdown of the various contributions). Here the heralding efficiency is defined as the probability of having a photon in the output mode once its herald has been detected.
A control loop is used to minimize the pump wavelength and MRR resonance detuning by adjusting the temperature of the chip, ensuring stable operation for more than 24 hours. The temperature control system is also necessary for aligning the photons’ wavelengths within the specific DWDM passband, and to optimize the spectral overlap between the two independent idler photons (nm) arriving at the Bell-state measurement (BSM) node. A complete characterization of the photon-pair sources is given in Appendix.
Once the signal and idler photons are separated, the idler photons are sent to the BSM node consisting of a 50:50 beam splitter (BS), while the signal photons are sent to Alice and Bob (Fig. 1(b)). The photons are detected with homemade superconducting nanowire single-photon detectors (SNSPD), with temporal jitter on the order of ps, efficiencies above and dark count rates below Hz. The arrival time of the photons is registered with a multi-stop time-to-digital converter (IDQ ID900) with bin width and time jitter of ps and ps respectively. The detection of photons at the BSM detectors, with a relative time difference ns and coincidence window ps, heralds the presence of the signal photons at Alice and Bob. The coincidence window was chosen to satisfy the time-resolved detection condition , where ps is the average coherence time of both idler photons.
To analyze the entanglement swapping, we use two imbalanced () Franson-type interferometers placed on Alice’s and Bob’s sides (Fig. 1(b)) that are thermally stabilized and phase-locked (See Appendix). A detection at the BSM at time and projects the original energy-time entanglement of the two sources onto a time-bin entangled state shared by Alice and Bob. For this experiment, Alice’s and Bob’s interferometers are locked with the pump lasers of sources 1 and 2, respectively. Additionally, the frequency difference between the two pump lasers is stabilized by using one of the interferometers as a frequency reference. This ensures that there is no phase drift between Alice’s and Bob’s interferometers. In a quantum repeater like scenario, the sources could be locked to a relevant phase reference, such as an atomic transition, cavity, or optical frequency comb.
IV Results
Spectral purity and indistinguishability of the photons are essential requirements for a successful BSM. Spectral purity can be related to the factorability of the signal-idler joint spectral amplitude or an auto-correlation measurement Osorio et al. (2013). Due to the narrow bandwidth of the sources, we use auto-correlation measurements to characterize the spectral purity (see Appendix). The obtained spectral purity for source 1 and 2 are and respectively, where the ideal value is 1, i.e. for a single-mode thermal source.
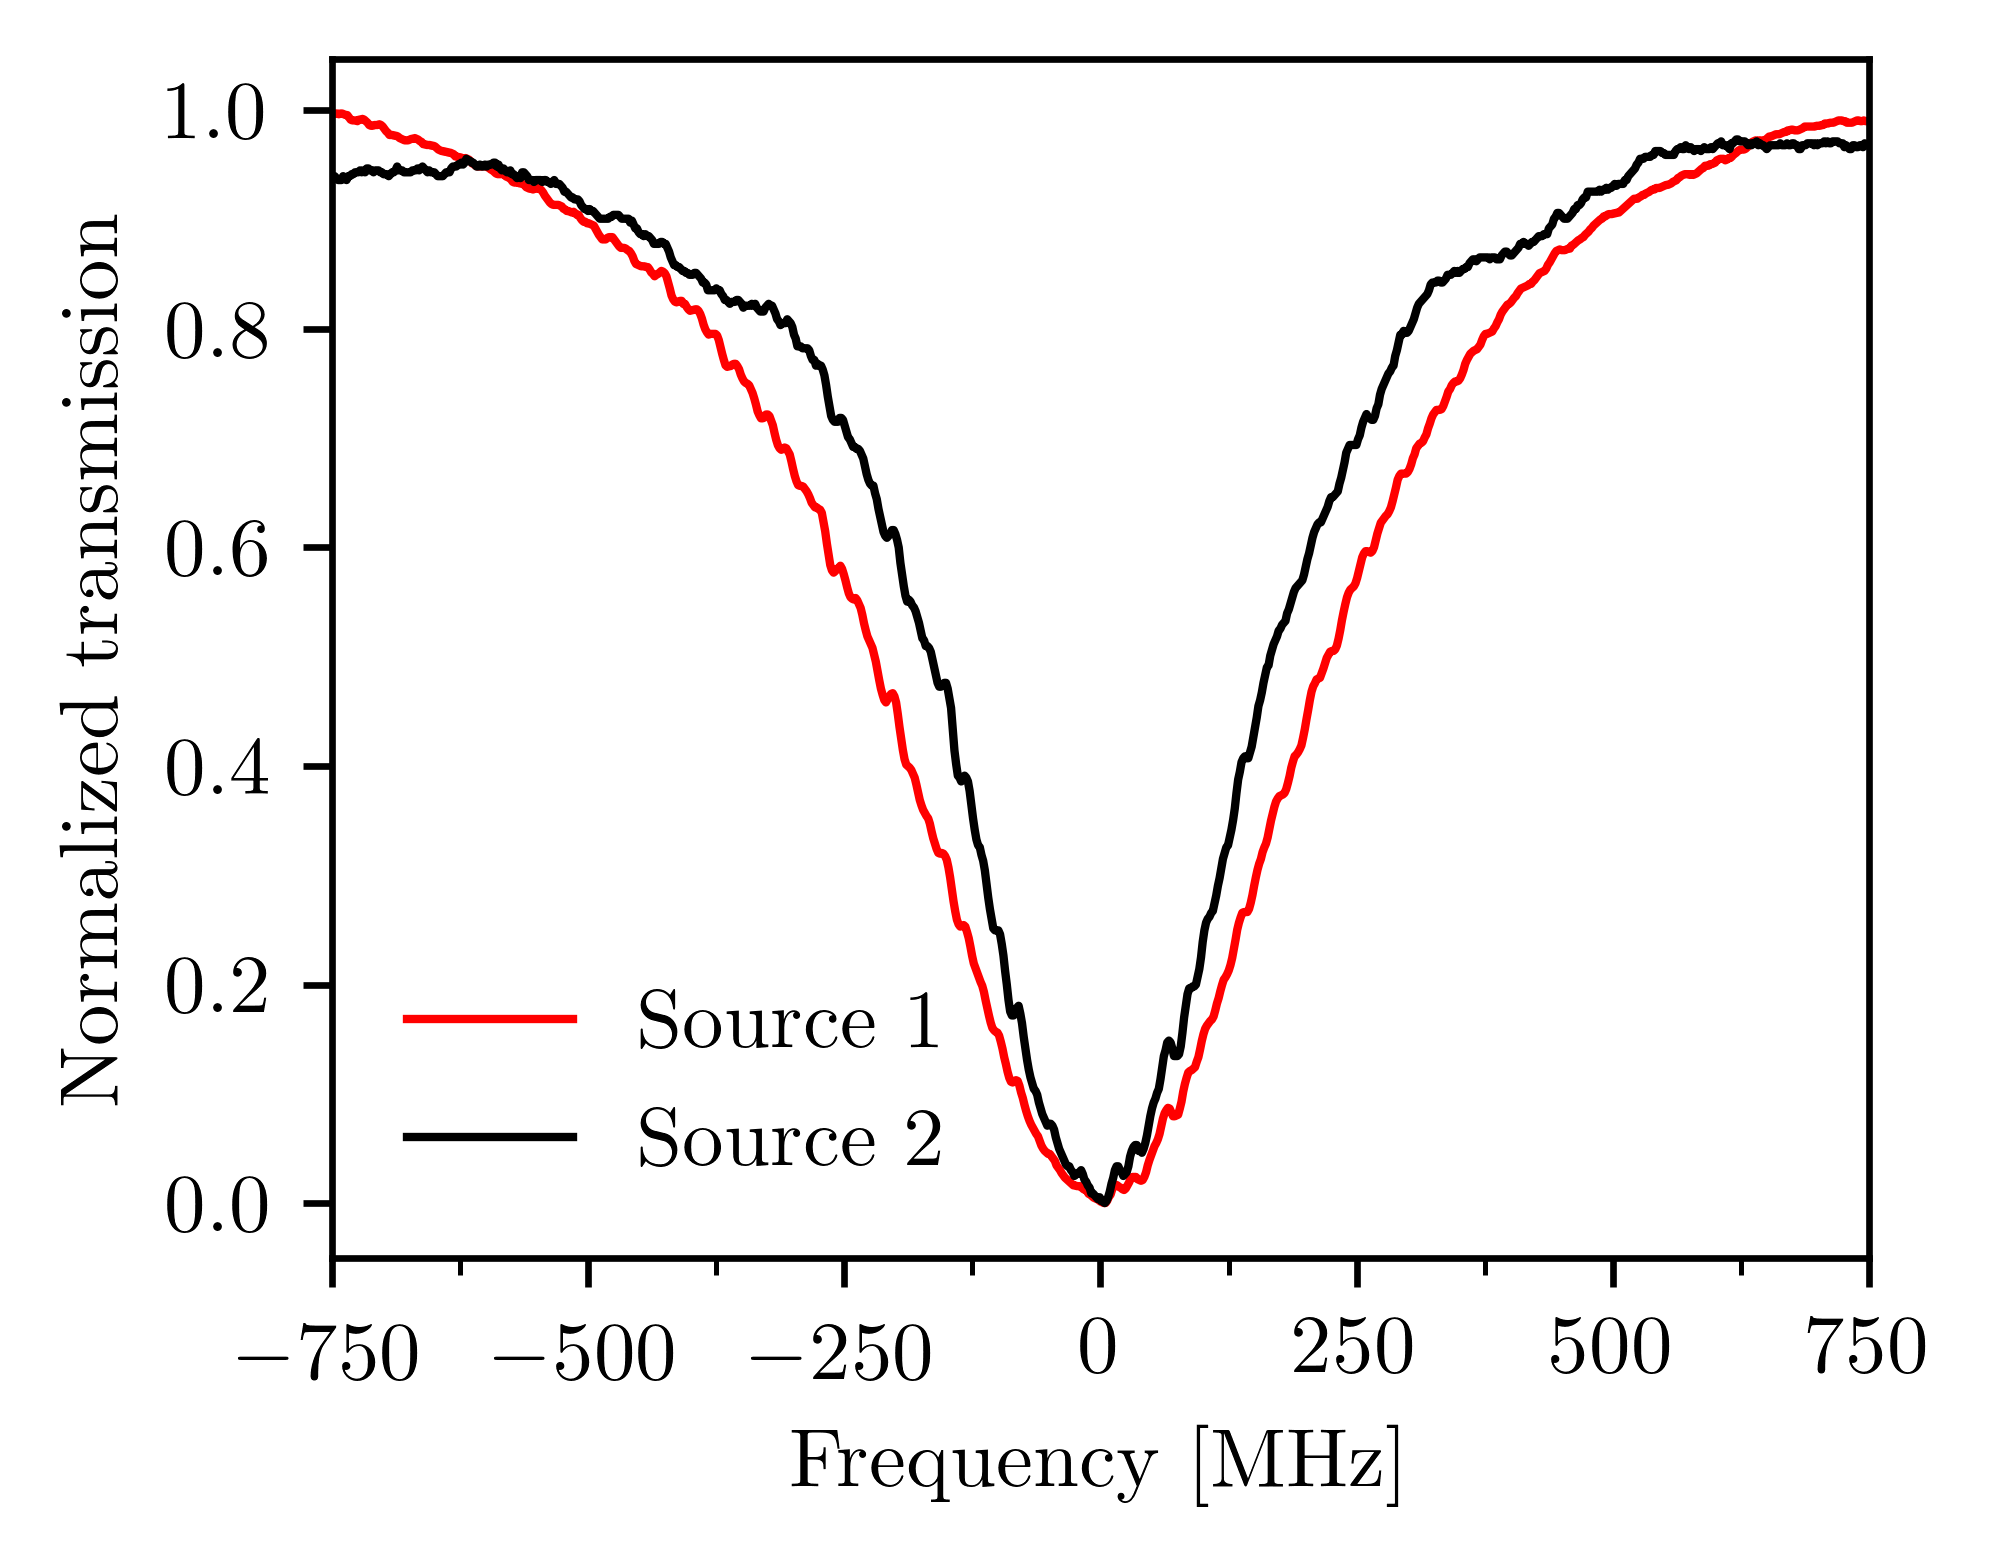
Photon indistinguishability, for all degrees of freedom, is the other essential requirement for a successful BSM Hong et al. (1987). Spatial indistinguishability is achieved by using single-mode fibers, while polarization indistinguishability is realized by minimizing the photon flux at the polarizing beam splitter’s (PBS) auxiliary output as shown in Fig. 1(c). For the spectral indistinguishably, we chose two MRR devices with comparable Q-factors, thus giving rise to similar photon spectra, with linewidths at full-width half-maximum (FWHM) of 335 and 476 MHz - The spectral overlap is . Importantly, temporal indistinguishability is ensured by the sub-coherence-time precision, given by a detection resolution of (convolution of the detectors and the multi-stop time-to-digital converter jitters) and a coincidence window of ps.
.
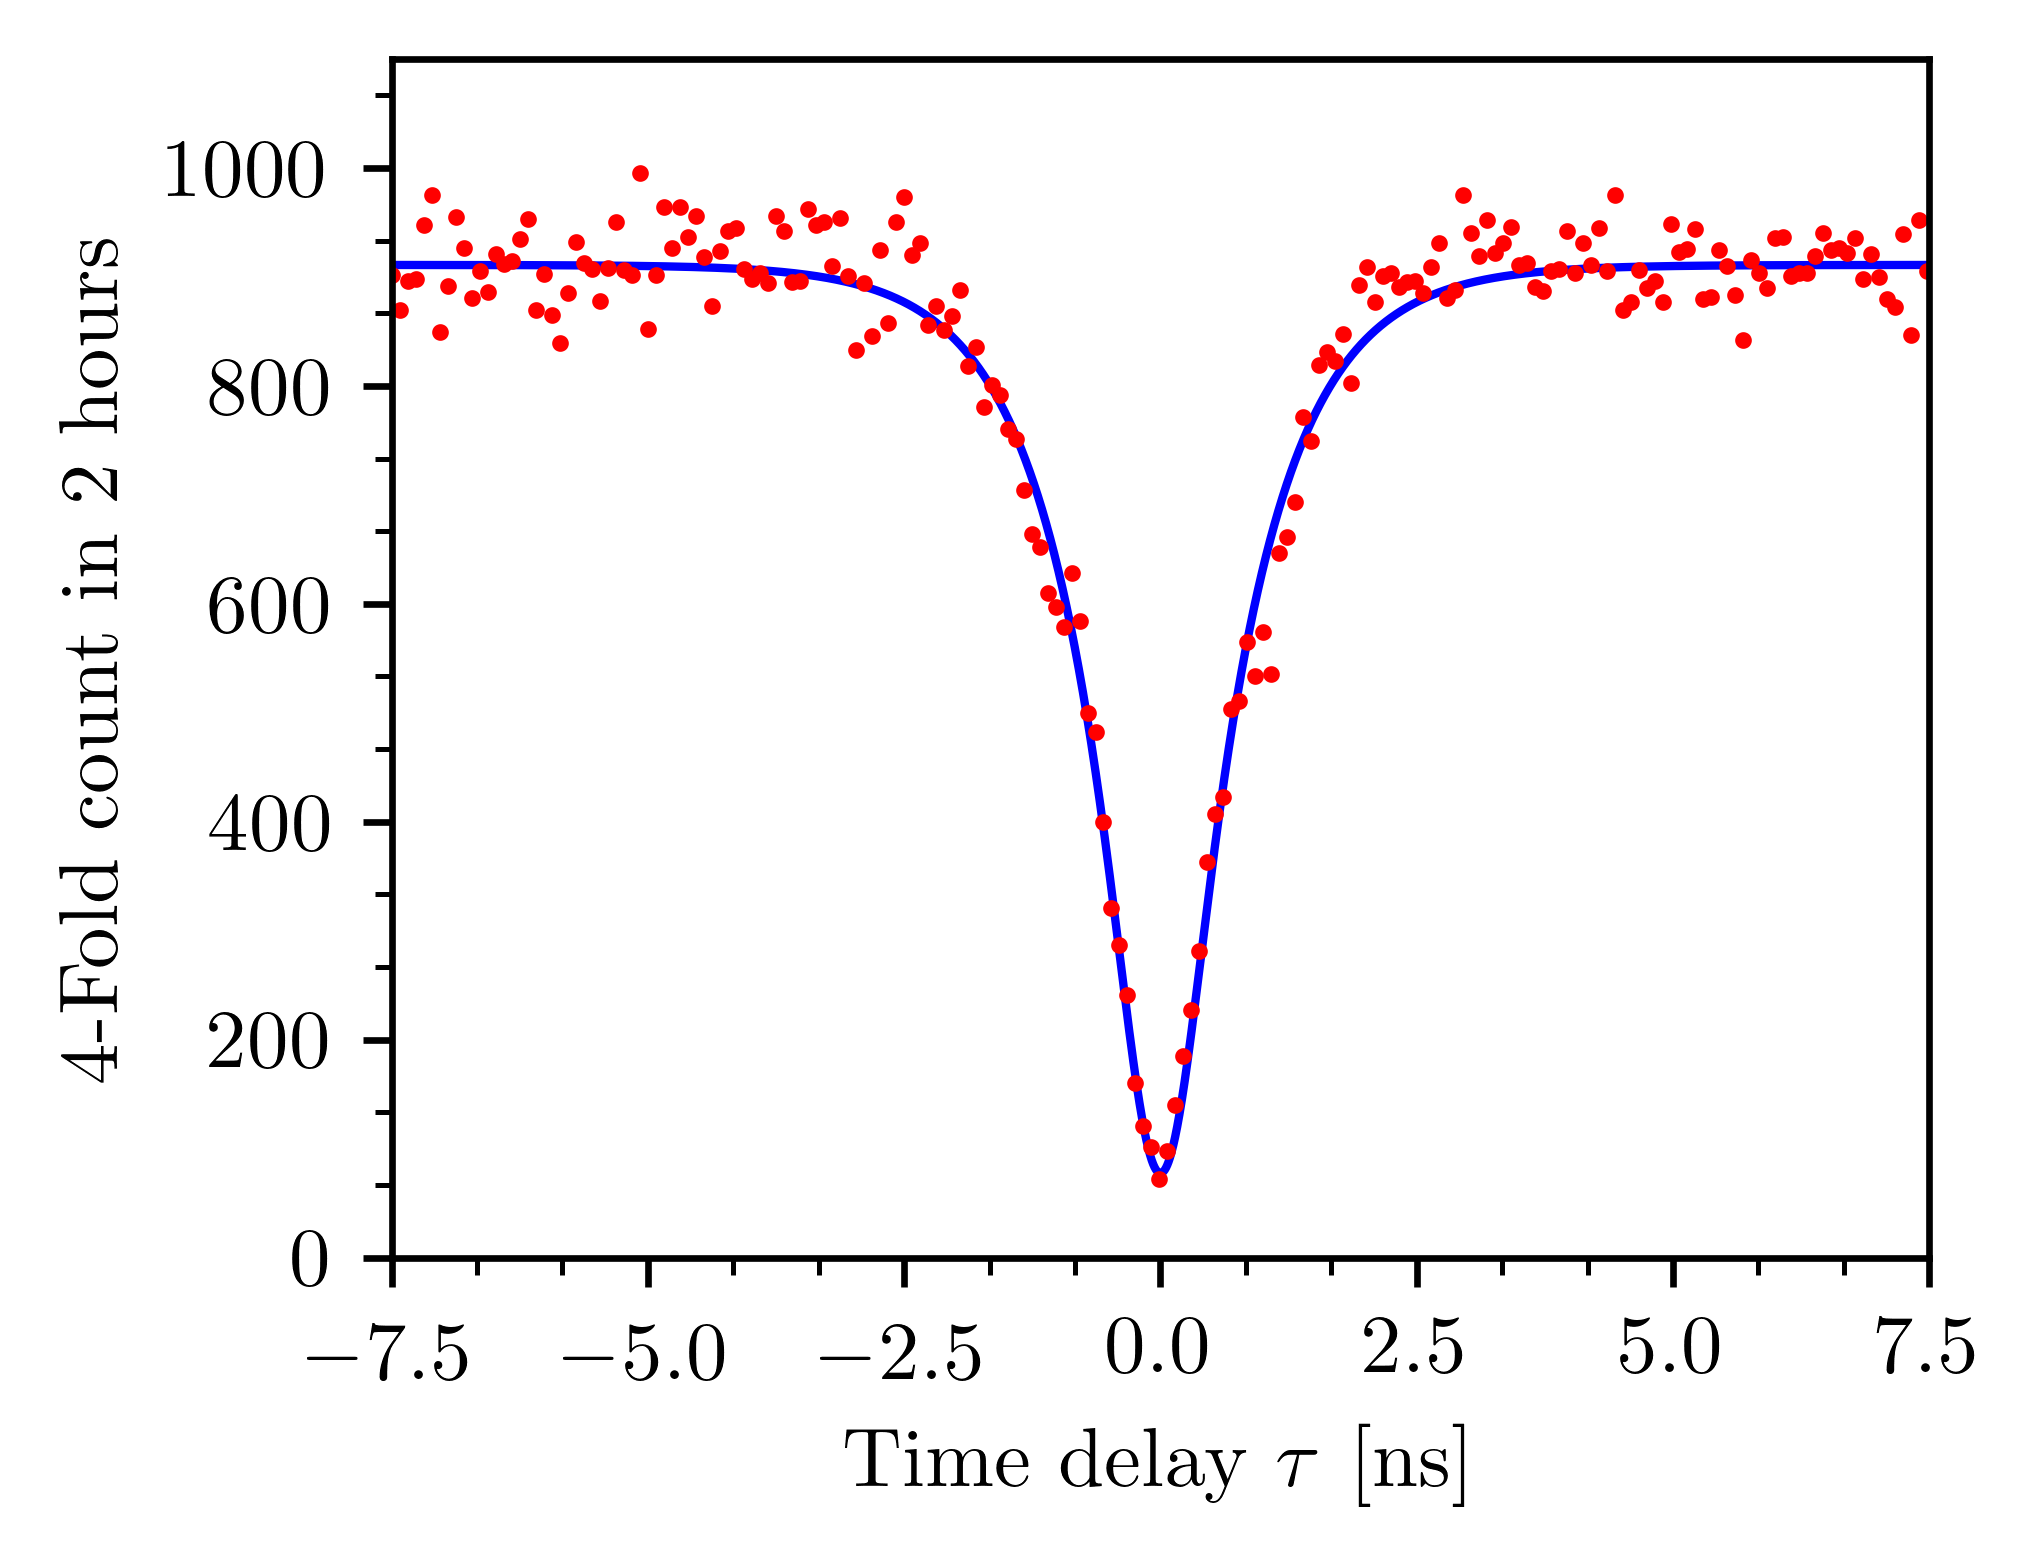
Photon indistinguishability and spectral purity can be verified by performing a heralded Hong–Ou–Mandel (HOM) measurement Hong et al. (1987), where the visibility also provides an operational characterization for the BSM. To perform this measurement, we use the setup illustrated in Fig. 1(b) without the interferometers. The four-fold coincidence histogram as a function of the relative delay between the two photons at the BSM node is shown in Fig. 2. The data is fitted with a function obtained by the convolution between two double exponential functions describing the temporal shape of the two photons, and the detectors’ Gaussian temporal response function. The HOM dip visibility is .
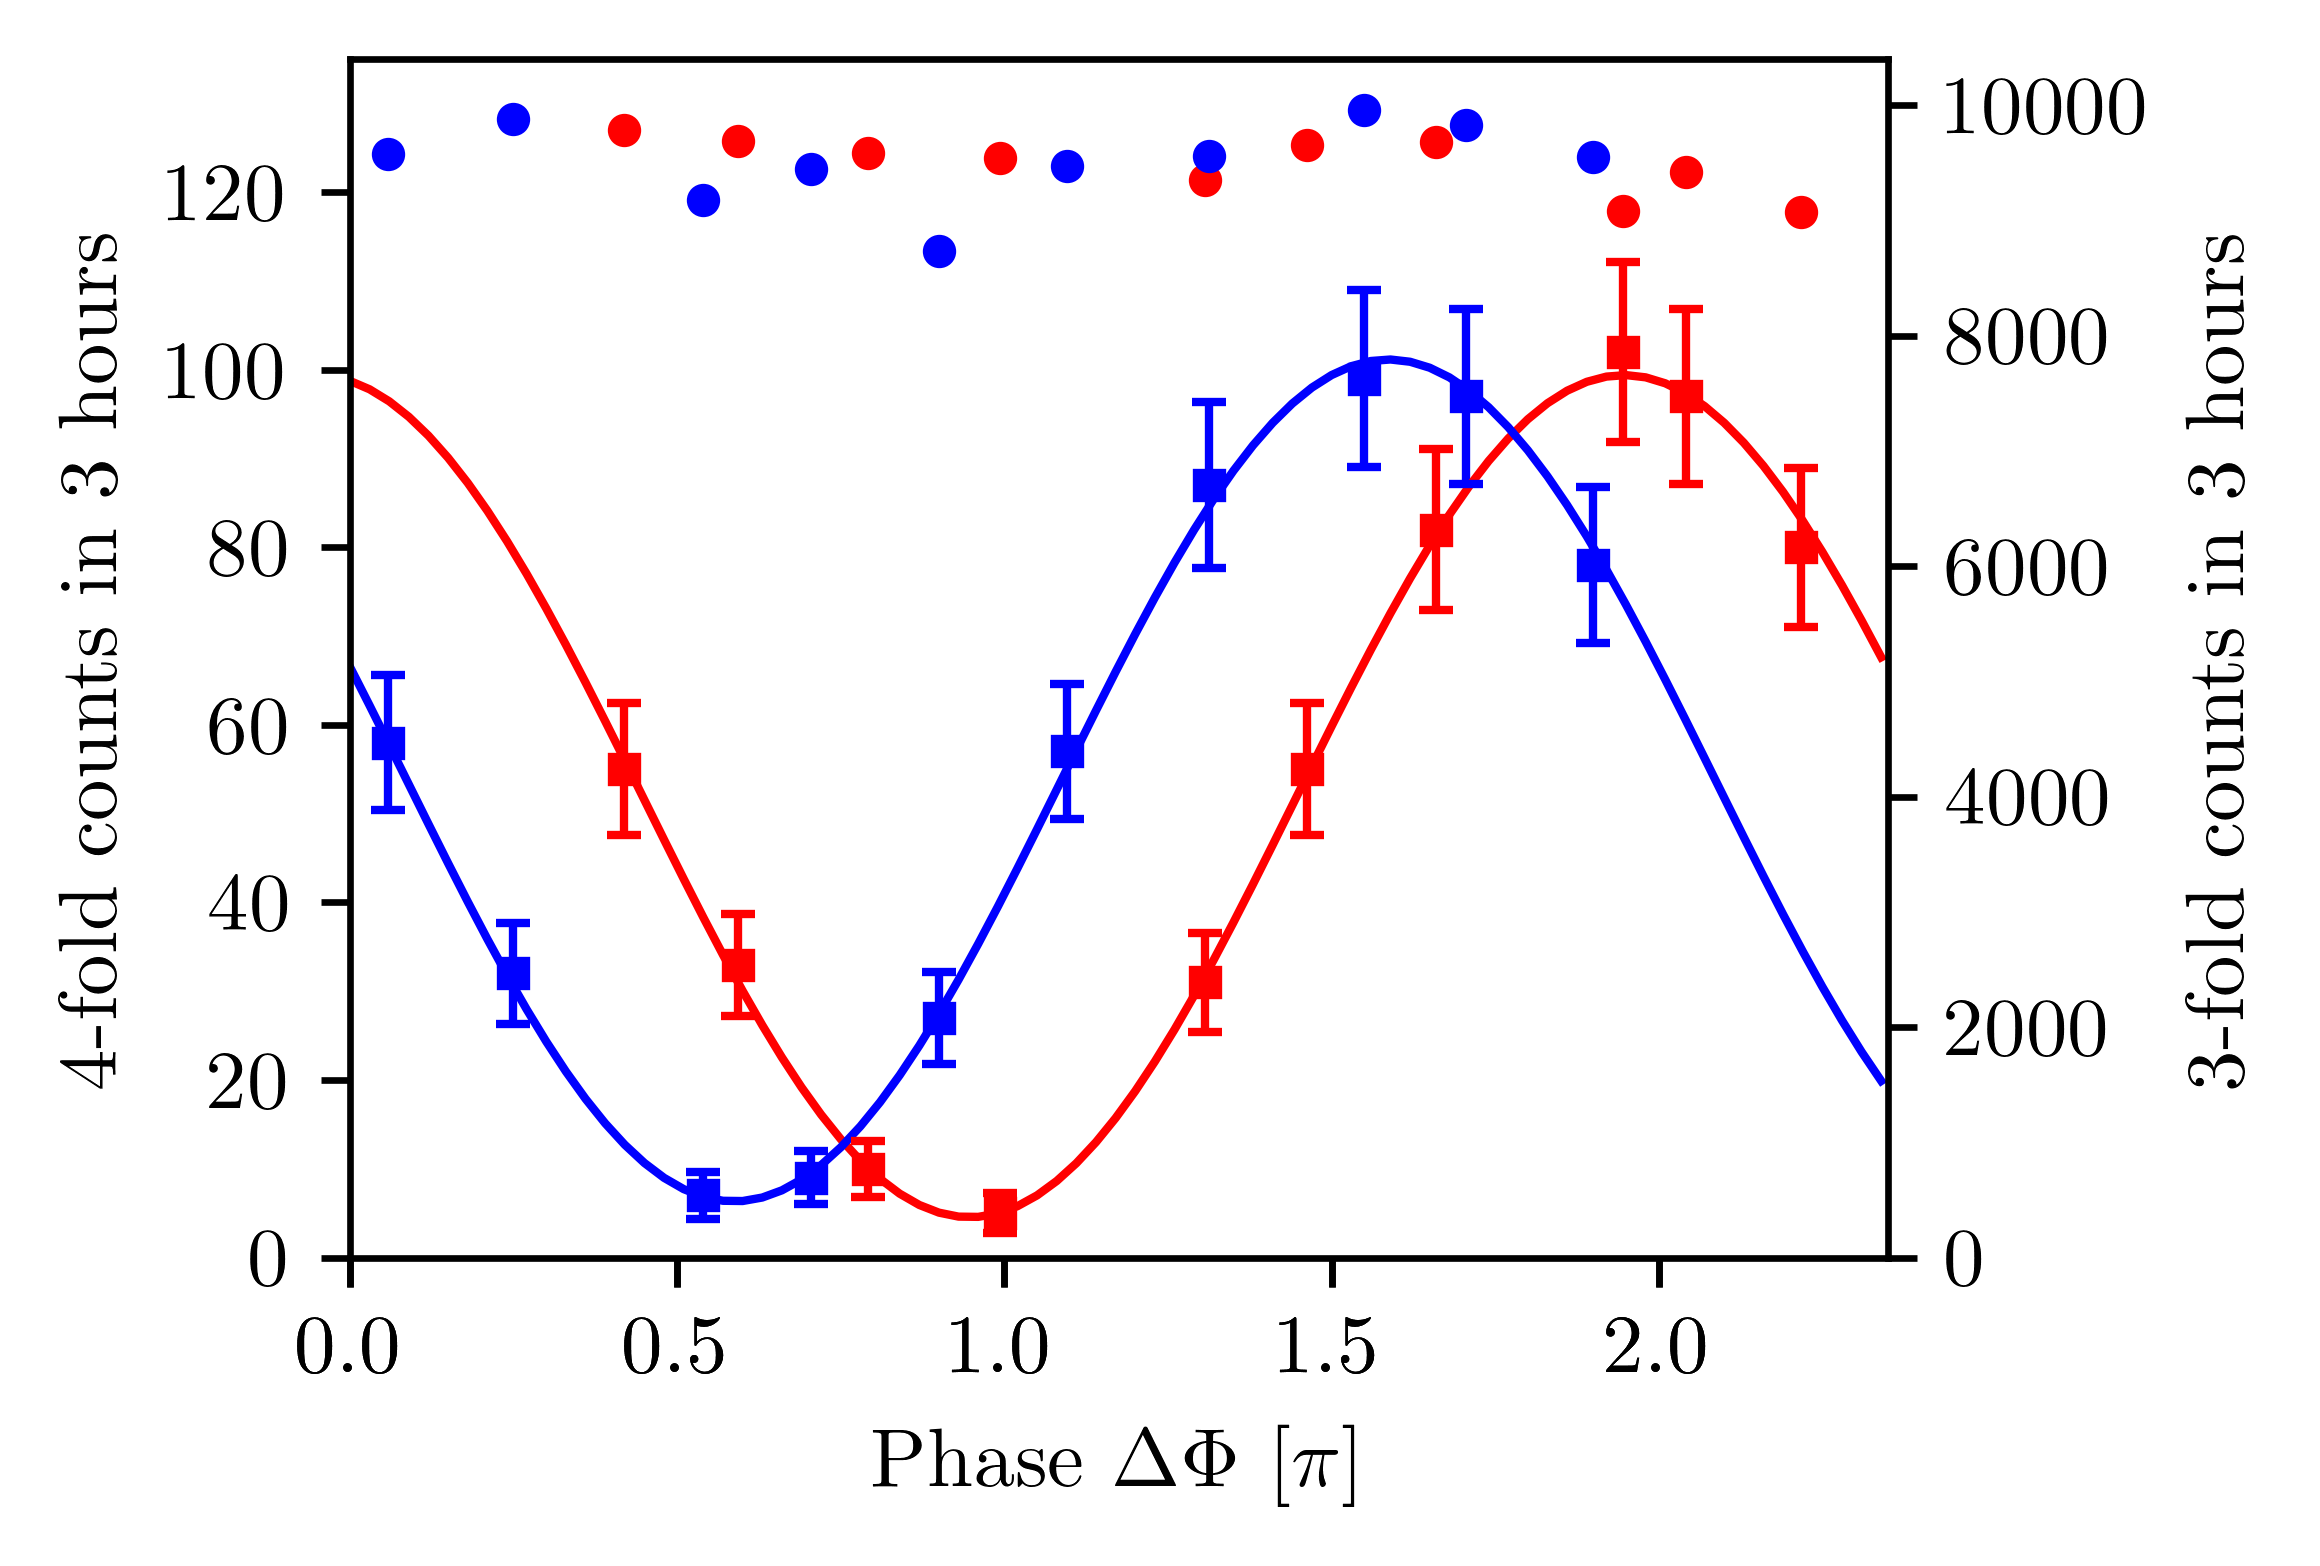
To analyze the quality of the entanglement swapping we use the complete setup shown in Fig. 1. Bob’s phase is scanned for two different phase settings in Alice’s interferometer. Fig. 3 illustrates the four-fold coincidence counts as a function of this phase difference. The interference visibilities of and clearly indicate a high degree of entanglement. The visibility can also be related to the violation of a CHSH inequality () Marcikic et al. (2004), which for the average visibility of , corresponds to , allowing us to infer a violation by standard deviations.
| Ref. | Source | Process | Pump | On/Off | HOM rate | Swap. rate | |||
|---|---|---|---|---|---|---|---|---|---|
| chip | raw (net) | [ cph] | raw | cph | |||||
| Current | MRR | SFWM | CW nm | Off | 0.006 | () | |||
| Llewellyn et al. (2019) 2019 | Si MRR | SFWM | Pulsed nm | On | 0.065 | () | ? | ||
| Spring et al. (2017) 2017 | Silica WG | SFWM | Pulsed nm | On | 0.015 | () | - | - | |
| Zhang et al. (2016) 2016 | SOI nanowire | SFWM | Pulsed nm | Off | 0.02 | (-) | - | - | |
| Harada et al. (2011) 2011 | Si WG | SFWM | Pulsed nm | Off | 0.025 | (-) | - | - | |
| Aboussouan et al. (2010) 2010 | PPLN WG | SPDC | Pulsed nm | Off | 0.04 | () | - | - | |
| Halder et al. (2007) 2007 | PPLN WG | SPDC | CW nm | Off | 0.02 | (-) | 5 |
The imperfect HOM and entanglement swapping visibilities can be attributed to the following contributions: double pairs (), photonic noise (), and imperfect spectral purity (). For entanglement swapping, one must also consider the non-ideal energy-time entangled states (see Appendix) generated by source 1 () and source 2 (). The expected HOM and entanglement swapping visibilities of and are given by multiplying the aforementioned contributions, and they are in a good agreement with the experimentally observed values of and .
For the above visibilities estimations, the fluctuations and drift ( in 10 hours) of the spectral overlap have a negligible effect as it is less than the spectral uncertainty given by the detection (). The effect of the polarization fluctuations and detector dark counts can also be neglected. The photonic noise is mainly being generated by the chip (see Appendix and Samara et al. (2019)), its effect was estimated by modelling the noise as detector dark counts Sekatski et al. (2012) . The timing jitter of the SNSPD () and multi-stop time-to-digital converter () gives a finite time resolution of , the effect of which is reflected by the imperfect spectral purity.
V Discussion
Firstly, it is important to point out that the maximum achievable HOM visibilities for MRR sources were theorized to be fundamentally limited to , given by the maximum attainable spectral purity of the basic circuit design Helt et al. (2010). However, Huang et al. Huang et al. (2010) have shown that time-resolved, single-mode, detection can achieve high spectral purity even if the photons are initially in a non-factorable state. The single-mode detection condition can be quantitatively stated as , where is the photons bandwidth, and is the temporal resolution of the photon detection scheme. In our case (on average and ). By exploiting time-resolved detection we overcome this limit and achieve spectral purities up to from a standard MRR design.
The rates here are, in general, very good, although there are again fundamental limits associated with the circuit design that could be further improved with more complex approaches Tison et al. (2017). This approach would allow one to optimise the coupling between the resonator and pump independently of the resonator and pairs Vernon et al. (2016). Currently, the efficiency of coupling out of the cavity and into the waveguide is only . The overall heralding efficiency could be further improved with advanced 2D taper designs Liu et al. (2018) to improve the coupling into the fiber.
A significant limiting factor for the current scheme is the generation of noise photons Samara et al. (2019). This forces us to operate at lower pump powers and hence lower photon pair generation probabilities, thus sacrificing the overall four-fold rates. Further research to better understand and develop solutions to resolve this noise issue are essential to exploit the potential of the PIC technology. This would allow further optimization of the trade-off between the four-fold rate and visibility, as a function of the detection coincidence window (see Appendix).
In Table 1 we compare some of the key parameters for a range of integrated photonic systems. Our results significantly improve over the most conceptually similar experiment Halder et al. (2007), which also exploited time-resolved detection, as well as some pulsed experiments in SOI nanowires Zhang et al. (2016) and Si waveguides Harada et al. (2011) for both rates and visibilities. The results for PPLN waveguides Aboussouan et al. (2010), which have provided a benchmark for some time, give comparable performance in both visibilities and rates - if one factors out the low efficiency detectors used in that experiment. An interesting case is for Silica waveguides Spring et al. (2017), which, while not at telecom wavelengths, avoid the problem of excess loss due to filtering of the latter case by engineering pure photons, achieving visibilities on a par with the current work, but with significantly higher rates.
The most straightforward comparison is with the recent results for MRR in Si Llewellyn et al. (2019), where the advantage of time-resolved detection can be clearly seen by the significantly improved visibility. The rates for these two are not so different, although we note that the photon pair probability for this work was an order of magnitude lower. Indeed, we are currently limited by noise generated in the devices, but in principle, we could increase our rates a hundredfold without detrimental effects on the visibility (see Appendix), which would surpass most of these systems and be on a par with Spring et al. (2017) and more traditional bulk sources engineered to produce pure photons Bruno et al. (2014).
VI Conclusion
We have demonstrated an asynchronous entanglement swapping experiment exploiting MRR photon-pair sources and time-resolved detection. The time-resolved detection allowed us to surpass what were previously thought to be fundamental limits for purity and HOM interference in basic MRR schemes. This consequently allowed us to achieve a record interference visibility of over for entanglement swapping between truly independent PIC-based sources. This could be further improved with a better understanding and identification of solutions to deal with the spurious noise sources inherent in many integrated photonic sources. Similarly, four-fold rates could be dramatically improved through a more complex circuit design. Nonetheless, the MRR have clearly demonstrated their potential for integration in more complex and distributed quantum network architectures and protocols.
Funding
This work was supported by the Swiss National Science Foundation SNSF, Grant No. 200020_182664, Grant No. 176563 (BRIDGE)and the NCCR QSIT. This material is based upon work supported by the Air Force Office of Scientific Research, Air Force Materiel Command, USAF under Award No. FA9550-19-1-0250.
Acknowledgements.
The authors would like to thank M. Caloz and M. Karpov for development of the SNSPD and the MRR, and M. Afzelius, P. Caspar, A. Boaron for useful discussions and technical support.Appendix A Photon-pair sources characterisation
The microring resonator (MRR) photon-pair sources are fabricated on the platform. The two sources are selected from different fabrication batches, they were chosen based on reasonably similar resonance characteristics around nm. The resonance parameters of both sources, including full width at half maximum of the photons’ Lorentzian spectrum , the coherence time (defined as ), the Q-factor, the free spectral range FSR, and the central wavelengths are all summarized in Table 2.
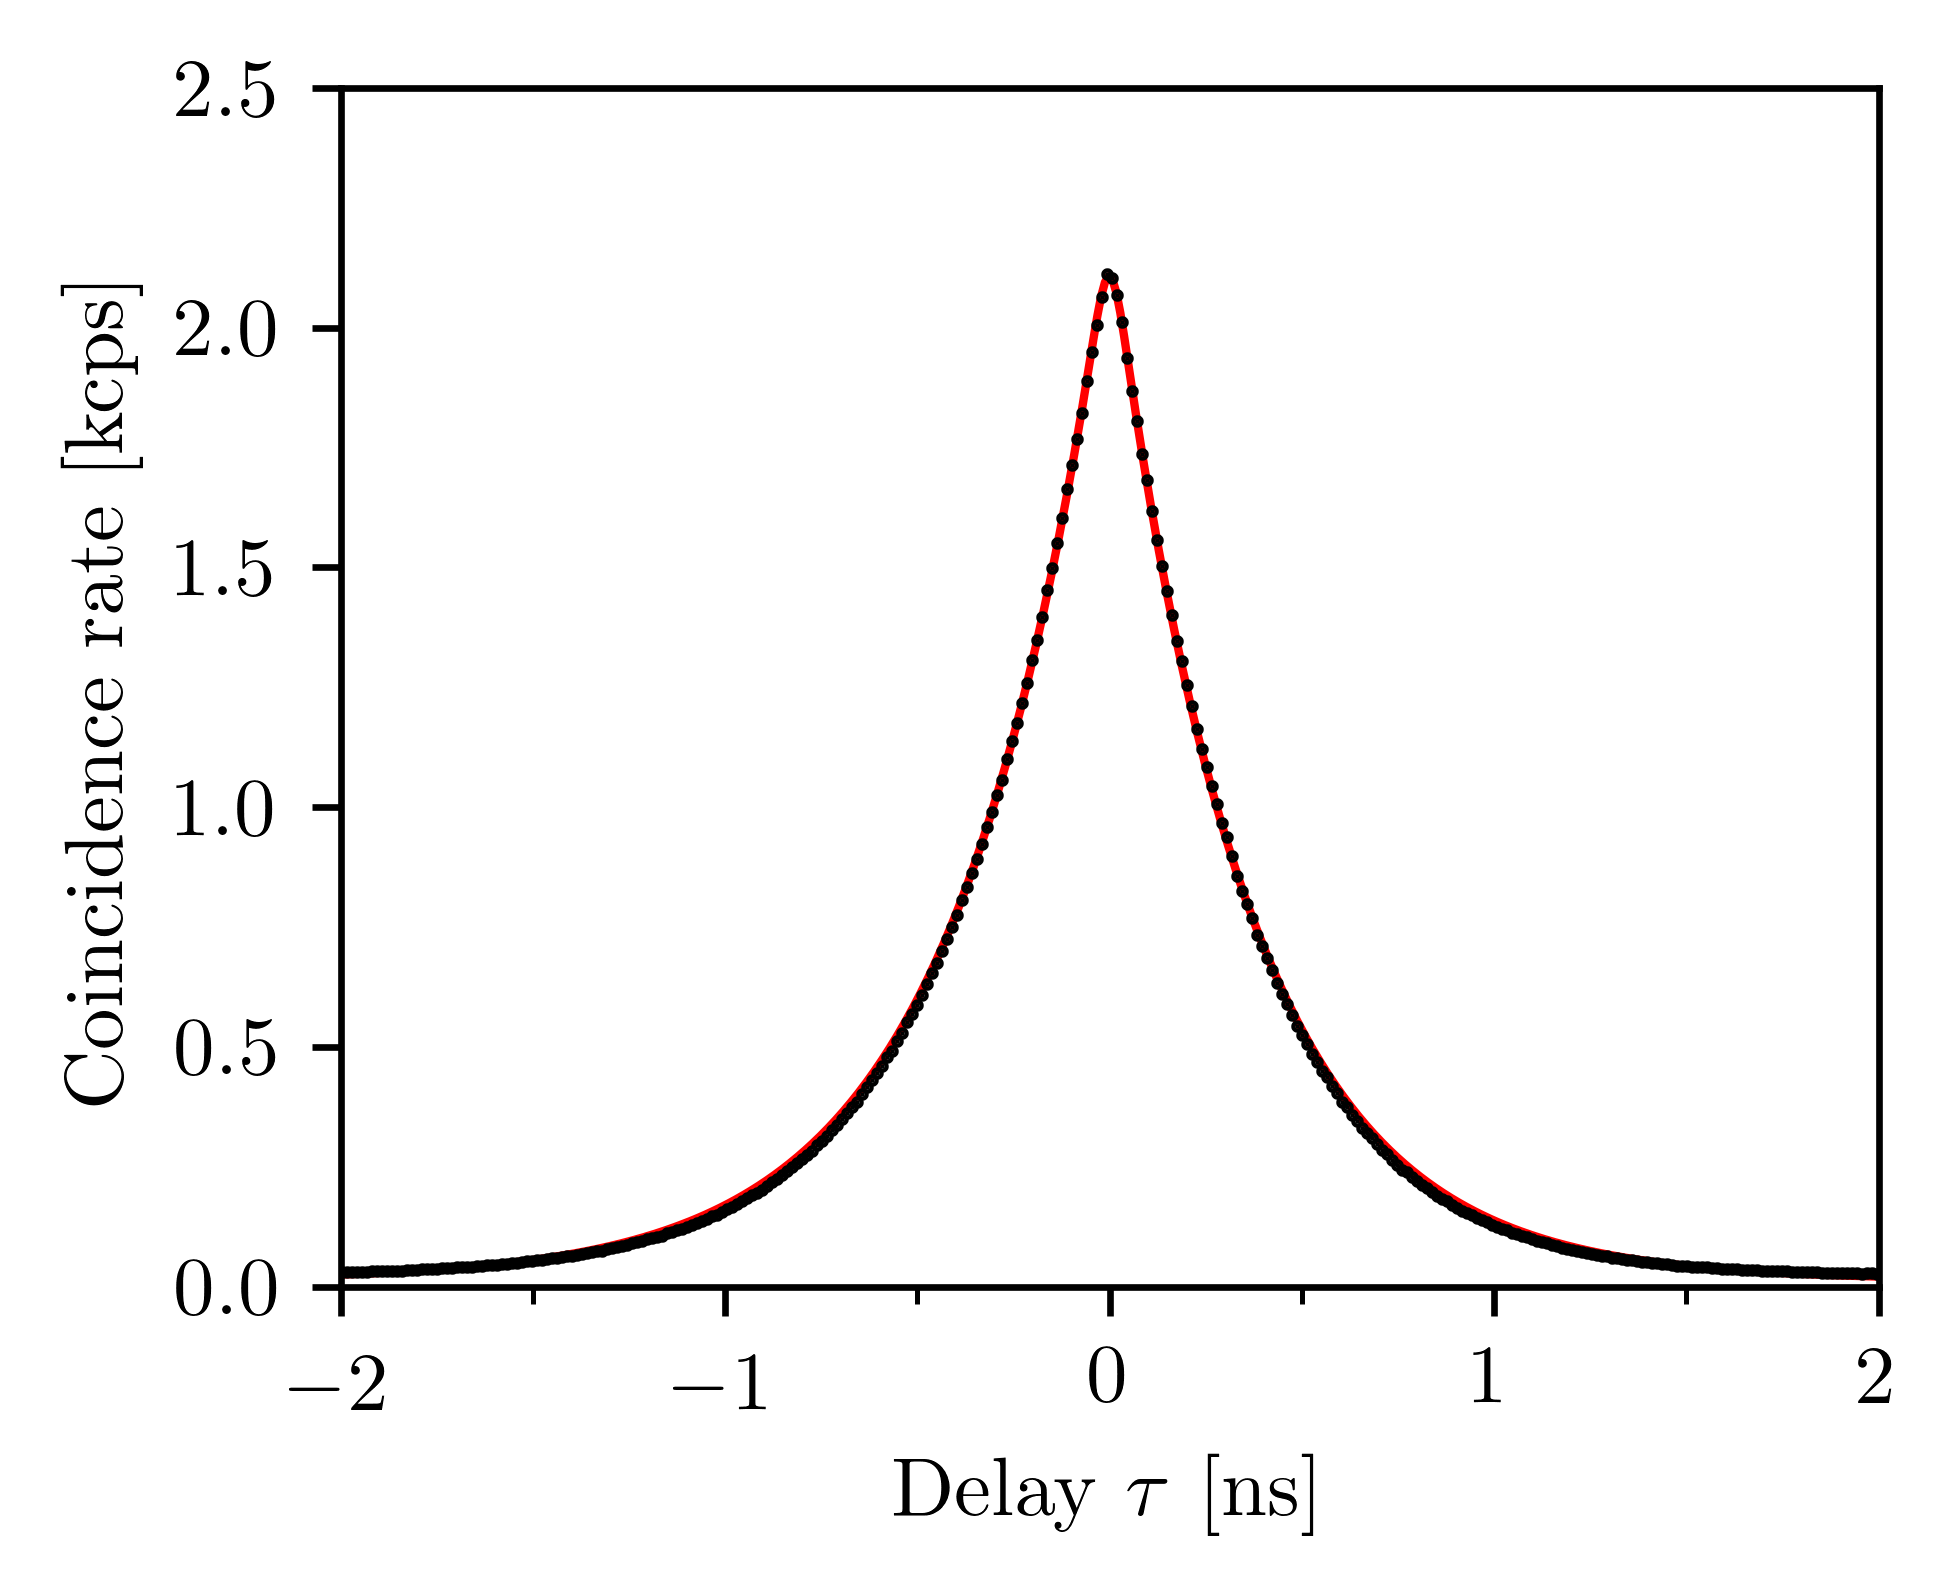
To characterize the sources individually, we first perform a cross-correlation analysis. Figure 4 reports an example of a coincidence histogram between the signal and idler of source 2 obtained with a pump power of . Here, the experimental data is fitted with a function given by an asymmetric double exponential, convoluted with a Gaussian distribution Clausen et al. (2014). The asymmetric double exponential part accounts for the temporal shape of the photons, including the slight miss-match between signal and idler resonances, and the Gaussian part accounts for the detectors’ timing jitter. From such a fitting, we can extract the coherence time and spectral width of our signal and idler photons individually (Table S1).
| Q-factor | FSR | PGR | |||||||
|---|---|---|---|---|---|---|---|---|---|
| [MHz] | [ps] | [nm] | [nm] | [nm] | [ | ||||
| Source 1 | 476 (437) | 669 (728) | 1.557 | 1552.75 (1558.98) | 1555.86 | 10.5 (13.6) | 1.96 | ||
| Source 2 | 335 (301) | 950 (1057) | 1.554 | 1555.87 (1558.98) | 1557.43 | 13.0 (16.4) | 1.97 |
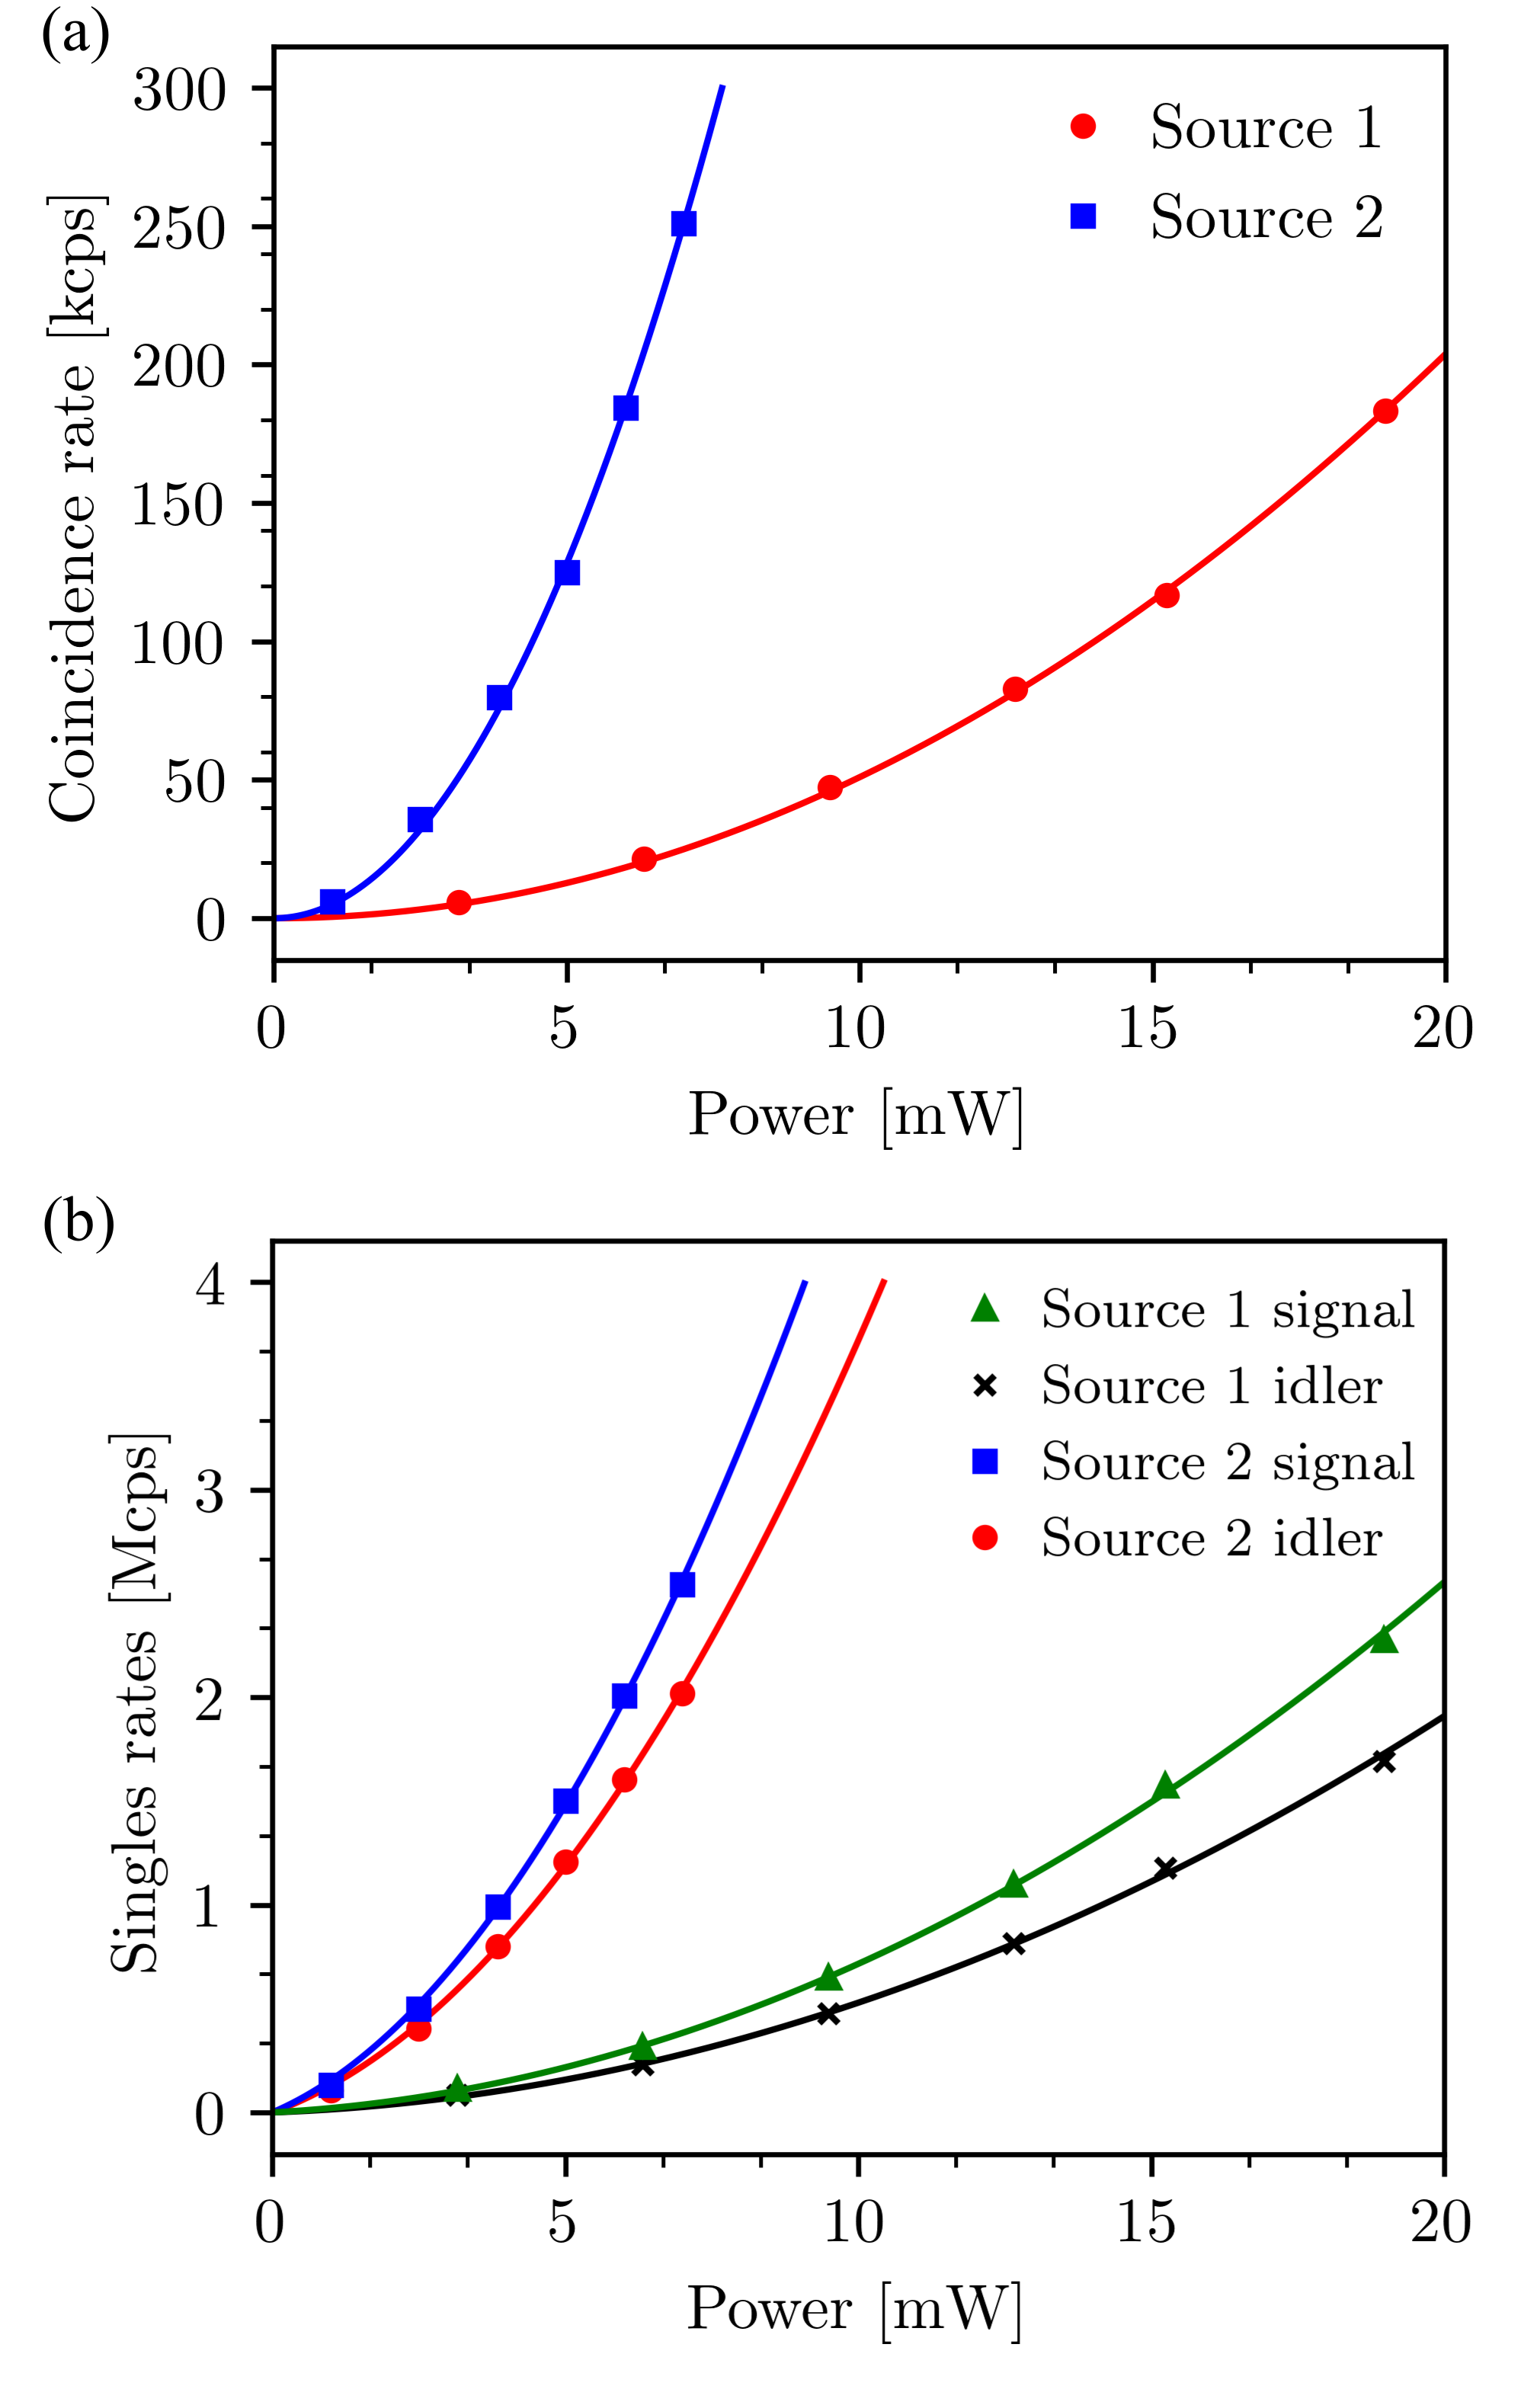
The coincidences and singles as a function of the pump power are reported in Figure 5. Here, the coincidences are taken as the total coincidences inside the correlation peak, minus the accidental coincidences outside the peak; while the singles are taken as the singles on-resonance, minus the singles off-resonance. As confirmed from the fitting, the coincidences scale quadratically with the pump power, in accordance with what is expected from the spontaneous four-wave mixing (SFWM) process. Nevertheless, in addition to the quadratic power dependency, a linear component is observed in the singles versus power relation Samara et al. (2019). Such a linear component is not expected to be the product of the SFWM process, giving rise to uncorrelated photons, which for us, acts as a photonic noise. As the singles in Figure 5(b), the photonic noise that we are referring to here is generated on-resonance inside the MRR chip. By considering only the singles that are coming from the SFWM process, i.e. the quadratic term in the fitting equation, the pair generation rate PGR and the heralding efficiency can be calculated (see Table 1). The difference between the PGR of the two sources can be explained by the difference between the coupling regimes (coupling between the cavity and the waveguide), also notable from different Q-factors.
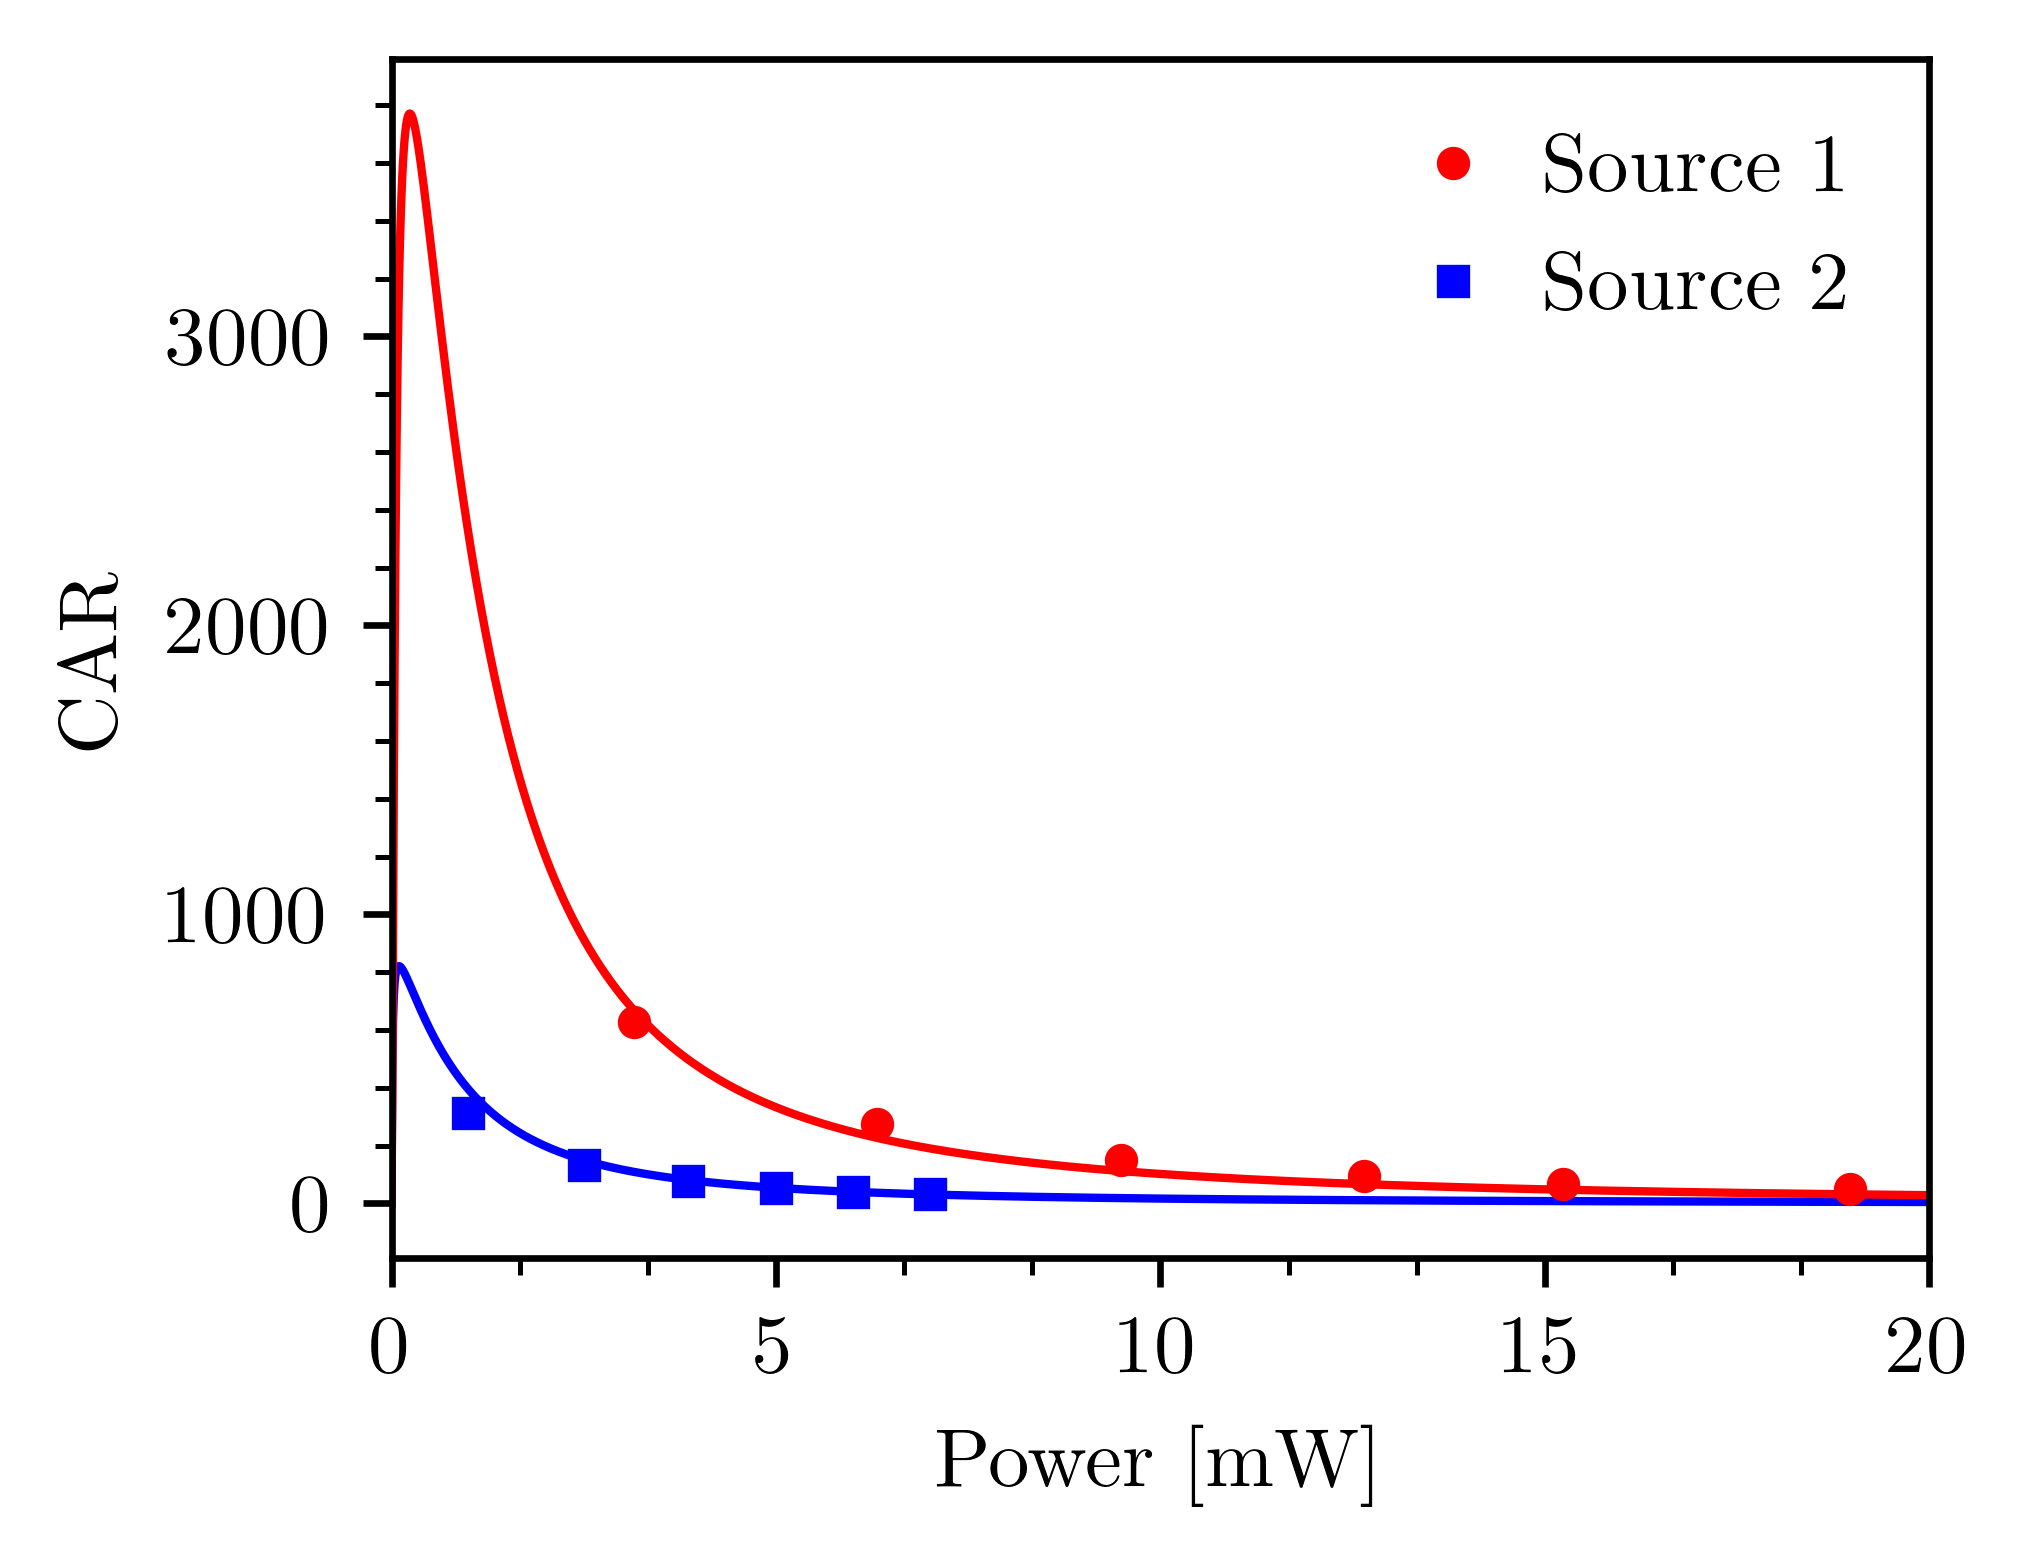
The coincidences-to-accidental ratio (CAR) gives a measure of the ratio between the correlated photon-pairs and the unwanted coincidences noise. The CAR as a function of the pump power is reported in Figure 6. The experimental data is fitted with a model that takes into account the photonic noise and the detectors dark counts. At high pump power, the CAR is limited by the double pair contribution, while at low pump power the limiting factor is the detector dark counts.
| Source 1 | Source 2 | |
|---|---|---|
| EL : Cavity extraction [dB] | 5.2 | 3.3 |
| CL : Waveguide-to-fiber [dB] | 2.0 | 3.0 |
| FL : Fiber components [dB] | 1.8 (2.1) | 1.8 (2.3) |
| Total [dB] | 9.2 | 8.4 |
Table LABEL:Table3 reports a breakdown of the transmission losses for each of the four paths in the HOM experiment. The coupling losses CL, and the fiber component transmission losses FL are measured directly by a power transmission measurement. Here the fiber components are the combination of power monitors, DWDMs for pump rejection and signal idler isolation, and polarization controllers (used to align the polarization for maximizing the SNSPDs detection efficiencies). For the idler paths, we consider both outputs of the 50:50 beam splitter BS, thus only its insertion losses are considered. This, together with the polarization aligning setup (Figure 2(c) main text), explains the slight difference between the signal and idler transmission losses.
Finally, photons need to couple out of the MRR cavity and into the bus waveguide, which accounts for additional transmission losses which we call extraction losses EL. These EL can be inferred by subtracting the CL and FL from the total transmission losses calculated from the heralding efficiencies (Table 1). For the entanglement swapping experiment, the additional interferometers in the idler paths and the DWDMs that are required for their phase-locking give on average an additional and of transmission losses in each path.
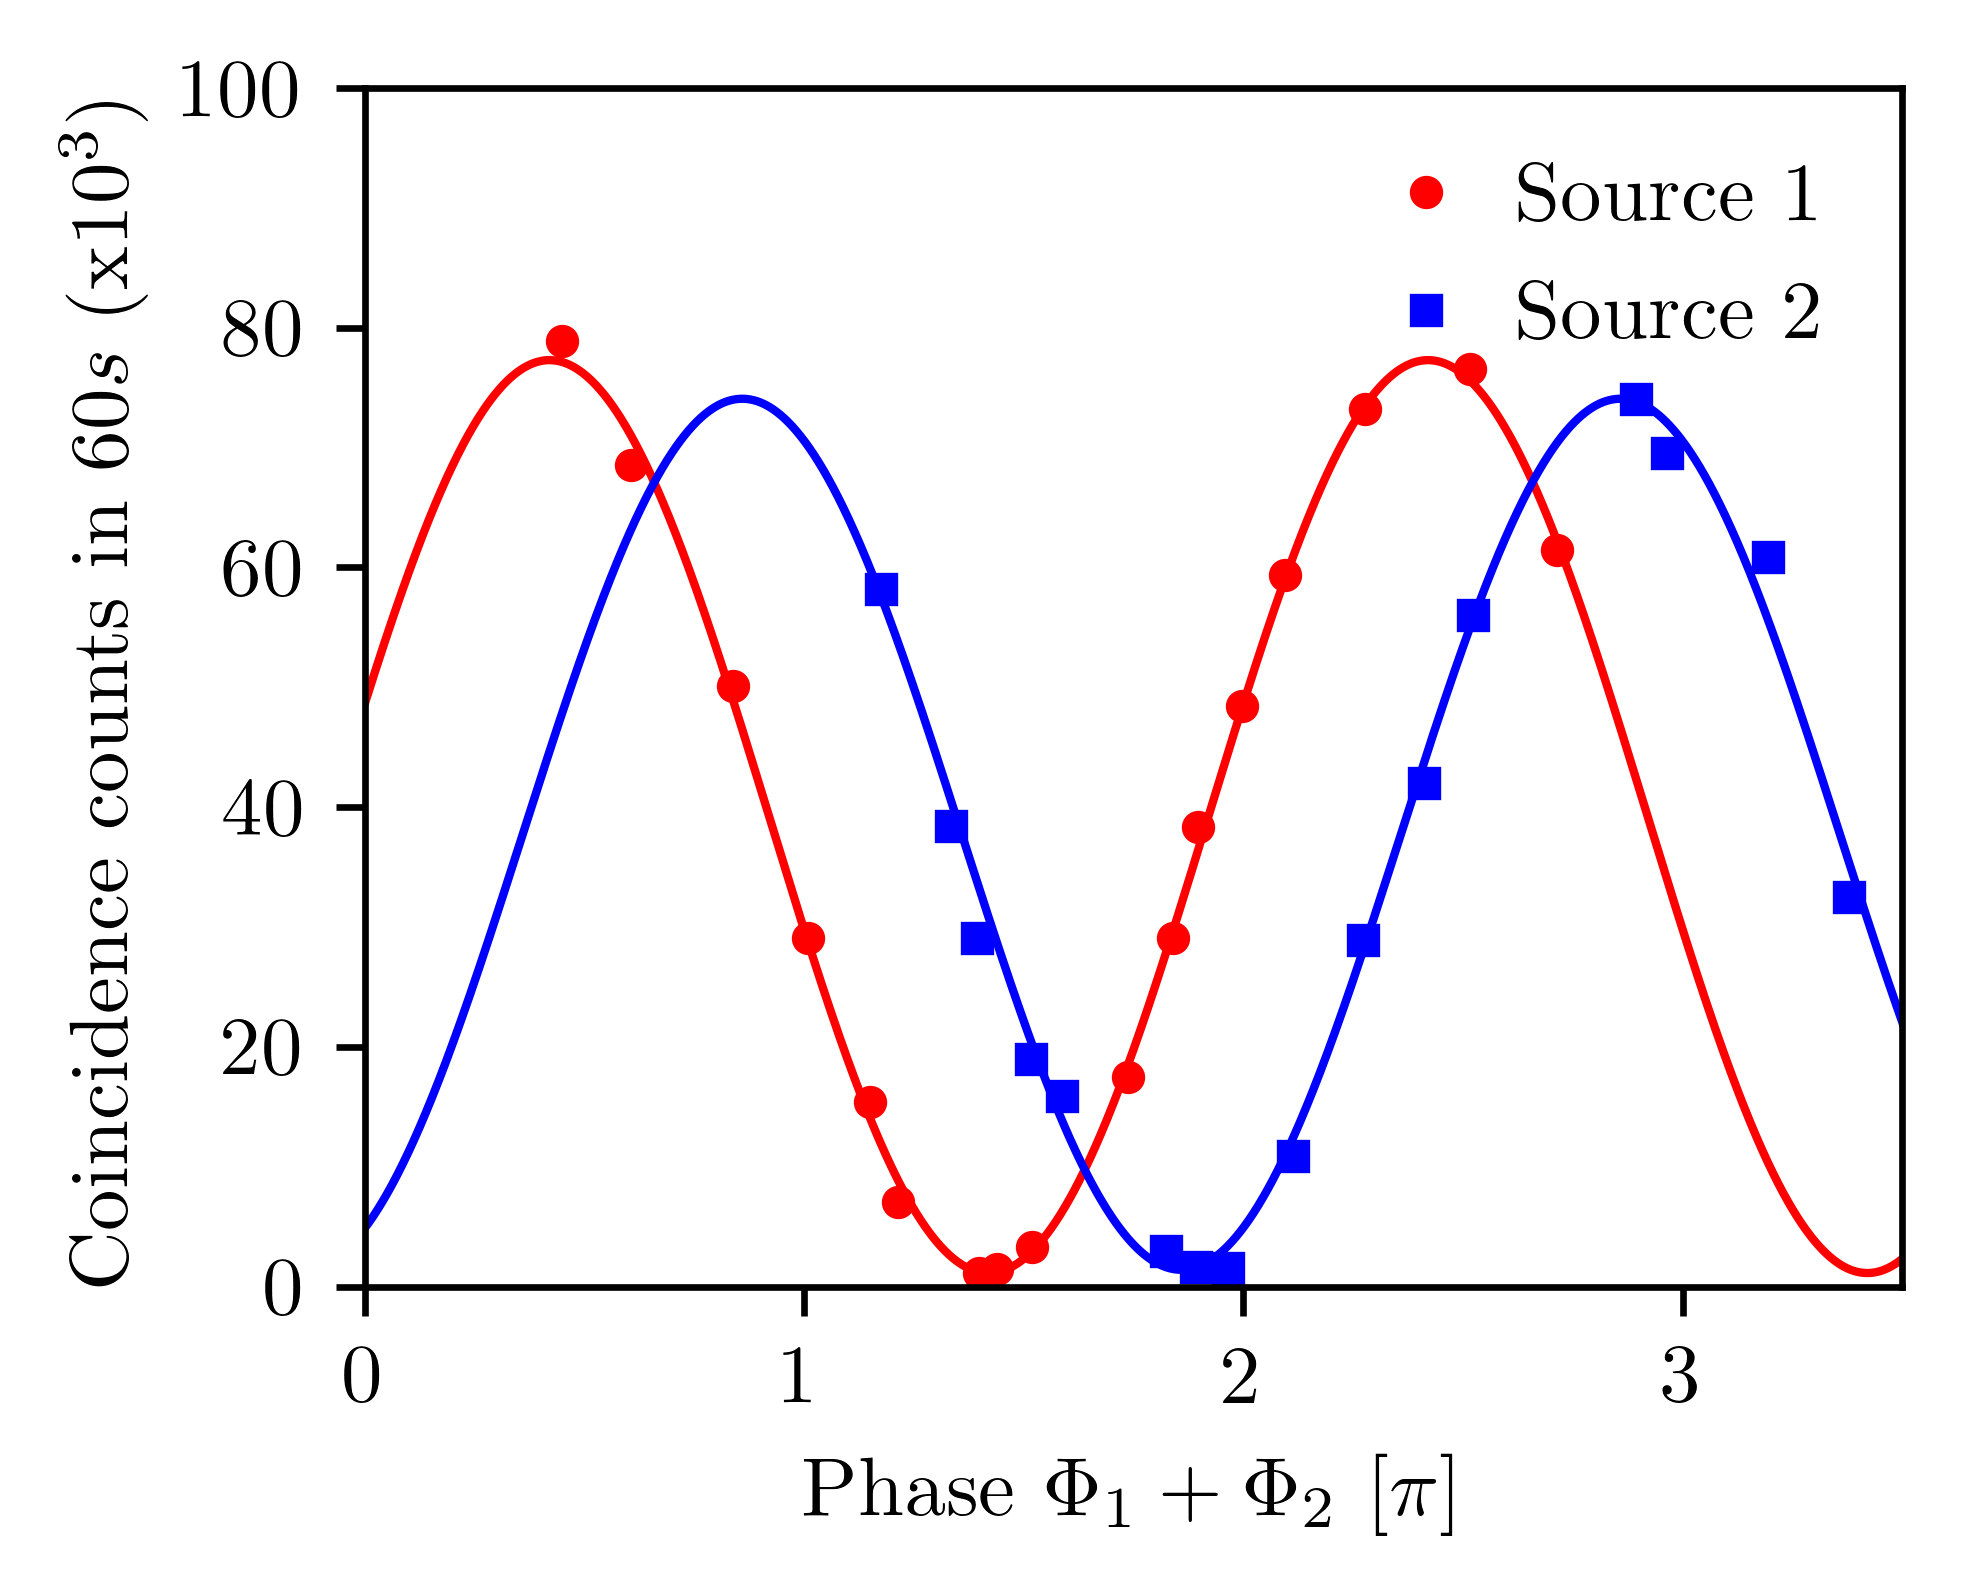
The sources emit energy-time entangled photons. The HOM and entanglement swapping visibilities are directly related to the quality of the energy-time entanglement. The quality of the energy-time entanglement can be verified individually for each source by passing the correlated photon-pairs in two imbalanced interferometers and observing the interfering term in the signal idler coincidences histogram as a function of the sum of the two interferometers phases Franson (1989). Figure 7 reports the coincidence fringes using two interferometers with path-length differences equal to . The raw (net) visibilities are () and ( ) for source 1 and 2 respectively.
Appendix B Spectral purity
High spectral purity is crucial for high visibility quantum interferences between independent sources. Spectrally pure photons mean that their joint spectral amplitude JSA is uncorrelated; the detection of the heralding photon does not change the spectral distribution of the heralded photon.
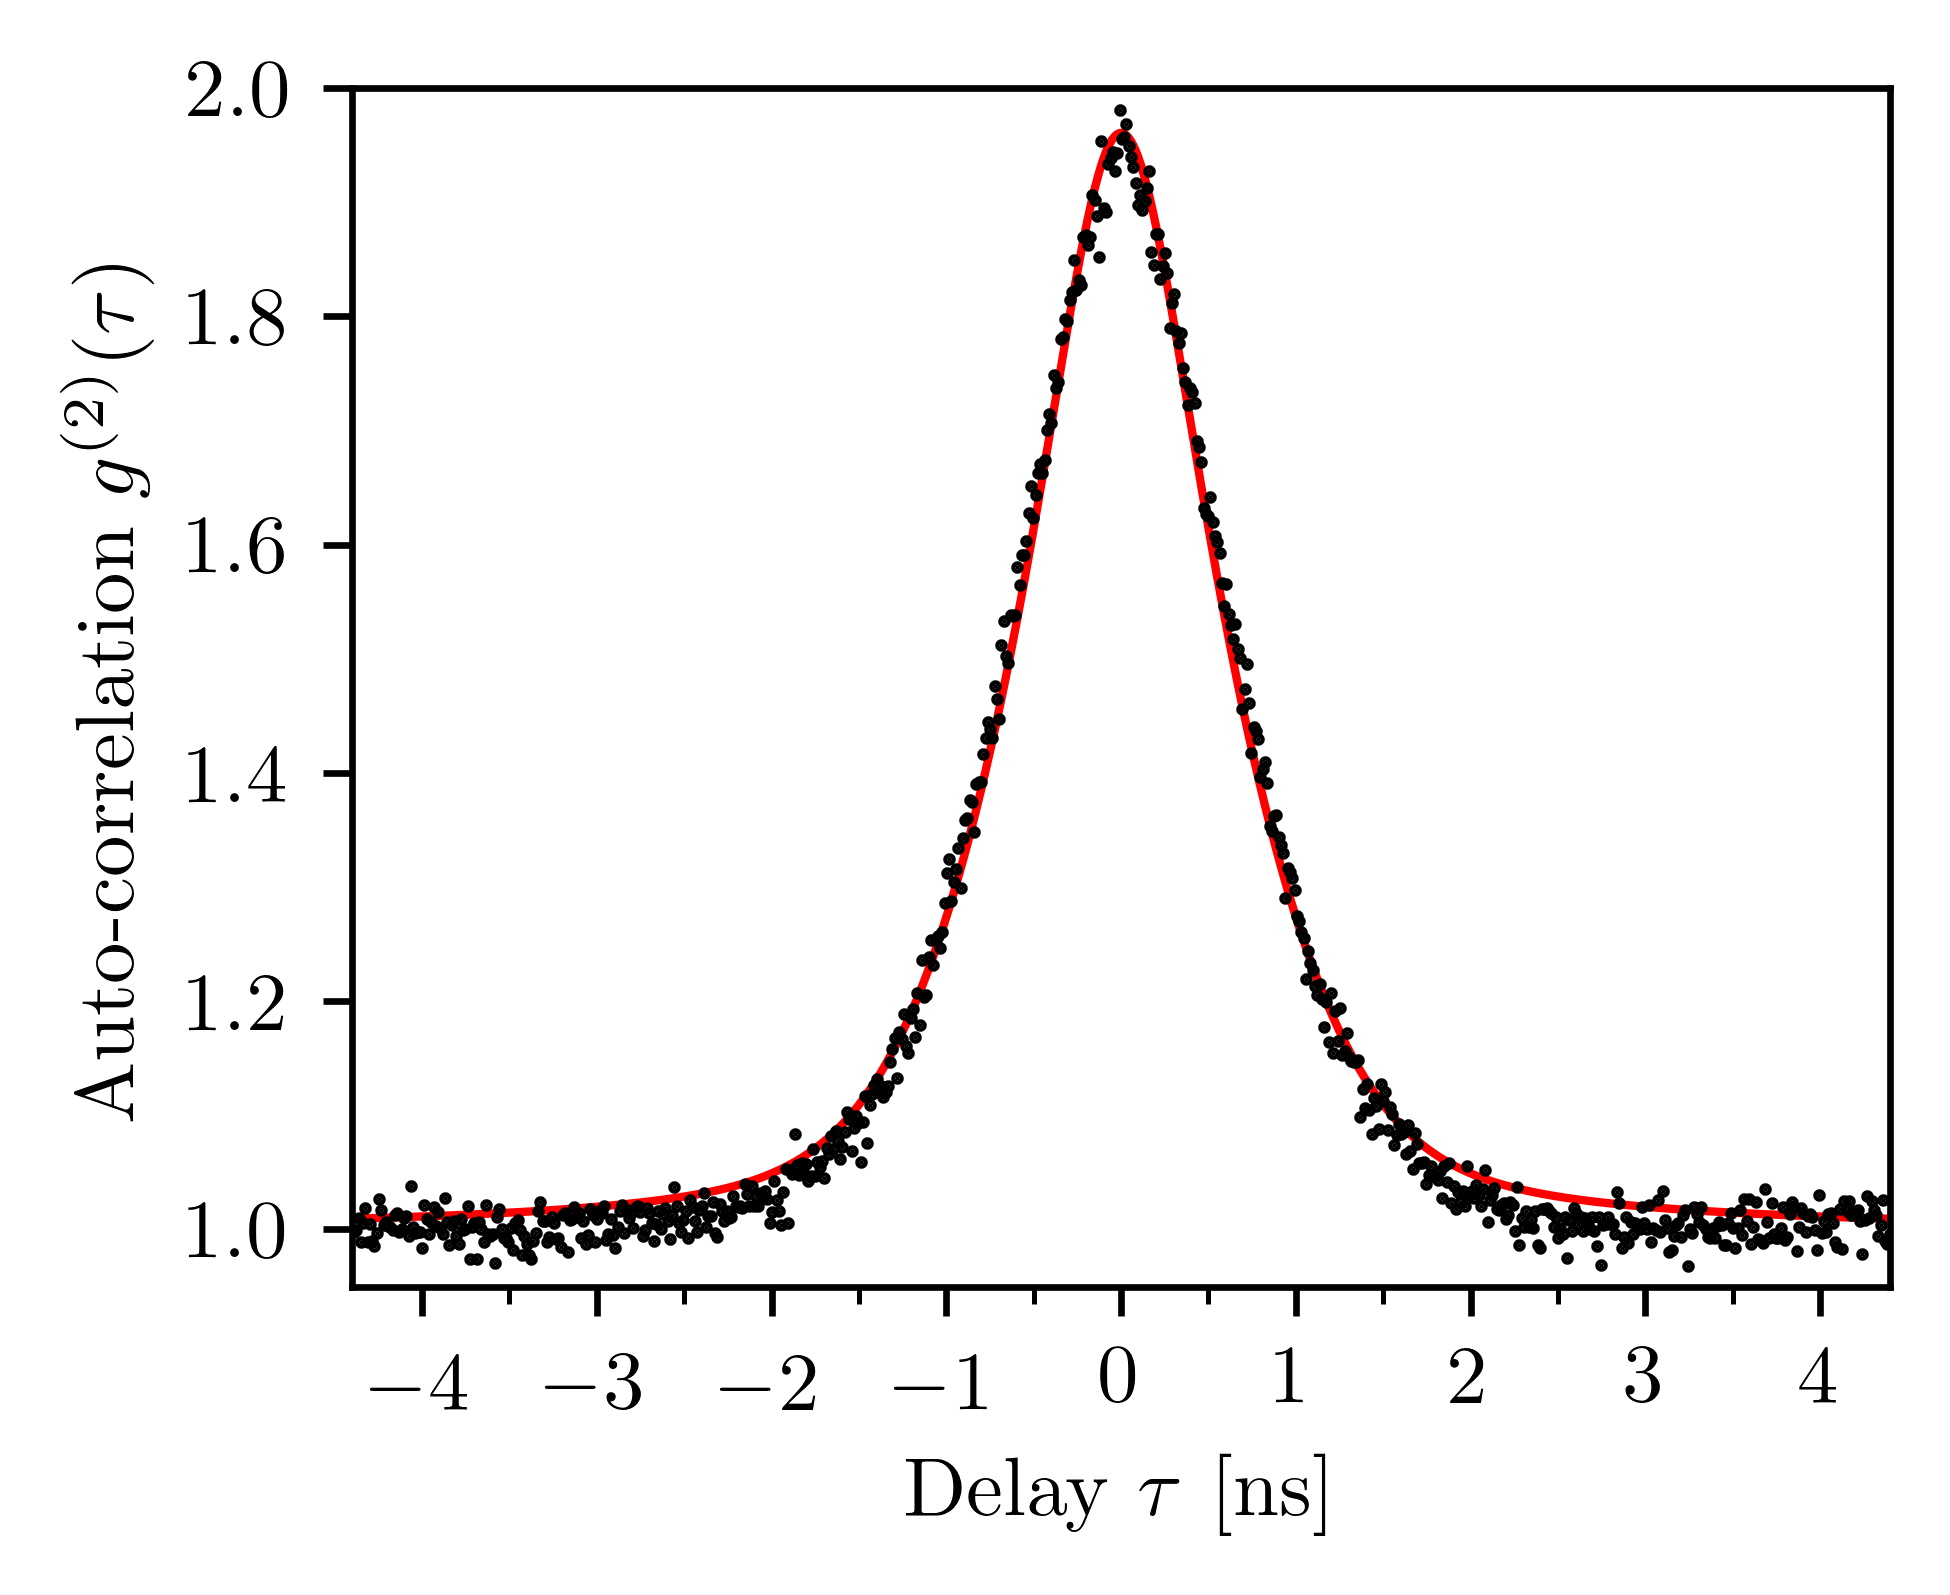
There are several methods for characterizing the spectral purity of a given photon-pair source Zielnicki et al. (2018). Here, due to the narrow spectral shape of the photons, we use the unheralded auto-correlation measurement . For single-mode thermal statistics, we expect a , while for a Poissonian superposition of several thermal modes (multimode), the tends to 1. The spectral purity , and the number of Schmidt modes K can be subsequently derived as . The obtained for source 1 (2) is (), with a corresponding and K values of () and ().
Figure 8 reports an example of an auto-correlation measurement. Here, the experimental data is fitted with a Pseudo-Voigt function, thus accounting for the Lorentzian shape of the two-photon component Luo et al. (2015, 2017) and the Gaussian jitter of the superconducting nanowire single-photon detectors SNSPDs.
Appendix C Spectral indistinguishability
Spectral indistinguishability is another important element that must be guaranteed for high visibility quantum interferences. In this work, spectral indistinguishability is guaranteed, firstly, by aligning the central wavelengths of both idler photons, and secondly by detecting with a small time resolution (), projecting the photons with spectral uncertainty, i.e. about 42 to 66 times larger than the spectral width of the photons.
The spectrum alignment of the idler photons is achieved by temperature tuning of the chip. A Peltier controls the temperature of each PIC through a feedback system. At our working wavelengths, the temperature coefficient is . By setting the temperatures of the PICs to and , the spectra of both idler photons were aligned between them, and in the center of the idler DWDM’s bandwidth (ITU channel N.23, ). Table 1 reports the operating wavelengths that are obtained after performing the spectral alignment. Figure 9 reports a transmission scan of the aligned idlers’ resonances. The obtained spectral overlap is , limited by a slight miss-match between the spectral width as shown in Table 1.
The central frequency of each laser drifts with time, leading to pump-resonance decoupling. By locking the chip temperature to the resonance dip, we avoid the pump-resonance decoupling, achieving on-resonance operation for more than 24 hours. This is achieved by a computer algorithm that monitors the residual pump power at the PIC output and generates an error signal that acts on the set point of the temperature controller system.
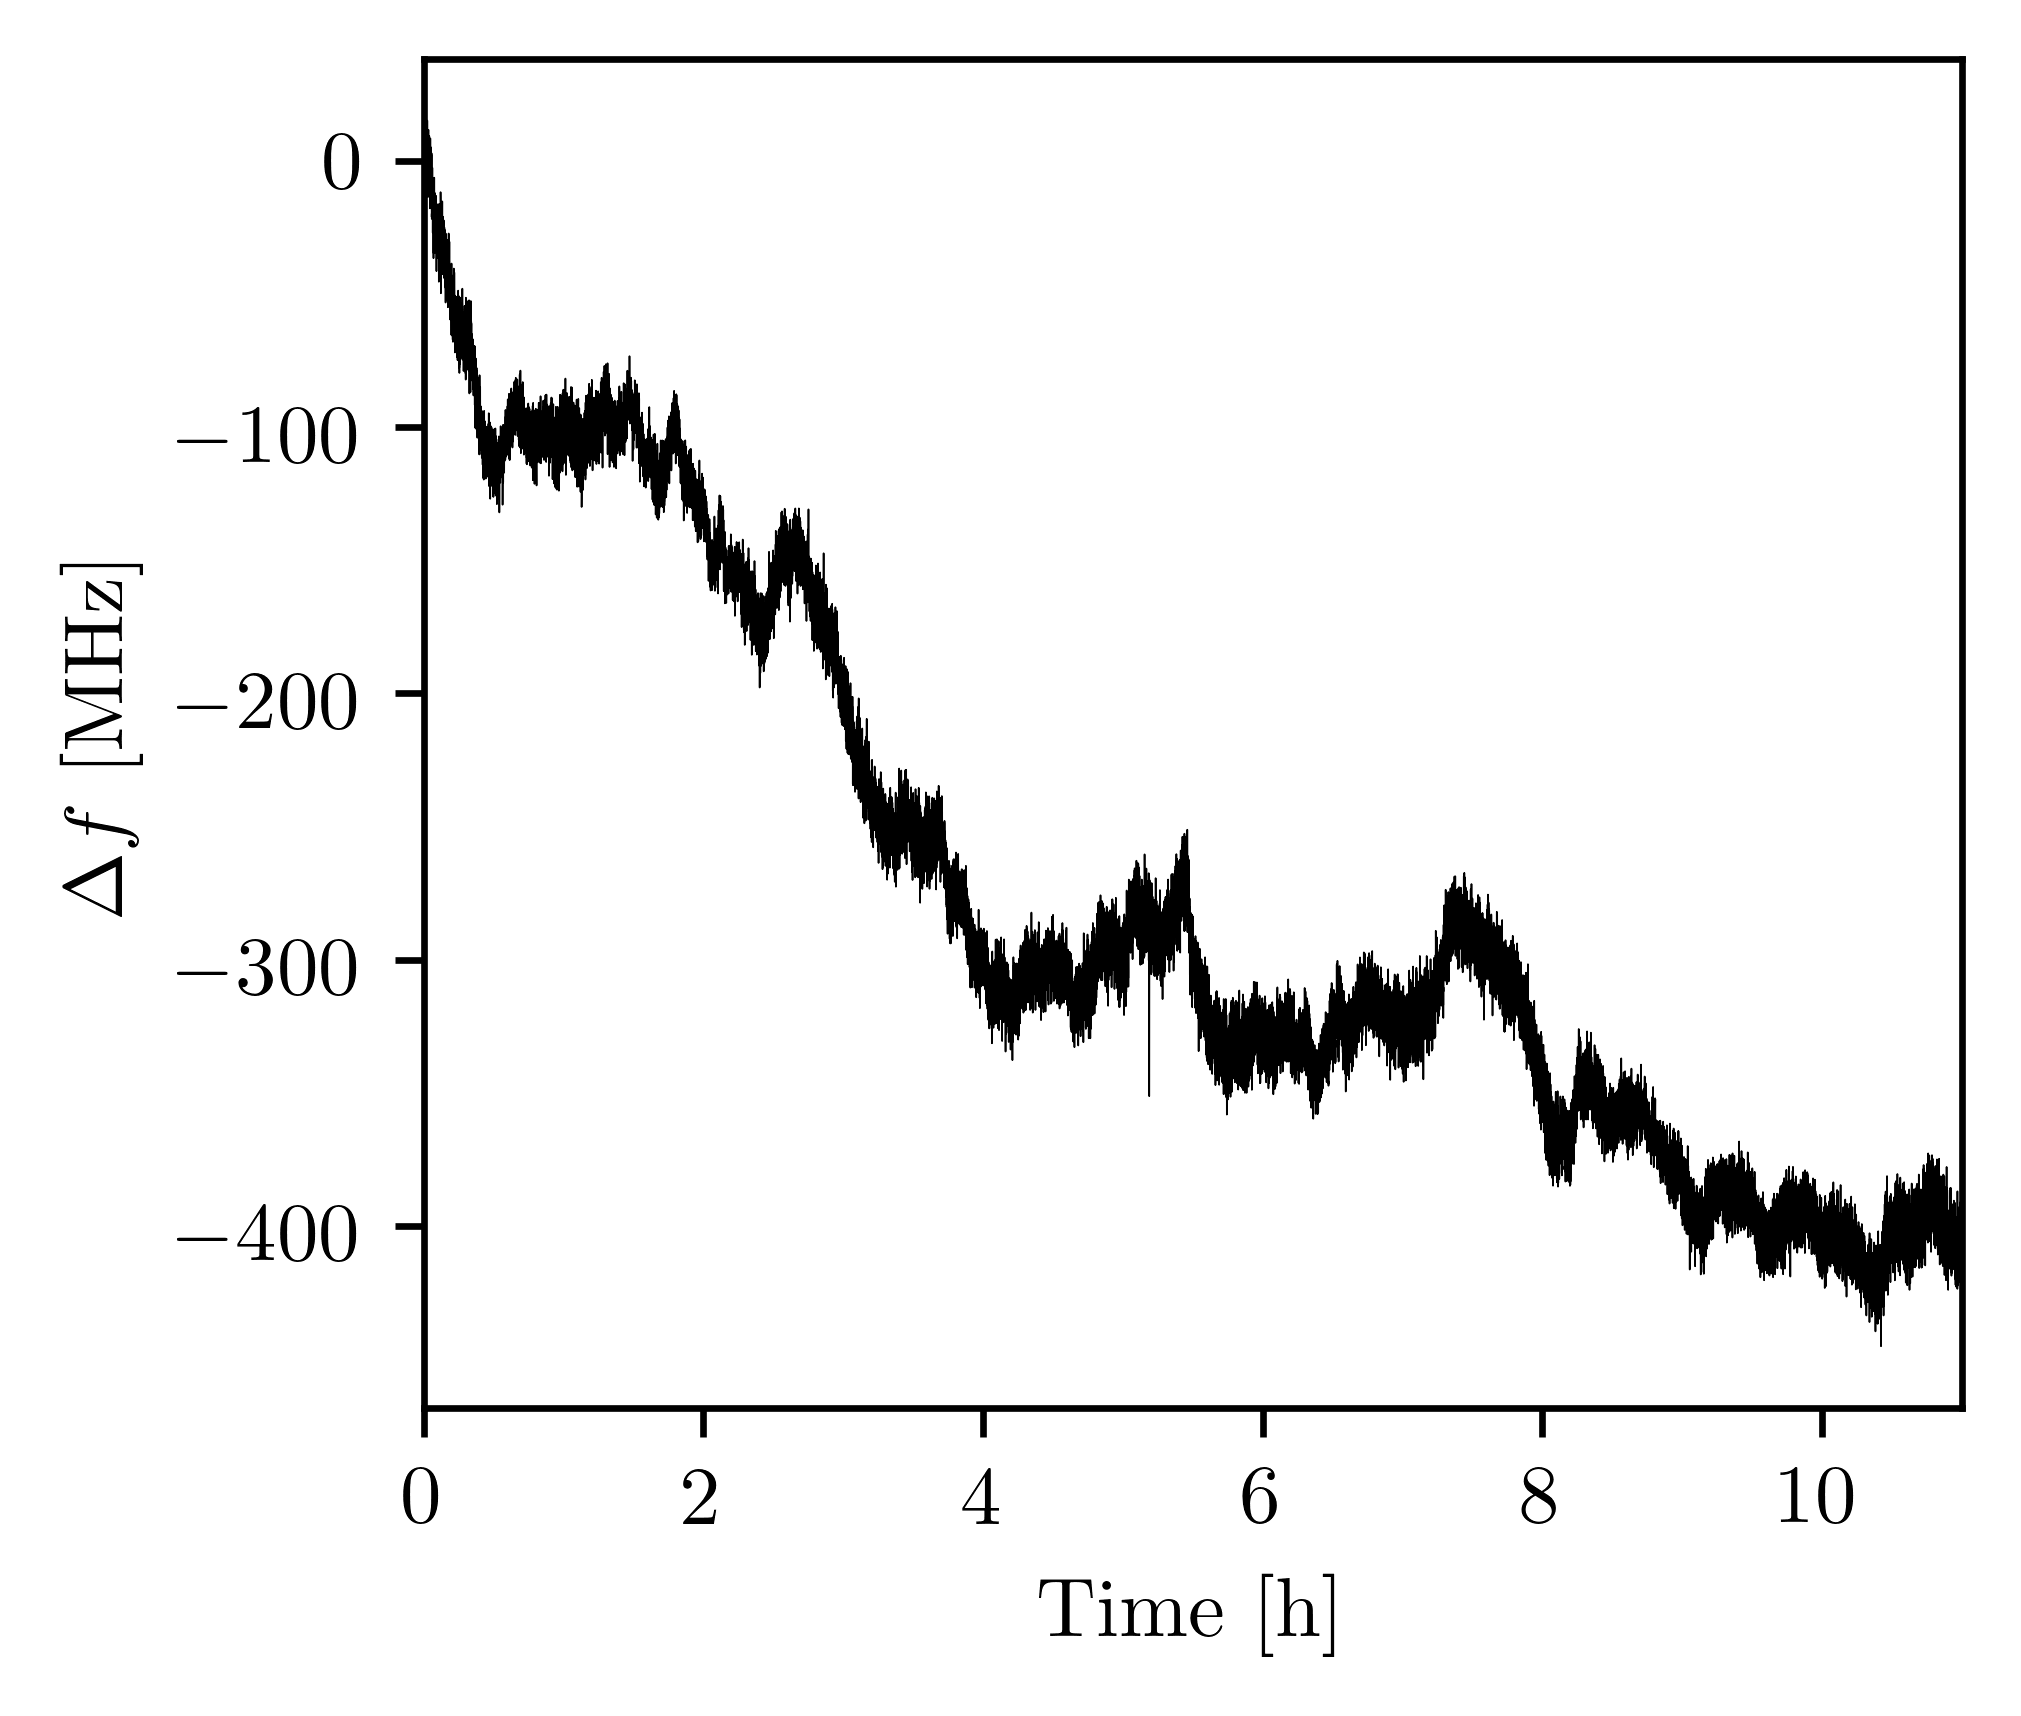
The two MRRs are pumped with two different CW pump lasers (Toptica DL100). The lasers’ drift induces a central frequency miss-match as shown in Figure 10, causing a spectral overlap degradation. For the HOM measurement, nothing further is done to compensate for the time-dependant spectral overlap degradation. Indeed, as confirmed from Figure 10, the effect of the relative drift between the two lasers over the relatively short period of the HOM measurement (2 hours) can be neglected since the drift is much shorter than the spectral uncertainty given by the fast detection ().
Appendix D Interferometers stabilisation scheme
For the entanglement swapping experiment, the drift of the lasers frequencies produces an unwanted drift in the individual and relative phases of the interferometers. This is exacerbated by the long measurement time (30 hours) required to acquire each fringe in Figure 3. To compensate for this, we implement a locking system to stabilise the absolute phase of each interferometer and , in addition to the relative phase . This is done by locking Alice’s (Bob’s) interferometer on the laser pump of source 1 (2). For this aim, a fraction of pump power before the PIC -where power fluctuation is minimum- is extracted, and consequently re-injected into the corresponding interferometer. The error signal is then used to act on the interferometer’s piezo, thus keeping a constant phase for the passing photons. To compensate for the relative frequency drift between the two lasers, part of source 2 laser pump power was also injected in Alice’s interferometer, thus giving an error signal on which the frequency of the pump laser is locked.
Appendix E Four-fold rate and visibility
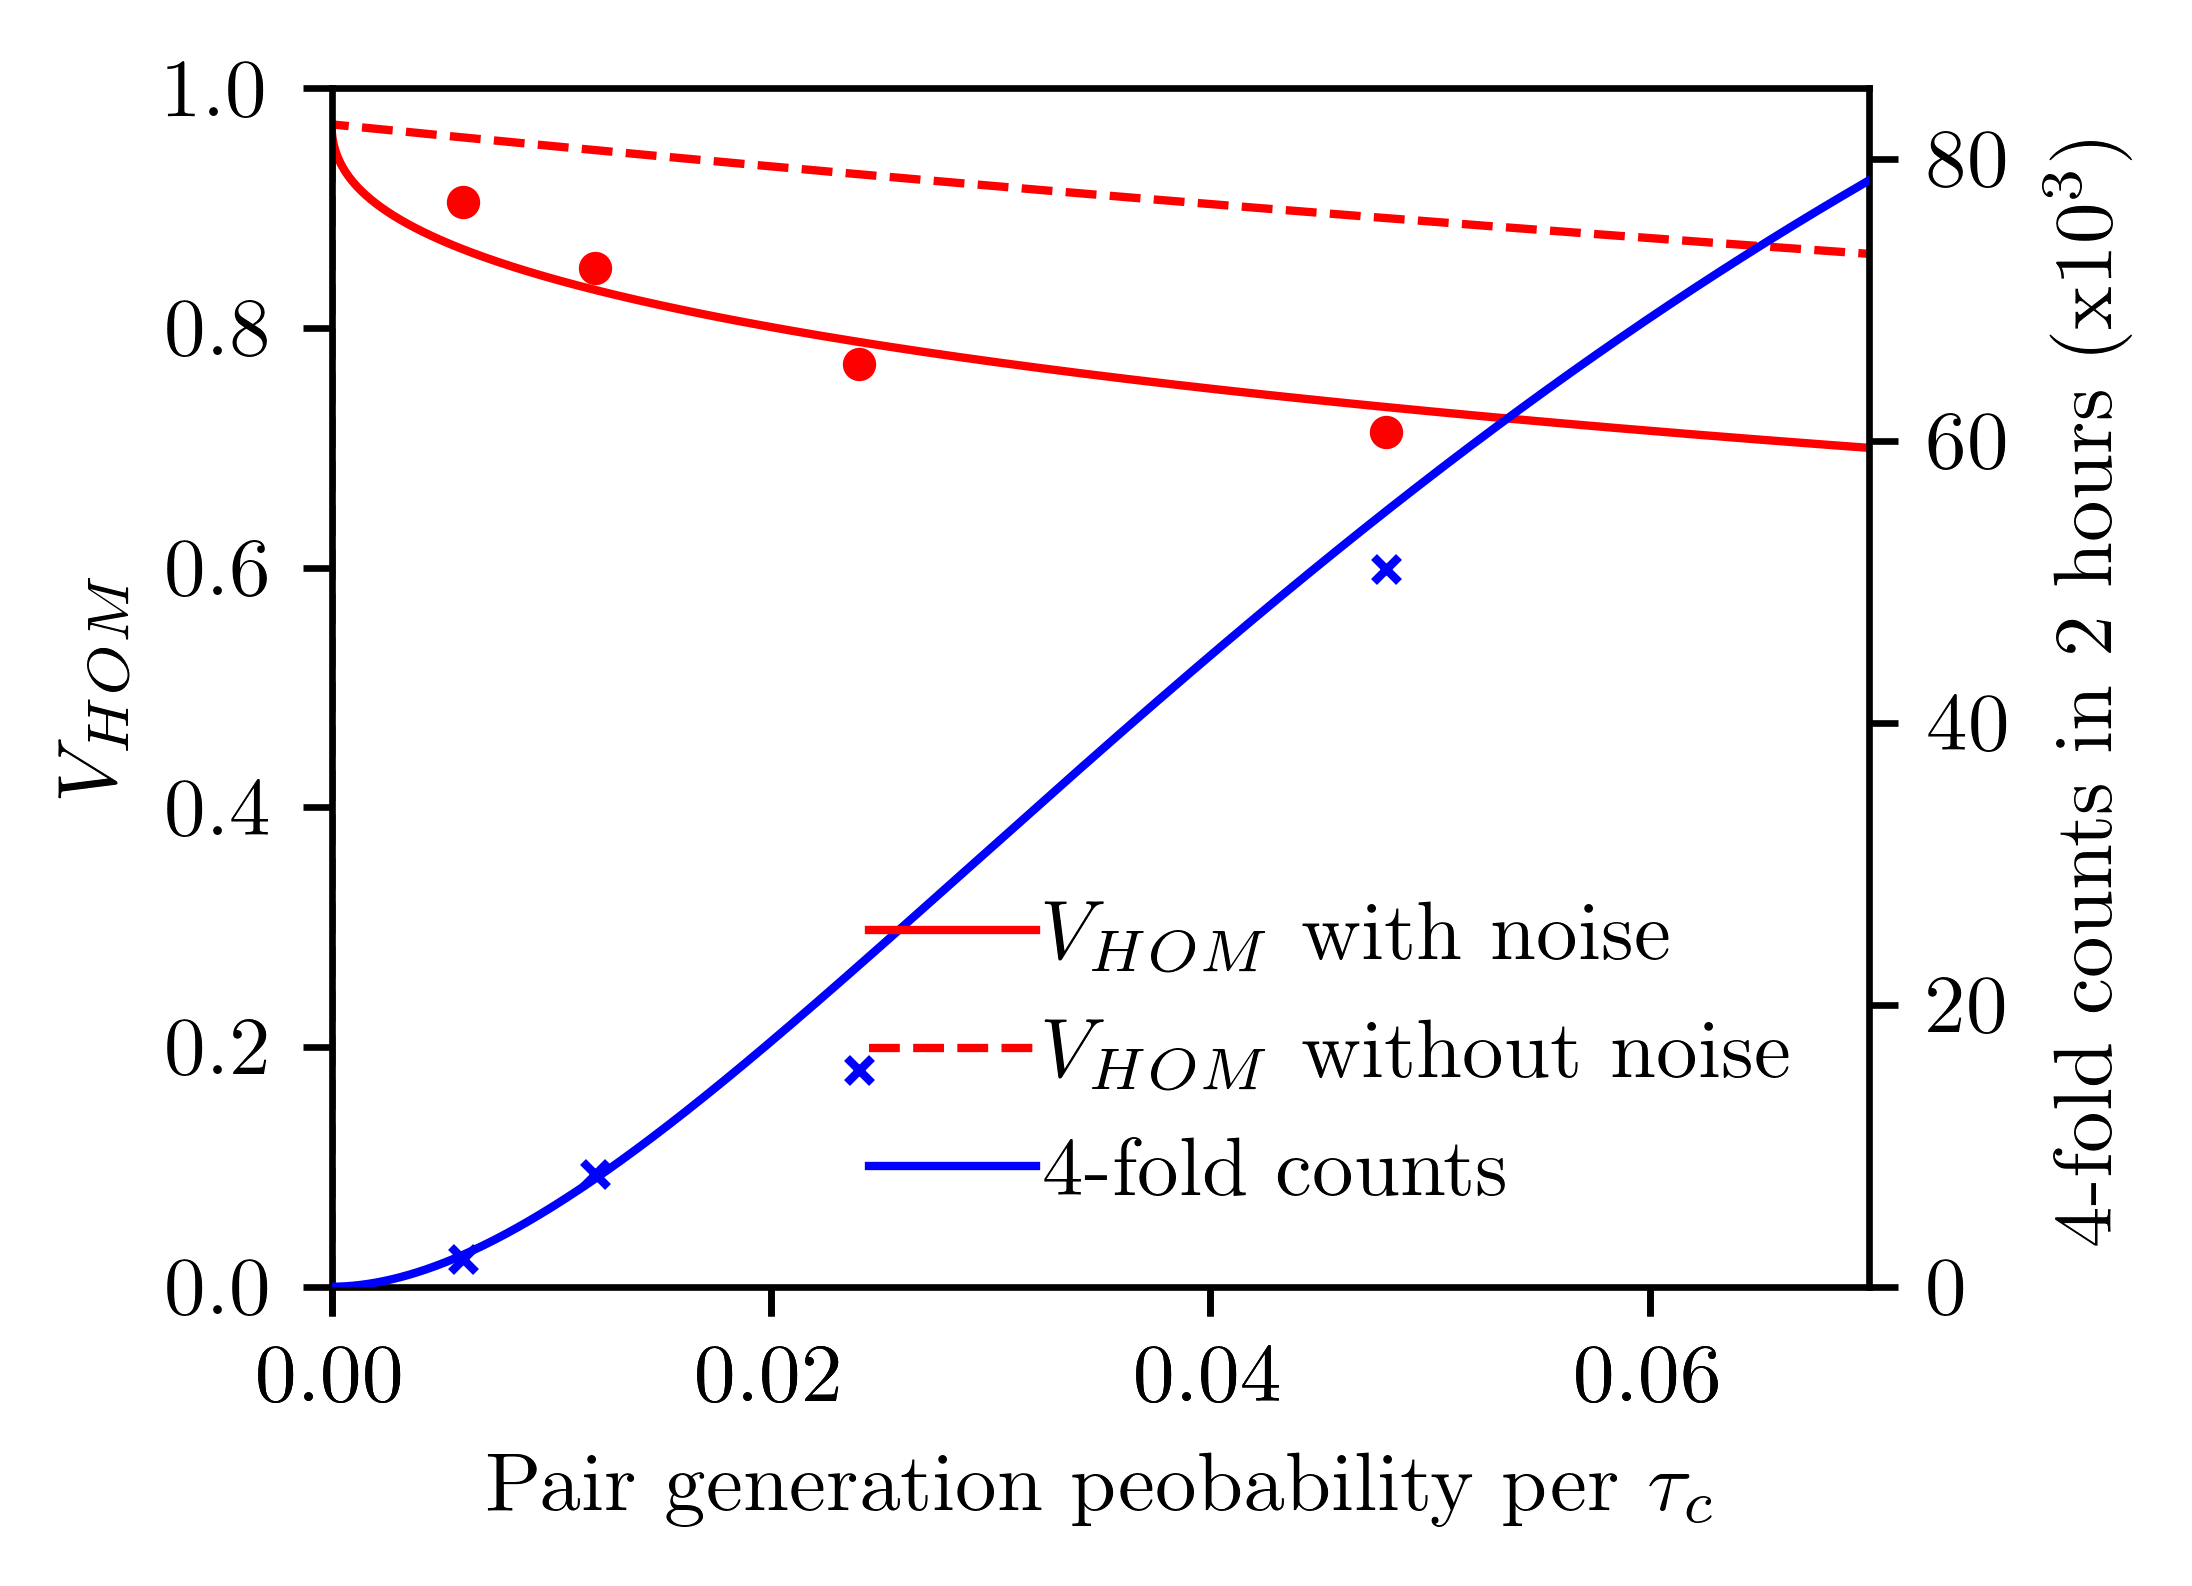
The average four-fold rates in our HOM and entanglement swapping experiments are about 450 and 33 cph (max fringe) respectively. One can increase the four-fold rate by increasing the pair generation probability, but at the cost of lower HOM and entanglement swapping visibilities due to double-pair contribution. The four-fold rate and trade-off is reported in Figure 11. While it is possible to improve the four-fold rate by working at higher pair generation probabilities (fixed at 0.006 per coherence time in the present work), the reduction is clearly faster than what is expected for a photon pair source without the presence of photonic noise. This motivates further study into the origin of the photonic noise with the hope of its eventual mitigation.
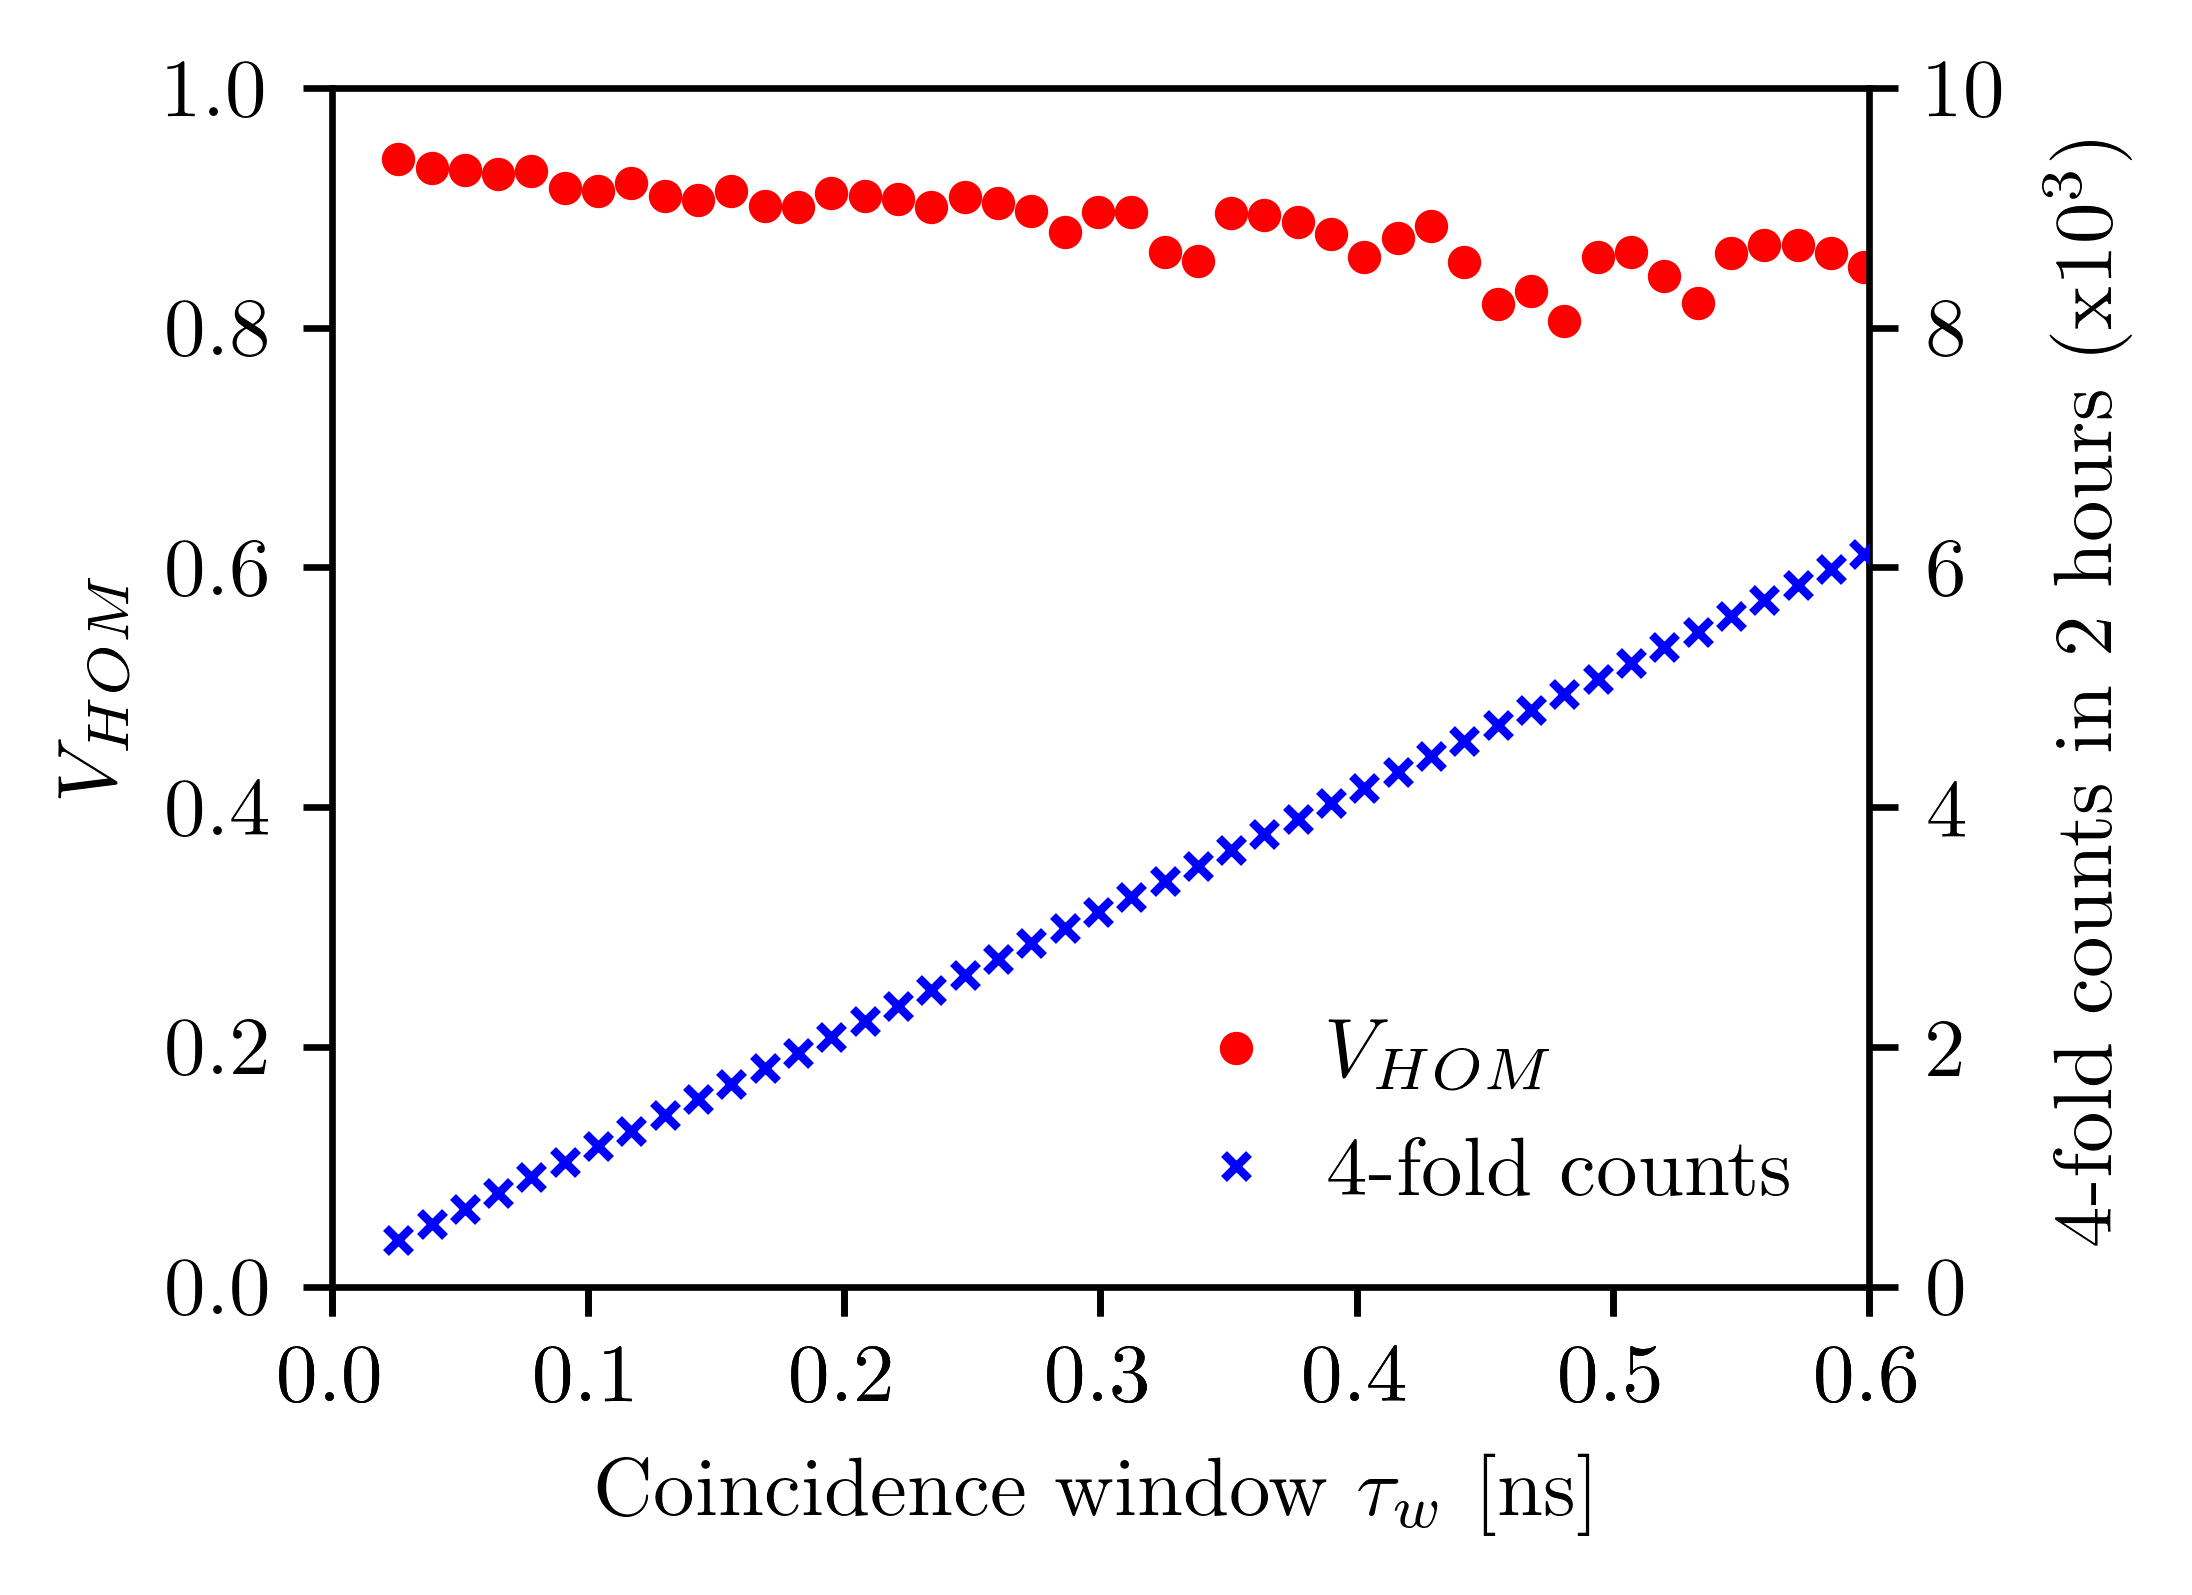
A second factor that is directly affecting the four-fold rate is the coincidence window at the BSM node. In the present work, the BSM coincidence window is set to , guaranteeing the time-resolving condition , therefore resulting in high HOM and entanglement swapping visibilities. Note that a shorter window will not necessarily mean better visibilities since the chosen value is already comparable with our detection scheme resolution. However, depending on the application at hand, one can chose to elongate the coincidence window, thus achieving higher four-fold rates at the cost of lower visibilities. The trade-off between four-fold rate and HOM visibility as a function of the coincidence window is reported in Figure 12.
References
- Żukowski (1993) M. Żukowski, Physical Review Letters 71, 4287 (1993).
- Peres (2000) A. Peres, Journal of Modern Optics 47, 139 (2000).
- Branciard et al. (2010) C. Branciard, N. Gisin, and S. Pironio, Phys. Rev. Lett. 104, 170401 (2010).
- Briegel et al. (1998) H.-J. Briegel, W. Dür, J. I. Cirac, and P. Zoller, Physical Review Letters 81, 5932 (1998).
- Duan et al. (2001) L. M. Duan, M. D. Lukin, J. I. Cirac, and P. Zoller, Nature 414, 413 (2001), quant-ph/0105105 .
- Sangouard et al. (2011) N. Sangouard, C. Simon, H. d. Riedmatten, and N. Gisin, Reviews of Modern Physics 83, 33 (2011).
- Boschi et al. (1998) D. Boschi, S. Branca, F. D. Martini, L. Hardy, and S. Popescu, Physical Review Letters 80, 1121 (1998).
- Pan et al. (1998) J.-W. Pan, D. Bouwmeester, H. Weinfurter, and A. Zeilinger, Physical Review Letters 80, 3891 (1998).
- de Riedmatten et al. (2005) H. de Riedmatten, I. Marcikic, J. A. W. van Houwelingen, W. Tittel, H. Zbinden, and N. Gisin, Phys. Rev. A 71, 050302 (2005).
- Pan et al. (2012) J.-W. Pan, Z.-B. Chen, C.-Y. Lu, H. Weinfurter, A. Zeilinger, and M. Żukowski, Reviews of Modern Physics 84, 777 (2012), 0805.2853 .
- Bernien et al. (2013) H. Bernien, B. Hensen, W. Pfaff, G. Koolstra, M. S. Blok, L. Robledo, T. H. Taminiau, M. Markham, D. J. Twitchen, L. Childress, and R. Hanson, Nature 497, 86 (2013).
- Rosenfeld et al. (2017) W. Rosenfeld, D. Burchardt, R. Garthoff, K. Redeker, N. Ortegel, M. Rau, and H. Weinfurter, Physical Review Letters 119, 010402 (2017).
- Wang et al. (2019) J. Wang, F. Sciarrino, A. Laing, and M. G. Thompson, Nature Photonics 14, 273 (2019), 2005.01948 .
- Grassani et al. (2015) D. Grassani, S. Azzini, M. Liscidini, M. Galli, M. J. Strain, M. Sorel, J. E. Sipe, and D. Bajoni, Optica 2, 88 (2015).
- Hemsley et al. (2016) E. Hemsley, D. Bonneau, J. Pelc, R. Beausoleil, J. L. O’Brien, and M. G. Thompson, Scientific reports 6, 38908 (2016).
- Ma et al. (2017) C. Ma, X. Wang, V. Anant, A. D. Beyer, M. D. Shaw, and S. Mookherjea, Optics Express 25, 32995 (2017), 1710.01001 .
- Samara et al. (2019) F. Samara, A. Martin, C. Autebert, M. Karpov, T. J. Kippenberg, H. Zbinden, and R. Thew, Optics Express 27, 19309 (2019).
- Oser et al. (2020) D. Oser, S. Tanzilli, F. Mazeas, C. Alonso-Ramos, X. L. Roux, G. Sauder, X. Hua, O. Alibart, L. Vivien, E. Cassan, and L. Labonté, npj Quantum Information 6, 31 (2020).
- Pasquazi et al. (2018) A. Pasquazi, M. Peccianti, L. Razzari, D. J. Moss, S. Coen, M. Erkintalo, Y. K. Chembo, T. Hansson, S. Wabnitz, P. Del’Haye, X. Xue, A. M. Weiner, and R. Morandotti, Physics Reports 729, 1 (2018).
- Kues et al. (2019) M. Kues, C. Reimer, J. M. Lukens, W. J. Munro, A. M. Weiner, D. J. Moss, and R. Morandotti, Nature Photonics 13, 170 (2019).
- Llewellyn et al. (2019) D. Llewellyn, Y. Ding, I. I. Faruque, S. Paesani, D. Bacco, R. Santagati, Y.-J. Qian, Y. Li, Y.-F. Xiao, M. Huber, M. Malik, G. F. Sinclair, X. Zhou, K. Rottwitt, J. L. O’Brien, J. G. Rarity, Q. Gong, L. K. Oxenlowe, J. Wang, and M. G. Thompson, Nature Physics 16, 148 (2019), 1911.07839 .
- Aboussouan et al. (2010) P. Aboussouan, O. Alibart, D. B. Ostrowsky, P. Baldi, and S. Tanzilli, Physical Review A 81, 021801 (2010).
- Kaltenbaek et al. (2006) R. Kaltenbaek, B. Blauensteiner, M. Żukowski, M. Aspelmeyer, and A. Zeilinger, Physical Review Letters 96, 240502 (2006).
- Yang et al. (2006) T. Yang, Q. Zhang, T.-Y. Chen, S. Lu, J. Yin, J.-W. Pan, Z.-Y. Wei, J.-R. Tian, and J. Zhang, Physical Review Letters 96, 110501 (2006), quant-ph/0502146 .
- Kaltenbaek et al. (2009) R. Kaltenbaek, R. Prevedel, M. Aspelmeyer, and A. Zeilinger, Physical Review A 79, 040302 (2009).
- Sun et al. (2017a) Q.-C. Sun, Y.-L. Mao, Y.-F. Jiang, Q. Zhao, S.-J. Chen, W. Zhang, W.-J. Zhang, X. Jiang, T.-Y. Chen, L.-X. You, L. Li, Y.-D. Huang, X.-F. Chen, Z. Wang, X. Ma, Q. Zhang, and J.-W. Pan, Physical Review A 95, 032306 (2017a).
- Sun et al. (2017b) Q.-C. Sun, Y.-F. Jiang, Y.-L. Mao, L.-X. You, W. Zhang, W.-J. Zhang, X. Jiang, T.-Y. Chen, H. Li, Y.-D. Huang, X.-F. Chen, Z. Wang, J. Fan, Q. Zhang, and J.-W. Pan, Optica 4, 1214 (2017b).
- Halder et al. (2007) M. Halder, A. Beveratos, N. Gisin, V. Scarani, C. Simon, and H. Zbinden, Nature Physics 3, 692 (2007).
- Osorio et al. (2013) C. I. Osorio, N. Sangouard, and R. T. Thew, Journal of Physics B: Atomic, Molecular and Optical Physics 46, 055501 (2013), 1211.0120 .
- Liu et al. (2020) J. Liu, G. Huang, R. N. Wang, J. He, A. S. Raja, T. Liu, N. J. Engelsen, and T. J. Kippenberg, arXiv preprint arXiv:2005.13949 (2020).
- Gyger et al. (2020) F. Gyger, J. Liu, F. Yang, J. He, A. S. Raja, R. N. Wang, S. A. Bhave, T. J. Kippenberg, and L. Thévenaz, Physical Review Letters 124, 013902 (2020).
- Brasch et al. (2014) V. Brasch, Q.-F. Chen, S. Schiller, and T. J. Kippenberg, Opt. Express 22, 30786 (2014).
- Kippenberg et al. (2018) T. J. Kippenberg, A. L. Gaeta, M. Lipson, and M. L. Gorodetsky, Science 361 (2018).
- Pfeiffer et al. (2016) M. H. P. Pfeiffer, A. Kordts, V. Brasch, M. Zervas, M. Geiselmann, J. D. Jost, and T. J. Kippenberg, Optica 3, 20 (2016), 1511.05716 .
- Hong et al. (1987) C. K. Hong, Z. Y. Ou, and L. Mandel, Physical Review Letters 59, 2044 (1987).
- Marcikic et al. (2004) I. Marcikic, H. de Riedmatten, W. Tittel, H. Zbinden, M. Legré, and N. Gisin, Phys. Rev. Lett. 93, 180502 (2004).
- Spring et al. (2017) J. B. Spring, P. L. Mennea, B. J. Metcalf, P. C. Humphreys, J. C. Gates, H. L. Rogers, C. Söller, B. J. Smith, W. S. Kolthammer, P. G. R. Smith, and I. A. Walmsley, Optica 4, 90 (2017), 1603.06984 .
- Zhang et al. (2016) X. Zhang, R. Jiang, B. Bell, D.-Y. Choi, C. Chae, and C. Xiong, Technologies 4, 25 (2016).
- Harada et al. (2011) K.-i. Harada, H. Takesue, H. Fukuda, T. Tsuchizawa, T. Watanabe, K. Yamada, Y. Tokura, and S.-i. Itabashi, New Journal of Physics 13, 065005 (2011).
- Sekatski et al. (2012) P. Sekatski, N. Sangouard, F. Bussières, C. Clausen, N. Gisin, and H. Zbinden, Journal of Physics B: Atomic, Molecular and Optical Physics 45, 124016 (2012), 1109.0194 .
- Helt et al. (2010) L. G. Helt, Z. Yang, M. Liscidini, and J. E. Sipe, Optics letters 35, 3006 (2010).
- Huang et al. (2010) Y.-P. Huang, J. B. Altepeter, and P. Kumar, Physical Review A 82, 043826 (2010), 1008.2792 .
- Tison et al. (2017) C. C. Tison, J. A. Steidle, M. L. Fanto, Z. Wang, N. A. Mogent, A. Rizzo, S. F. Preble, and P. M. Alsing, Optics Express 25, 33088 (2017), 1703.08368 .
- Vernon et al. (2016) Z. Vernon, M. Liscidini, and J. E. Sipe, Opt. Lett. 41, 788 (2016).
- Liu et al. (2018) J. Liu, A. S. Raja, M. H. P. Pfeiffer, C. Herkommer, H. Guo, M. Zervas, M. Geiselmann, and T. J. Kippenberg, Opt. Lett. 43, 3200 (2018).
- Bruno et al. (2014) N. Bruno, A. Martin, T. Guerreiro, B. Sanguinetti, and R. T. Thew, Optics express 22, 17246 (2014), 1403.6740 .
- Clausen et al. (2014) C. Clausen, F. BussiÚres, A. Tiranov, H. Herrmann, C. Silberhorn, W. Sohler, M. Afzelius, and N. Gisin, New Journal of Physics 16, 093058 (2014), 1405.6486 .
- Franson (1989) J. D. Franson, Physical Review Letters 62, 2205 (1989).
- Zielnicki et al. (2018) K. Zielnicki, K. Garay-Palmett, D. Cruz-Delgado, H. Cruz-Ramirez, M. F. O’Boyle, B. Fang, V. O. Lorenz, A. B. U’Ren, and P. G. Kwiat, Journal of Modern Optics 65, 1141 (2018), 1801.01195 .
- Luo et al. (2015) K.-H. Luo, H. Herrmann, S. Krapick, B. Brecht, R. Ricken, V. Quiring, H. Suche, W. Sohler, and C. Silberhorn, New Journal of Physics 17, 073039 (2015).
- Luo et al. (2017) K.-H. Luo, H. Herrmann, and C. Silberhorn, Quantum Science and Technology 2, 024002 (2017).