![[Uncaptioned image]](/html/2011.08134/assets/x2.png)
![]()
|
|
A high throughput search of efficient thermoelectric half-Heusler compounds† |
| Parul R. Raghuvanshia, Suman Mondala, and Amrita Bhattacharya∗a | |
|
|
Half-Heusler compounds have emerged as promising thermoelectric materials that offer huge compositional space to tune their thermoelectric performance. A class of stable half Heusler compounds formed from elements of three specific groups in the periodic table viz. XpXYqYZrZ (with X, X′= Ti, Zr, Hf, Y, Y′ = Ni, Pd, Pt and Z, Z′ = Ge, Sn, Pb and p, q, r = 0, 0.25, 0.75 and 1) via various stoichimetric isoelectronic elemental substitution at the X, Y and Z sites respectively is investigated. Intelligent filters are employed at each step of our high throughput density functional theory calculations to filter compounds with improved figure of merit. While confirming several known results, the calculations also reveal unknown pathways to improve the thermoelectric performance of the compound class. The 50% X as well as Z site substitution of the parent Heusler individually are found to marginally enhance the power factor for both the - and -type doping, while leading to considerable enhancement in the figure of merit (by 24 %) specifically due to lowering of the lattice thermal conductivity because of increase in lattice disorder in approximately the same cell volume. Furthermore, the present study confirms the experimental scenario that Y site substitution does not lead to enhancement of the powerfactor because of the breaking of band degeneracies at the high symmetry points. This work will serve as a consolidated cost effective guideline for experimentalist working with this compound class on enhancing the powerfactor and figure of merit of the compositions. |
1 Introduction
One of the promising alternative to meet the ever increasing energy demands of the modern world is the large scale deployment of energy efficient thermoelectric devices, which can convert a temperature gradient into an electric voltage 1, 2, 3. However, the main challenge in this development lies with the low efficiency of the thermoelectric materials, which inturn depends on the dimensionless figure of merit of the material 4. of a material at a given operating temperature depends on the instrinsic parameters i.e. the Seebeck , the electrical conductivity , and the total thermal conductivity via the expression 5, 6. The numerator is collectively known as power factor (), which is contributed by the electronic transport coefficients, whereas, the denominator is the sum of the heat generated by transportation of: (a) charge carriers (i.e. electron and hole) comprising the electronic thermal conductivity () and (b) phonons travelling between the lattices comprising the lattice thermal conductivity (). Naturally, the main strategies that are generally employed to optimize the either involve maximizing the power factor in the numerator or mininmizing the in the denominator (which may be indepedently tuned with respect to the electronic transport coefficients in many materials) or both 7, 8, 9, 10, 11. The electronic transport coefficients can be tuned by band engineering viz. by tuning the degeneracy of the valence/ conduction band valleys, the effective mass of the carriers, the scattering lifetimes and carrier concentration 12, 13, 14, 15, 16, 17. The on the other hand can be reduced by shortening the phonon mean-free-path, which can be achieved by introducing mass disorder in the lattice 18, 19. Thus, analysis of the electronic structure via substitution or doping has often been found to provide critical insights and in recent years, band engineering via first principles calculations has proven to be a cost effective and efficient way for tuning these parameters prior to their synthesis in the laboratory 20. High throughput calculations of large number of compounds have been recently carried out to screen the ones with desirable properties for their thermoelectric applications 21, 22, 23.
Half Heuslers (HH) are intermetallic ternary compounds (with formula unit XYZ), where X and Y are transition or rare earth metal, while Z is a p-block element. They comprise one of the most promising, earth abundant and environment friendly class of thermoelectric material offering a huge chemical space to tune the transport coefficients 24, 25, 26, 27, 28. X and Y atoms are distinct in cationic character, whereas Z is an anionic counterpart. They crystallize in a noncentrosymmetric lattice (space group F3m), which has four symmetry unique positions for accommodating the atoms; X (0, 0, 0), Z (1/2, 1/2, 1/2), Y (1/4, 1/4, 1/4), and a vacant fourth position (3/4, 3/4, 3/4) . If the fourth vacant position is also occupied by Y, the full Heusler (FH) alloy with the general formula XY2Z (space group Fmm) is formed . HH may be semiconducting or metallic depending upon the total valency of the elements in the compound. HH compounds, which have 8 (I-I-VI, I-II-V, I-III-IV, II-II-IV, and II-III-III) and 18 (XI-I-VI, XI-II-V, XI-III-IV, I-XII-V, II-XII-IV, III-XII-III, X-II-VI, X-III-V, and X-IV-IV), generally show semiconducting nature with narrow band gap 29, 30, 31, 32, 33, 34.
Naturally, many different chemical substitutions as well as dopings have been tried in the past leading to the increase in the 35, 36, 37, 38 upto 1.5, which is so far the highest reported value in this class 8, 38, 39. Hohl and coworkers 40 explained the effect of various sites substitution and doping on the of these half Heulser. They showed that X site substitution improves the power factor in Ti0.5Hf0.5NiSn by 1.18 times as compared to pristine HfNiSn (which has a power factor of 1.7 WK-2cm-1). They also reported that doping by Nb at the X site, further improves the power factor to 13 times by containing 1% Nb composition. Later, Sakurada and Shutoh 41 also showed the improvement of due to the combined effect of high power factor and low thermal conductivity by the X and Z site substitutions and obtained of 1.3 at 700 K for (Zr0.5Hf0.5)0.5Ti0.5NiSn and 1.5 for further Sn doped (Zr0.5Hf0.5)0.5Ti0.5NiSn0.998Sb0.002 at the same temperature. Zhang et. al. 42 used first principle calculations to explain the reasons behind the increase in the Seebeck coefficient for X site substitution and power factor improvement due to Z site co-doping. Zou et al. and other independent groups investigated the maximum power factor and corresponding optimal carrier concentration due to 50% Hf substitution at Zr site 43, 44 using first principle methods and suggested guidelines for tuning the doping levels and composition to enhance the thermoelectric performance 45, 46, 47, 48. Each of these studies provides some critical explanation towards the step by step realization of high HH thermoelectrics and reveals the huge potential of this compound class. While the vast majority of earlier reported studies have focussed on analysing the effect of tuning the power factor, the main challenge in implementation of half Heusler compounds as thermoelectric arises from their large value of , inspite of their tunable narrow band gap and high power factor. Hence, it is supremely important to explore the scope of reducing the via introducing mass disorder, without compromising on the vital parameters in the electronic structure leading to its high power factor 49, 50, 51. If such compounds can be identified they may act as the perfect basis for chemical doping for tuning the carrier concentration and hence, improving the .
In this article, the effect of compositional variation via isoelectronic substitution is studied on the stability, electronic and transport properties of semiconducting XpXYqYZrZ (X, X′= Ti, Zr, Hf; Y, Y′ = Ni, Pd, Pt and Z, Z′ = Ge, Sn, Pb) HH compositions is explored, where , , and are the different concentrations of elemental isoelectronic substitution at the X, Y and Z sites respectively. The purpose of this work is to identify compound(s) that satisfy the simultaneous requisite criteria of high power factor and low thermal conductivity, so that it may act as a semiconducting basis for further chemical doping.
2 Computational Details
High throughput density functional theory (DFT) 52, 53 calculations are performed using the Vienna Ab-initio Simulation Program (VASP) 54, 55, which is a plane wave-based electronic structure code with Projector Augmented Wave (PAW) and Perdew-Burke-Ernzerhof (PBE) 56 formulation of the exchange-correlation energy functional under a Generalized Gradient Approximation (GGA). Plane-Wave cutoff energy of 500 eV and an energy convergence criterion of 10-3 eV are used. For static calculations, a coverged Monkhorst-Pack k-mesh grid is applied for the unit cell. For each structure, ionic as well as geometric relaxations are performed.
In order to examine the stability of the compositions, the formation energy of the compounds is calculated as;
| (1) |
where, is the total energy of the compound and , , and are the total energy of the bulk phases of X, Y, and Z with , and numbers of atoms respectively.
The electronic transport coefficients i.e. the thermopower () and electronic conductivity () are calculated from the semi-classical Boltzmann theory 57 as implemented in the BoltzTraP package 58 where, scattering is treated perturbatively (but not self-consistently) on top of the rigid band and constant relaxation time approximation. Accordingly, even the thermal renormalization of the electronic structure, i.e., the temperature dependent change of the electronic band structure due to the electron-phonon coupling, is typically neglected in these approaches 59. However, this pretty brute simplification implies huge savings in the computational effort and thus enables large-scale, high-throughput calculations. Fully optimized crystal structures are considered for the transport calculations, whereby a dense Monkhorst-Pack K-mesh is used for obtaining the energy eigen values.
The phonon band structure is calculated using the finite displacement method as implemented in the phonopy 60 code. Converged supercell of 222 is used to calculate the phonon band structure. The amplitude of the displacements is fixed to 0.01 Å, and the forces are converged to the accuracy of 10-8eV/Å. The phonon group velocity (), mode resolved phonon group velocity (), Grneisen parameter (), and mode resolved Grneisen parameter () are extracted from the harmonic phonon band dispersion using python based extensions to phonopy-VASP. For calculating the and , the lattice is subjected to strains of 2 %. Finally, we use the Asen-Palmer modified version of the Debye Callaway theory 61 parameterized for solids 62, 63, 64, 65, 66, 11 to calculate of the compounds.
3 Result and Discussions
3.1 Compositional space
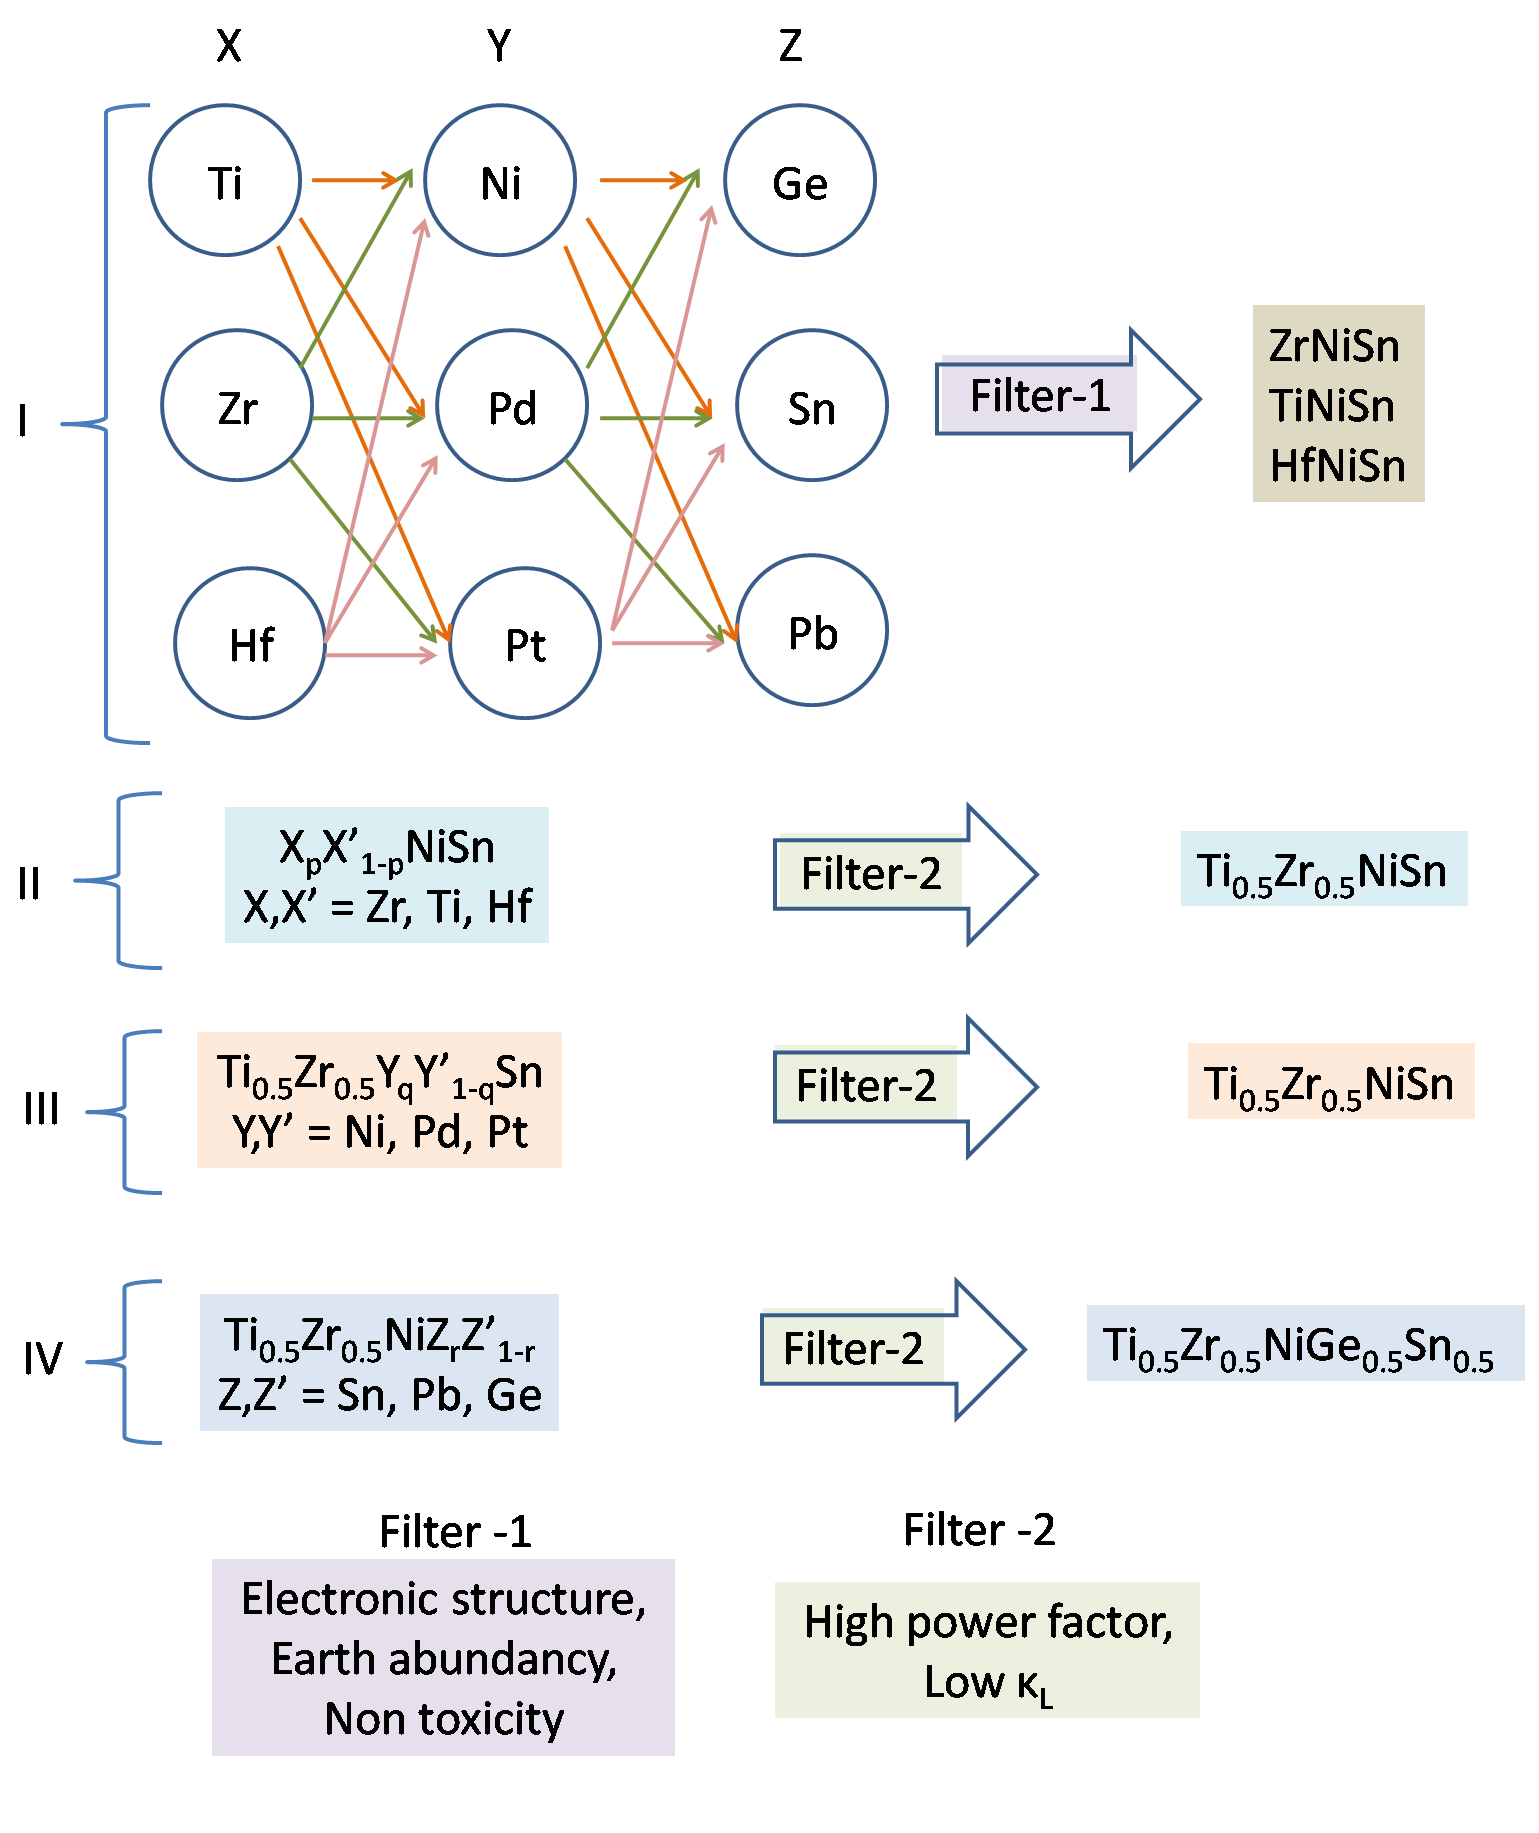
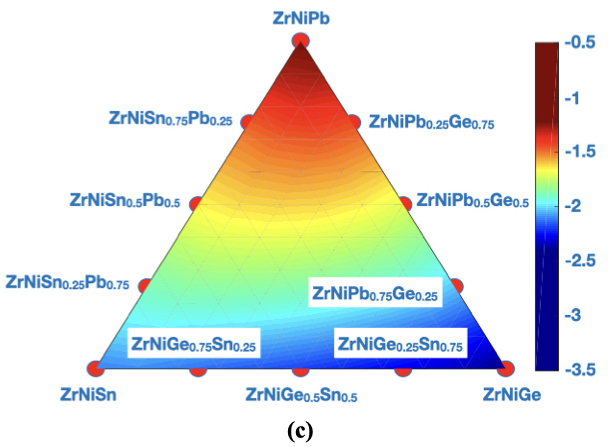
The compositional space attempted in this work is enormous i.e. XpXYqYZrZ (where X, X′= Ti, Zr, Hf; Y, Y′ = Ni, Pd, Pt and Z, Z′ = Ge, Sn, Pb and , , and = 0, 0.25, 0.5, 0.75, 1). In order to reduce the number of compositions judicially without elimininating the vital ones, an intelligent screening policy is adopted. As the first step, the electronic structure of all the 27 parent compounds (i.e. those with one element occupying one site to attain the formula XYZ with X = Ti, Zr, Hf; Y = Ni, Pd, Pt, and Z= Ge, Sn, Pb) is computationally evaluated. The computed band gap of the parent compounds show wide variation i.e. from 0.35 to 1.12 eV (see supplimentary information for details). The compounds are preliminarily screened on the basis of their electronic band gap and number of valley degeneracy at the conduction band minimum (CBm) and valence band maximum (VBM), non toxicity and earth abundancy of the elemental constituents (as discussed in details in section 3.4.1). After careful evaluation of the band structure ZrNiSn, TiNiSn and HfNiSn are selected with earth abundant and non toxic Ni and Sn occupying the Y and Z sites. The different stoichiometries (with varying ) for the composition XpXNiSn, with X, X′= Ti, Zr, Hf, is considered as the second step (as discussed in details in section 3.4.2). Once the stoichiometry and the composition for the X site substitution are identified on the basis of their high power factor and low lattice thermal conductivity, they are kept fixed for the subsequent Y site substitution. Thus, for the Y site substitution, the stoichiometry and the composition at the Y site is varried, but the previously identified compositions at the X site and the elemental composition at Z site is kept unchanged (as discussed in section 3.4.3 and 3.4.4). Finally, the same procedure is carried out for the Z site substitution, retaining the composition and stoichiometry for the X and Y site. The entire worflow is depicted schematically in Fig. 1, while the results are discussed in the suceeding sections.
3.2 Structure and stoichiometry
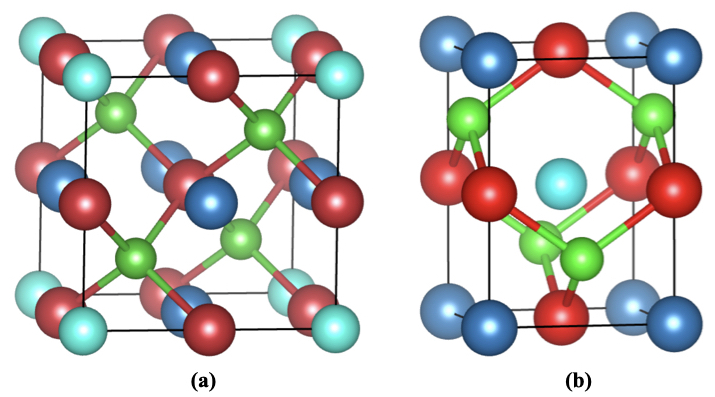
For the sake of computational brevity, substitutions have been restricted to achieve three different stoichiometries apart from the parental compositions, viz. to achieve the compositions XpXYqYZrZ. The primitive cell (space group 216, ) is considered for calculating the electronic structure and transport coefficients of the parental HH compositions (with lattice parameter ranging from 4.0 - 4.5 Ådepending upon the variation in the compositional space). The conventional cubic lattice of XYZ (space group ) has 12 atoms (i.e. 4 X, 4 Y and 4 Z atoms) in the lattice (with the lattice parameter varying from 5.9 - 6.4 Å). This particular lattice (i.e. 4 X, 4 Y, and 4 Z atoms per f.u) is used as the base structure to identify the ground state structure for the substitutions at different X, Y and Z site substituted cases, via an iterative scanning strategy. It is to be noted that such substitutions do not break the symmetry of the conventional cubic structure (cf. Fig. 2(a)). However, for , the primitive cell is found to have a tetragonal geometry with elongated c axis and half the number of atoms (i.e. six) as in the conventional cell (space group number 115, as shown in Fig. 2(b)). As for example, the elongated c axis (6.06 Å) of 50% substituted compound Ti0.5Zr0.5NiSn (tetragonal primitive cell) is found to lie between the lattice constant of ZrNiSn (6.1 Å) and TiNiSn (5.9 Å), which is in confirmation with Vegard’s law67, 44.
3.3 Stability analysis
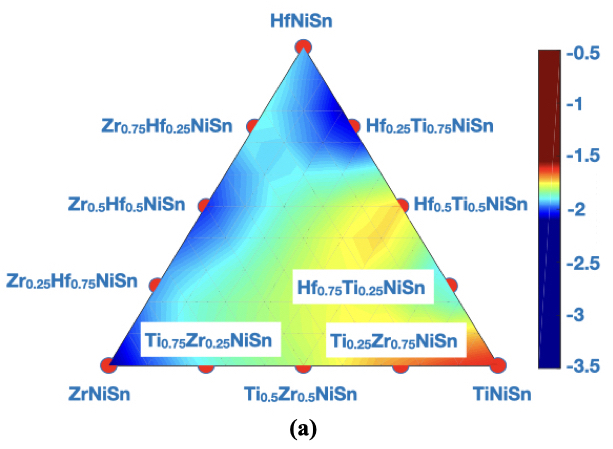
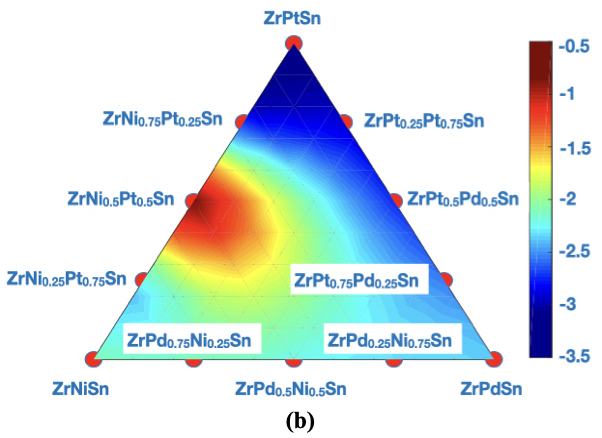
The formation energy () of the compositions is calculated for all pristine compounds and their substituted counterparts using eqn. 1. The formation energy of the 50% substituted compounds were found to be generally in between the formation energy of their pristine parents with only one exception of the Y site substitution with ZrNi0.5Pt0.5Sn, whereby the formation energy of the substituted compound is found to lower than both its parent counterpart. However, all the half-Heusler parent and the substituted compounds for the above mentioned compositions and stoichiometries are found to have negative formation energy, as shown in Fig. 3, which indicates that all these structures can be realised in the laboratory. Furthermore, the formation energy of the parents and the 50 % substituted ones are also verfied to be negative by taking into account of the thermodynamic free energy of the corresonding structures at 300 K, which has been provided in the section S1 of the supplementary information.
3.4 Electronic structure analysis
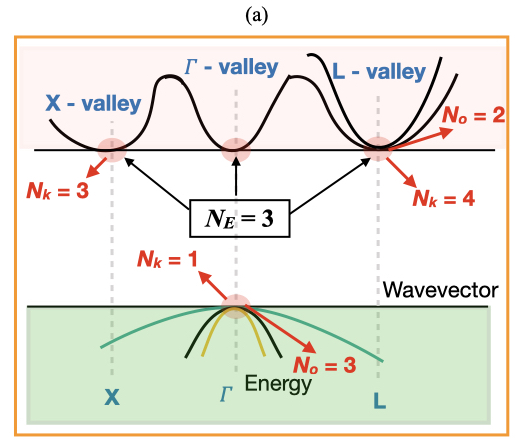
The electronic band structure (eBS) of the compounds may be analysed in terms of the several factors as has been enumerated below (as demonstrated in the schematics of Fig. 4(a));
-
•
Orbital degeneracy, No, which is the number of bands converging at the VBM or CBm at the same K point).
-
•
K point degeneracy, Nk, which is the degeneracy of equivalent valleys due to the high symmetry point in the Brillouin zone (i.e. Nk = 1 for point and NK = 3 for the point).
-
•
Valley/tip degeneracy NE, which is the number of tips lying at the same energy level for all different K points.
-
•
Band/total degeneracy, Nv, which is derived from all these degeneracies collectively for a given high symmetry point.
Using these notations, the eBS of the parent as well as the substituted compounds are analysed in the following.
3.4.1 Parent half Heusler compounds
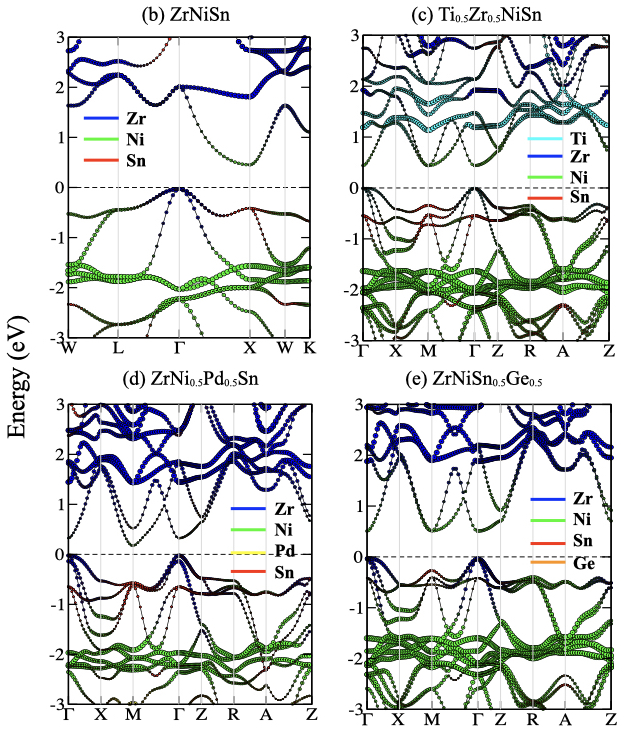
The primitive cell of the XYZ parent compounds, containing three atoms (one of each species) per unit cell, is considered for performing the eBS calculation. The eBS is plotted along high symmetry path W-L--X-W-K of the irreducible first Brillouin zone (as shown in Fig. 4 (b)). All the parent compounds show similar trends in terms of band degeneracies. For instance, the VBM at point () has three fold orbital degeneracy () leading to the band degeneracy of , while the CBm has a single valley at the X point () leading the band degeneracy to ). All the selected parent compounds (i.e. TiNiSn, ZrNiSn, HfNiSn, ZrPdSn, ZrPtSn, ZrNiGe, ZrNiPb) are found to be indirect semiconductor, with their band gap varying in the range of 0.35 - 1.0 eV. Although majority of the bandgap values show fair agreements with other theoretical reports 68, 69, 70, which are approximately 0.3 eV higher than the corresponding experimental results (0.12, 0.19 and 0.22 eV for TiNiSn, ZrNiSn, and HfNiSn, respectively) 29, 71, 72. This trend is anomalous to this specific class of compound, since DFT in the GGA level generally underestimates the band gap of semiconductors. The reason for this inconsistency has been attributed to the presence of structural imperfections, such as defects, boundaries etc in the experimental samples.
The effect of spin orbit coupling (soc) on the eBS is also explored for these compounds, which is however, found to have very minor effect (see supplimentary information for details). Thus, as revealed from the preliminary band structure analysis, no particular parent XYZ compound is found to be superior or inferior to the other as per as its thermoelectric application is concerned, since they all have narrow band gap with same features in the eBS. Therefore, for the X site substitution, all the three elements viz. Ti, Zr, and Hf are selected for isoelectronic substitution, while the elemental composition for Y (=Ni) and Z (=Sn) site is kept fixed keeping the non toxicity and earth abundancy in account. It is to be noted here that the selected compositions viz. TiNiSn, ZrNiSn and HfNiSn are also the most studied n-type Heusler compounds. Thus, the compositions with XpXNiSn, with X, X′= Ti, Zr, Hf, are explored for the X site substitutions as discussed in the succeeding section.
3.4.2 X site substitution
The eBS of XpXNiSn compositions with X, X′= Ti, Zr, Hf is analysed for different stoichiometries viz. . As discussed earlier, the symmetry of the structure of all compositions with and i.e. X0.25XNiSn and X0.75XNiSn is found to be identical to the conventional parent lattice. The corresponding band structure of the representative compounds is included in the supplimentary information. These substitutions result in a direct band gap semiconductor, with the CBm lying above the VBM at the point. The case, on the other hand, has increased number of valley and band degeneracies as compared to the parent as well as the substituted ones with stoichiometries for all compositional variation. As has been discussed in details in the supporting information, the electronic transport properties of the case is only marginally higher than those of . However, major favorable variation in is expected for as compared to empirically as is also verfied by our DFT results (as explained in details in the section S5.1 of the supporting information). Thus, the eBS of the is analysed hereby in details.
For , all compositions are found to have a direct band gap at the point in the range of 0.40 - 0.45 eV, with another energy degenerate band pocket forming at the M point, where two bands merge (see Fig. 4(c)). The energy eigenvalues of bands and sub bands of substituted compounds corresponding to the electronic band structure (Fig. 4(c)) are tabulated in table. S2 and S3 of the supplementary information. As it can be seen that the energy eigenvalues of sub-bands at M points of Ti0.5Zr0.5NiSn are same, whereas energy difference between degenerate bands (conduction band edges, CBE) M and is very small i.e., 0.002 eV. Whereas, the VBM retains three fold orbital degeneracy at the point. This means that both the CBEs simultaneously participate in transport and may improve the thermoelectric performance of the compound. Therefore, it may be undoubtedly inferred that all the X0.5XNiSn compositions will serve as excellent basis for further -type or -type doping. However, in order to select one best composition Ti0.5Zr0.5NiSn is chosen, because of the earth abundance of Ti over Hf. The of all the X site substituted compounds are also compared eventually, which revealed that this choice has comparable with the other X site substituted compositions.
3.4.3 Y site substitution
For the Y site substitution, the eBS of the compositions Ti0.5Zr0.5YqYSn for Y, Y′ = Ni, Pd, Pt is explored for . However, in order to highlight the adverse effect of Y site substitution alone, the eBS of the composition ZrNi0.5Pd0.5Sn (as shown in Fig. 4(d)), is presented and analysed as the representative case (while the other stoichiometries are included in the supplementary information in section S3.5). From this, several negative effects of Y site substitution in the eBS is identified, viz. the splitting of the orbital and valley degeneracy collectively leading to lowering in the band degeneracies drastically at the CBm and VBM. For instance, in ZrNi0.5Pd0.5Sn ( Fig. 4(d), the CBm is found at M point (), while the VBM at point (). An energy difference of 0.15 eV is observed between the CBm at the and M point, while energy difference of 0.35 eV is observed between the two conduction band sub-bands at the M point. Also, energy difference of 0.12 eV is observed between the hole bands at the -point of VBM (see supplementary information, see table S2 and S3). The lowering of the bands at the M point also results in reduction of band gap in all cases (in the range of 0.15 - 0.22 eV) and all compositions are found to be indirect semiconductor. Thus, it can be inferred that the Y site substitution in HH is not particularly advantageous for thermoelectric application. Moreover, the lowering of the band gap in these compositions may also give rise to adverse bipolar effects in the transport coefficients, due to which both charge carriers may cancel each other even at room temperature.
In order to explore the reason behind the splitting of the degenerate bands at the M point, which is observed uniquely only for the Y site substitution, the local symmetry around the substituted atom in the tetragonal structure is investigated. As for instance, the local symmetry surrounding the Pd atom at the center of the tetragonal ZrNi0.5Pd0.5Sn crystal is found to be broken because of the pesence of two different atoms as the first nearest neighbor (leading to different bond lengths arising from the Pd-Sn and the Pd-Zr). However, such a situation does not arise for X site or Z site substitution, where the substituted atom sitting at the center always has the same atom as its first nearest neighbor and for its second nearest neighbor. Therefore, the local symmetry is retained for the X site as well as the Z site substitution (see supplementary Fig. S11 and the discussion there in for more details).
Thus, the Ti0.5Zr0.5NiSn is still retained as the best starting composition for the Z site substitution, which is discussed in the subsequent section.
3.4.4 Z site substitution
For the Z site substitution, the eBS of the compositions Ti0.5Zr0.5NiZrZ for Z, Z′ = Ge, Sn, Sb is analysed for . However, in order to highlight the sole effect of Z site substitution, the eBS of the composition ZrNiGe0.5Sn0.5 (as shown in Fig. 4(e)), is also presented as the representative case (while the other stoichiometries are included in the supplementary information). For all compositions with , the Z site substitution, however, shows exactly the same trend as of X site substitution in terms of band and valley degeneracies, with band gap lying in range 0.54 - 0.60 eV. For instance, in Z site substituted ZrNiSn0.5Ge0.5 compound, same energy value is observed at sub bands of M point and a very small energy difference of 0.005 eV is observed between the two CBEs (M and point) (see supplementary information; table S2 and S3).
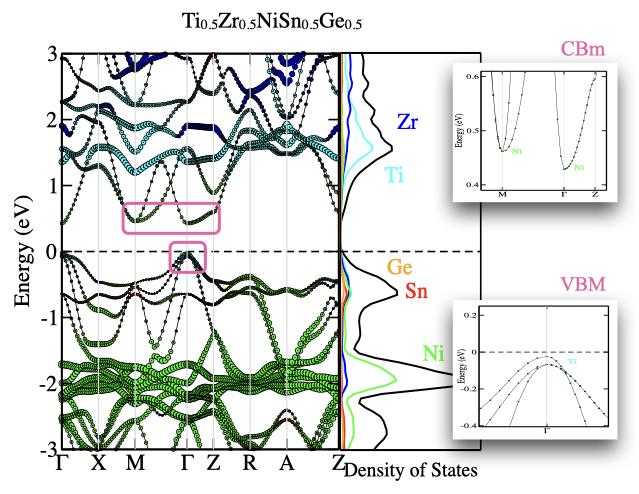
The eBS of Ti0.5Zr0.5NiGe0.5Sn0.5 is plotted in Fig. 5 as a representative case of co site doping. The orbital degeneracy at the M point () and valley degeneracy (), with energy difference of 0.03 eV between sub bands of the CBE is retained while one band in the VBM at the point undergo splitting ( eV) as shown in the insets of Fig. 5. This may lower the power factor in case of -type doping of the material. However, this does not affect the -type doping scenario. The co-site doping, however, provides the possibility of tuning the via introduction of mass disorder (see section 3.5 for further discussion).
Overall, the X, Z and X-Z co-site substitution lead to an increase in band degeneracy in the CBm, which offers additional band effective masses with corresponding band degeneracies () at the high symmetry points. High degeneracy within the degenerate energy window of transport can improve the Seebeck coefficient while retaining the high mobility by maintaining low scattering. All these effects may collectively enhance the power factor significantly. But in order to inspect the combined scenario, the transport properties of the representative cases are calculated using the semi classical Boltzmann transport equation.
| System | type | ||||||
|---|---|---|---|---|---|---|---|
| ZrNiSn | 0.35 | -141 | 0.25 | 4.90 | 0.50 | 0.35 | |
| -0.33 | 155 | 0.26 | 6.35 | 0.57 | 0.42 | ||
| X-site | 0.32 | -146 | 0.22 | 4.63 | 0.54 | 0.45 | |
| -0.30 | 162 | 0.25 | 6.46 | 0.61 | 0.52 | ||
| Y-site | 0.45 | -87 | 0.45 | 3.40 | 0.25 | 0.12 | |
| -0.27 | 139 | 0.26 | 4.98 | 0.48 | 0.20 | ||
| Z-site | 0.38 | -143 | 0.25 | 5.12 | 0.53 | 0.46 | |
| -0.36 | 156 | 0.26 | 6.41 | 0.59 | 0.52 | ||
| Co-site | 0.34 | -150 | 0.22 | 4.92 | 0.56 | 0.49 | |
| -0.33 | 157 | 0.24 | 5.94 | 0.59 | 0.53 |
3.5 Transport properties
3.5.1 Electronic transport properties
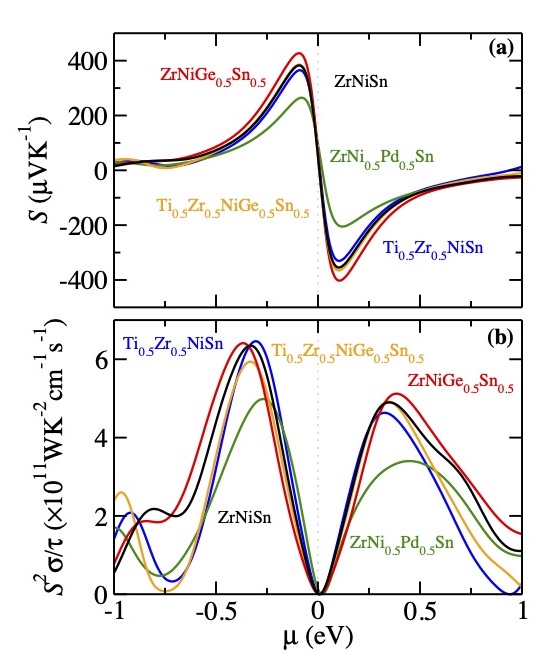
Finally, the transport properties of all the filtered compositions viz. X0.5XNiSn and X0.5XNiZ0.5Z for X, X′ = Ti, Zr, Hf and Z, Z′ = Ge, Sn are calculated. Few of the representative ones are hereby discussed. The Seebeck coefficient ()and power factor scaled by the relaxation time () are plotted as a function of chemical potential () of electrons and holes in Fig. 6 (a) and (b) respectively, while the maximum values attained and the corresponding chemical potential are given in table. 1. The positive and negative value of the chemical potential () indicate that the dopants are electrons (-type) and holes (-type), respectively. Please note that the scenario of the -type (positive ) as well as -type doping (negative ) can be inferred from the given plot itself. However, in reality in order to achieve such in laboratory, one has to dope the compound with small or -type impurities, which may introduce aditional disorder and effectively tune the transport coefficients as well. The and hence the for the X, Z and co site substituted compounds are found to be comparable with the parent composition. The shape of the lowest conduction band which is contributing to transport is almost the same for Ti0.5Zr0.5NiSn, ZrNiGe0.5Sn0.5 and Ti0.5Zr0.5NiGe0.5Sn0.5, resulting in similar effective masses (see table. 2). Because of many fold orbital and valley degeneracies, -type doping may yield higher power factor. Most importantly, the Z site substituted composition ZrNiGe0.5Sn0.5 is found to have the best power factor for both as well as -type doping, which was hitherto not explored experimentally for this particular stoichiometry. The reason for the high power factor of ZrNiGe0.5Sn0.5 is the higher curvature of all the degenerate bands (at CBm) as compared to the X-site substituted Ti0.5Zr0.5NiSn and co-site substituted Ti0.5Zr0.5NiGe0.5Sn0.5 as tabulated in table 2. Because of the decrease in band degeneracies for the Y site substitution, it results in lowest and as compared to all other substituted counterparts. Furthermore, the anisotropy in the transport coefficients is analysed for the 50 % subsituted compositions (with tetragonal geometry) and no strong anisotropy is observed in any of the reported compounds along different directions (see supplementary information SI. S5.1.1 for corresponding discussion).
| Dir. | Band Index | Effective mass | ||||
|---|---|---|---|---|---|---|
| ZrNiSn | X-site | Y-site | Z-site | co-site | ||
| VBM | 2.5 | |||||
| 0.9 | ||||||
| VBM-1 | 0.3 | |||||
| 0.4 | ||||||
| VBM | 1.1 | 0.5 | 0.6 | 1.4 | ||
| 0.5 | 0.8 | 0.8 | 0.5 | |||
| VBM-1 | 1.1 | 0.4 | 0.4 | 0.8 | ||
| 1.1 | 0.8 | 0.8 | 1.1 | |||
| VBM-2 | 0.5 | 0.8 | 0.5 | |||
| 1.1 | 0.4 | 1.1 | ||||
| X | CBm | 3.2 | ||||
| X | 0.4 | |||||
| 0.5 | 0.4 | 0.5 | ||||
| 3.3 | 6.9 | 5.1 | ||||
| M | 0.9 | 0.6 | 1.0 | 1.1 | ||
| M | 3.3 | 0.6 | 6.6 | 7.5 | ||
| M | CBm+1 | 0.7 | 0.6 | 0.8 | ||
| M | 0.4 | 0.4 | 0.5 | |||
3.5.2 Lattice thermal conductivity
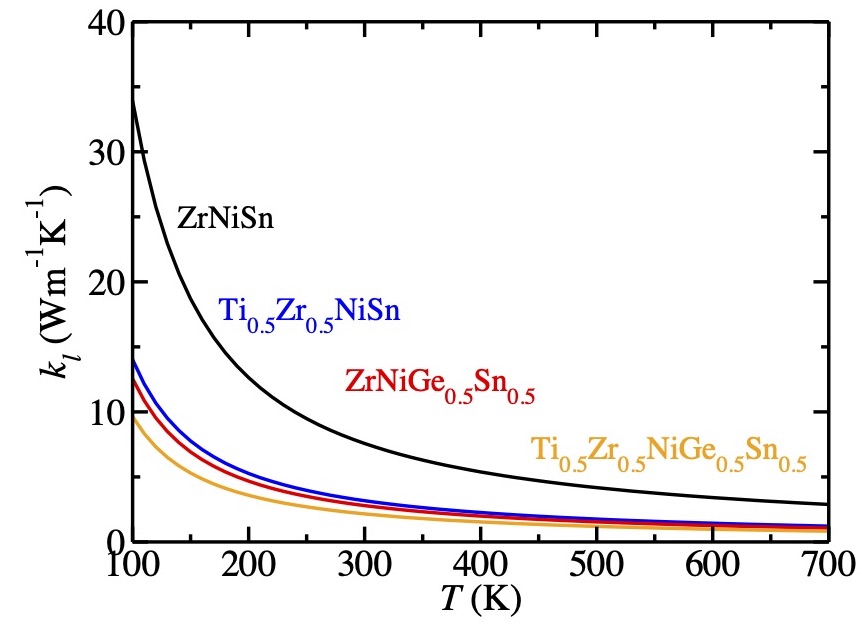
The Asen-Palmer modified version of the Debye Callaway theory parametrized for solid (see section S4 and S5 of supplementary information for details) is used to model the phonon lifetimes for the normal as well as the Umklapp scattering processes by including the contributions stemming from the transverse acoustic (TA and TA′) and the longitudinal acoustic (LA) phonon modes (from their respective mode group velocities (), Grneisen parameter () and Debye temperatures () for =TA, TA′, LA modes. The corresponding plots for the phonon spectrum, group velocity and Grneisen parameter is included as supplementary material. The corresponding lattice thermal conductivity (, for =TA, TA′, LA) is calculated from the corresponding values of the , , etc, which are given in table 3. The of the compounds with high power factors viz. the parent (ZrNiSn), X-site (Ti0.5Zr0.5NiSn), Z-site (ZrNiGe0.5Sn0.5) and co-site (Ti0.5Zr0.5NiGe0.5Sn0.5) substituted compounds are only presented for the sake of brevity (see Fig. 7 and table 3). The s and average group velocity of sound () are found to be similar for all the selected compounds. The average Debye temperature , is found to be the lowest for X site (Ti0.5Zr0.5NiSn) while the highest for the co-site (Ti0.5Zr0.5NiGe0.5Sn0.5) substituted case. It is to be noted that the integration for is limited by the s and hence lower s indicate lower . However, the s are found to be different for the compounds, which play the deterministic factor in the change observed in the . The s are found to be the lowest for ZrNiSn, comparable for Ti0.5Zr0.5NiSn and ZrNiGe0.5Sn0.5 while the highest for Ti0.5Zr0.5NiGe0.5Sn0.5, pertaining to the highest mass disorder in similar cell volume. The high anharmonicity, as indicated by the high s in Ti0.5Zr0.5NiGe0.5Sn0.5, is responsible for the increased scattering centers and hence, lowest in the compound. In summary, the of the substituted compounds is found to be significantly lower than the parent compound (by more than 60 %). However, in this formalism, the effect of defect phonon scattering is not incorporated explicitly, which arises from the mass and strain fluctuations stemming from the substitutions 61, 73. If explicitly taken into account it may still reduce the for the 50 % substituted ones as compared to the 25 % and 75 % substitutions at a given site (see supplimentary information SI S5.5 for corresponding discussion).
3.5.3 Figure of merit
The dimensionless figure of merit of a thermoelectric material () can be written as the sum of the electronic and lattice figure of merit ( = + ). is calculated from transport parameters obtained in BoltzTrap viz. S, , as . Whereas, is calculated as (where is choosen to be 10-14 s)), and is calculated using the Debye Callaway formalism as discussed before. The for X-, Y-, Z- and co-substituted ZrNiSn is also given in table. 1. Pertaining to its lowest power factor, the of the Y-site subsituted ZrNi0.5Pd0.5Sn is found to be the lowest, which show a reduction of 65 % (-type) and 52% (-type) in the as compared to the parent compound. The of X-site substituted Ti0.5Zr0.5NiSn and Z-site substituted ZrNiGe0.5Sn0.5 is found to comparable for both - as well as - type doping. This is found to be approximately 24 % (for -type) and 20 % (for -type) higher than the parent ZrNiSn, which stems from the low of the substituted compounds. Pertaining to its lowest , the co-site substituted Ti0.5Zr0.5NiGe0.5Sn0.5 shows comparable as X and Z site substituted compounds, inspite of comparatively lower power factor for the -type doping.
| System | Modes () | |||||||
|---|---|---|---|---|---|---|---|---|
| TA | 2.6 | 1.5 | 135 | |||||
| ZrNiSn | TA′ | 2.7 | 3.0 | 1.6 | 140 | 332 | 7.6 | |
| LA | 4.6 | 1.8 | 148 | |||||
| TA | 2.6 | 1.8 | 111 | |||||
| X-site | TA′ | 2.7 | 2.9 | 2.1 | 112 | 326 | 3.2 | |
| LA | 4.3 | 2.2 | 138 | |||||
| TA | 2.7 | 2.1 | 120 | |||||
| Z-site | TA′ | 2.7 | 3.0 | 2.1 | 121 | 339 | 2.8 | |
| LA | 4.4 | 2.2 | 146 | |||||
| TA | 2.7 | 2.2 | 120 | |||||
| Co-site | TA′ | 2.7 | 3.0 | 2.2 | 122 | 389 | 2.2 | |
| LA | 4.6 | 3.5 | 154 |
4 Conclusions
The structural, electronic and transport properties of 18 valence electron count based XpXYqYZrZ (where X, X′= Ti, Zr, Hf; Y, Y′ = Ni, Pd, Pt and Z, Z′ = Ge, Sn, Pb and , , and = 0, 0.25, 0.5, 0.75, 1) half-Heusler compounds is investigated using the high throughput first-principles density functional theory calculations. An intelligent scanning strategy is adapted. As the first step, the electronic structure of all the parent compounds is explored in terms of parameters such as the band degeneracy, valley degeneracy, band gap etc, which are generally the most important parameters for improving the power factor. The parent compounds viz. TiNiSn, ZrNiSn and HfNiSn are selected, whereby the Y and Z elements are kept fixed because of their non-toxicity and earth abundance. Subsequently, the elemental composition at the X site is varied as XpXNiSn with X, X′= Ti, Zr, Hf for different stoichiometries viz. . All the substituted compounds are found to have negative formation energy, which is calculated by the static energy calculations. From the band engineering perspective, all these combinations are found to have similar electronic structure as long as the stoichiometries are retained. However, the among the different stoichiometries, the X0.5XNiSn are found to have higher band and valley degeneracies, indicating improvement in power factor. Thus, Ti0.5Zr0.5NiSn is chosen as the representative case from the X site substituted compositions (because of the earth abundance of the elements) for proceeding to subsequent substitutions. As the next step, the electronic structure of the Y site substituted compositions viz. Ti0.5Zr0.5YqYSn for Y, Y′ = Ni, Pd, Pt is explored for . However, all the Y site substitutions led to breaking of the degeneracy of the bands and hence, are not found to be effective for improvising the electronic power factor of the compounds. Subsequently, the electronic structure of the Z site substituted compositions viz. Ti0.5Zr0.5NiZrZ for Z, Z′ = Ge, Sn, Sb with is explored. Our results reveal that the X site and Z site doping may be independently opted for improving the power factor, while the X and Z co-site doping may lead to lowering in power factor for the p-type material. As the last step, the lattice thermal conductivity of these representative compounds is calculated using the Asen Palmer modified version of Debye Callaway theory parameterized for solid. The substituted compounds are found to have reduced by atleast 60 %, which is due to the intoduction of mass disorder in the same lattice volume. Finally, the of X-site substituted Ti0.5Zr0.5NiSn and Z-site substituted ZrNiGe0.5Sn0.5 (being comparable for both - as well as - type doping) is found to be approximately 24 % (for -type) and 20 % (for -type) higher than the parent ZrNiSn, which stems from the low of the substituted compounds. However, the co-site substituted composition (Ti0.5Zr0.5NiGe0.5Sn0.5), is found to have comparable for both the - as well as - type doping, which is preferential for its device application.
In summary, DFT calculations are performed to explore the thermoelectric properties of the X, Y and Z substituted half Heusler compounds without restricting the compositions to any prior biases or conclusions from the previous literature. The calculations confirm several known facts as well as reveal several unknown ones. Exemplarily, the Y site substitution is generally avoided experimentally (if at all, there are only few reports of very minute doping at the Y site, which has improved the ). This study confirms the scenario and reveals the predicament behind such substitution. However, the Z site substitution, leads to enhancement of the powerfactor, which is comparable to the scenario of X site substitution. However, the Z site substitution has not been hitherto explored thoroughly, which may provide further scope in tuning the of these compounds. Thus, this study may serve as a consolidated blue print for experimentalist working with similar compositions for enhancing the powerfactor and of the compositions.
Acknowledgements
The authors thank Prof. Titas Dasgupta for many fruitful discussions. AB acknowledges the DST Inspire faculty project (DST/INSPIRE/04/2015/000089), IIT B seed grant project (RD/0517-IRCCSH0-043) and SERB ECRA project (ECR/2018/002356) for the financial assistance. The high performance computational facilities (viz. dendrite, spacetime, and corona) of IIT Bombay and of CDAC (Param Yuva-II) are acknowledged for providing the computation hours.
Notes and references
- DiSalvo 1999 F. J. DiSalvo, Science., 1999, 285, 703–706.
- Tritt 1999 T. M. Tritt, Science., 1999, 283, 804–805.
- Bell 2008 L. E. Bell, Science., 2008, 321, 1457–1461.
- Snyder and Toberer 2008 G. J. Snyder and E. S. Toberer, Nat. Mater., 2008, 7, 105–114.
- Liu et al. 2015 W. Liu, Q. Jie, H. S. Kim and Z. Ren, Acta Mater., 2015, 87, 357–376.
- Zhang et al. 2016 Q. H. Zhang, X. Y. Huang, S. Q. Bai, X. Shi, C. Uher and L. D. Chen, Adv. Eng. Mater., 2016, 18, 194–213.
- Kimura et al. 2009 Y. Kimura, H. Ueno and Y. Mishima, J. Electron. Mater., 2009, 38, 934–939.
- Fu et al. 2015 C. Fu, Y. Bai, Y. Liu, Y. Tang, L. Chen, X. Zhao and T. Zhu, Nat. Commun., 2015, 6, 8144.
- Holuj et al. 2015 P. Holuj, C. Euler, B. Balke, U. Kolb, G. Fiedler, M. M. MCuller, T. Jaeger, E. C. Angel, P. Kratzer and G. Jakob, Phys. Rev. B, 2015, 92, 8125436.
- Zhu et al. 2017 T. Zhu, Y. Liu, C. Fu, J. P. Heremans, G. J. Snyder and . . X. Zhao, Adv. Mater 29, Adv. Mater., 2017, 29, 1605884.
- Bhattacharya 2020 A. Bhattacharya, J Phys. Condens. Matter, 2020, 32, 17.
- Goldsmid 1964 H. Goldsmid, Thermoelectric Refrigeration, Springer US, New York, 1964.
- Snyder et al. 2000 G. J. Snyder, T. Caillat and J. Fleurial, Phys. Rev. B, 2000, 62, 10185–10193.
- Yan et al. 2012 X. Yan, W. Liu, H. Wang, S. Chen, J. Shiomi, K. Esfarjani, H. Wang, D. Wang, G. Chen and Z. Ren, Energy Environ. Sci., 2012, 5, 7543–7548.
- Pei et al. 2012 Y. Pei, A. Lalonde, H. Wang and G. J. Snyder, Energ. Environ. Sci., 2012, 5, 7963–7969.
- Xie et al. 2013 H. H. Xie, H. Wang, Y. Pei, C. Fu, X. Liu, G. J. Snyder, X. Zhao and T. Zhu, Adv. Funct. Mater., 2013, 23, 5123–5130.
- Chauhan et al. 2020 N. S. Chauhan, P. R. Raghuvanshi, K. Tyagi, K. K. Johari, L. Tyagi, B. Gahtori, S. Bathula, A. Bhattacharya, S. D. Mahanti, V. N. Singh, Y. V. Kolenko and A. Dhar, J. Phys. Chem. C., 2020, 16, 8584–8593.
- Toberer et al. 2012 E. S. Toberer, L. L. Baranowski and C. Dames, Annu. Rev. Mater. Res.., 2012, 42, 179–209.
- loffe and loffe 1960 A. V. loffe and A. F. loffe, Sov. Phys. Solid State, 1960, 2, 719–728.
- Bhattacharya and Madsen 2016 S. Bhattacharya and G. K. H. Madsen, J. Mater. Chem. C, 2016, 4, 11261.
- Carrete et al. 2014 J. Carrete, N. Mingo, S. Wang and S. Curtarolo, Adv. Funct. Mater., 2014, 24, 7427–7432.
- Carrete et al. 2014 J. Carrete, W. Li, N. Mingo, S. Wang and S. Curtarolo, Phys. Rev. X., 2014, 4, 011019.
- Guo et al. 2019 S. Guo, T. Jia and Y. Zhang, J. Phys. Chem. C., 2019, 123, 18824–18833.
- Yang et al. 2008 J. Yang, H. Li, T. Wu, W. Zhang, L. Chen and J. Yang, Adv. Funct. Mater., 2008, 18, 2880–2888.
- Xie et al. 2012 W. Xie, A. Weidenkaff, Z. Tang, Q. Zhang, J. Poon and T. M. Tritt, Nanomaterials, 2012, 2, 379–412.
- Chen and Ren 2013 S. Chen and Z. Ren, Mater. Today, 2013, 16, 387–395.
- Zhu et al. 2015 T. Zhu, C. Fu, H. Xie, Y. Liu and X. Zhao, Adv. Energy Mater., 2015, 5, 1500588.
- Zeier et al. 2016 W. G. Zeier, J. Schmitt, G. Hautier, U. Aydemir, Z. M. Gibbs, C. Felser and G. J. Snyder, Nature Rev. Mater., 2016, 1, 16032.
- Aliev et al. 1989 G. Aliev, V. V. Moshchalkov, V. V. Kozyrkov, R. V. Skolozdra and A. I. Belogorokhov, Z. Phys. B: Condens. Matter, 1989, 75, 167.
- Aliev et al. 1990 G. Aliev, V. V. Kozyrkov, V. V. Moshchalkov, R. V. Skolozdra and K. Durczewski, Z. Phys. B: Condens. Matter, 1990, 80, 353.
- Pierre et al. 1997 J. Pierre, R. V. Skolozdra, J. Tobola, S. Kaprzyk, C. Hordequin, M. A. Kouacou, I. Karla, R. Currat and E. Leli‘evre-Berna, J Alloy Compd., 1997, 262-263, 101–107.
- Larson et al. 1999 P. Larson, S. D. Mahanti, S. Sportouch and M. G. Kanatzidis, Phys. Rev. B, 1999, 59, 15660.
- Ciftci and Mahanti 2016 Y. O. Ciftci and S. D. Mahanti, J. (A)ppl. Phys., 2016, 119, 145703.
- Zhu et al. 2019 H. Zhu, Y. L. J. Mao, and, J. Sun, Y. Wang, Q. Zhu, G. Li, Q. Song, J. Zhou, Y. Fu, R. He, T. Tong, Z. Liu, W. Ren, L. You, Z. Wang, J. Luo, A. Sotnikov, J. Bao, K. Nielsch, G. Chen, D. J. Singh and Z. Ren, Nat. Commun., 2019, 10, 270.
- Ogut and Rabe 1995 S. Ogut and K. M. Rabe, Phys. Rev. B, 1995, 51, 10443.
- Joshi et al. 2011 G. Joshi, X. Yan, H. Wang, W. Liu, G. Chen and Z. Ren, Adv. Energy Mater., 2011, 1, 643.
- Xie et al. 2014 H. Xie, H. Wang, C. Fu, Y. Liu, G. J. Snyder, X. Zhao and T. Zhu, Sci. Rep., 2014, 4, 6888.
- Rogl et al. 2017 G. Rogl, P. Sauerschnig, Z. Rykavets, V. Romaka, P. Heinrich, B. Hinterleitner, A. Grytsiv, E. Bauer and P. Rogl, Acta Mater., 2017, 131, 336–348.
- Poon 2018 S. J. Poon, Metals., 2018, 8, 989.
- Hohl et al. 1999 H. Hohl, A. P. Ramirez, C. Goldmann, E. Gabriele, W. Bernd and E. Bucher, J. Phys. Condens. Matter, 1999, 11, 1697–1709.
- Sakurada and Shutoh 2005 S. Sakurada and N. Shutoh, Appl. Phys. Lett., 2005, 86, 082105.
- Zhang et al. 2017 J. Zhang, X. Zhang and Y. Wang, Sci. Rep., 2017, 7, 14590.
- Yang et al. 2002 J. Yang, D. T. Morelli, G. P. Meisner, W. Chen, J. S. Dyck and C. Uher, Phys. Rev. B, 2002, 24, 094115.
- Zou et al. 2013 D. Zou, S. H. Xie and Y. Liu, J. Appl. Phys., 2013, 113, 193705.
- Chaput et al. 2006 L. Chaput, J. Tobola, P. Pecheur, L. G. Lin and H. Scherrer, Phys. Rev. B, 2006, 73, 045121.
- Downie et al. 2014 R. A. Downie, D. A. MacLaren and J. W. G. Bos, J. Mater. Chem. A, 2014, 2, 6107.
- Downie et al. 2015 R. A. Downie, S. A. Barczak, R. I. Smith and J. W. G. Bos, J. Mater. Chem. A, 2015, 3, 10534.
- Rogl et al. 2019 G. Rogl, K. Yubuta, V. V. Romaka, H. Michor, E. Schafler, A. Grytsiv, E. Bauer and P. Rogl, Acta Materialia, 2019, 166, 466–483.
- Liu et al. 2015 Y. Liu, H. Xie, C. Fu, G. J. Snyder, X. Zhao and T. Zhu, J. Mater. Chem. A, 2015, 3, 22716–22722.
- Chauhan et al. 2019 N. S. Chauhan, S. Bathula, B. Gahtori, S. D. Mahanti, A. Bhattacharya, A. Vishwakarma, R. Bhardwaj, V. N. Singh and A. Dhar, ACS Applied Materials & Interfaces, 2019, 11, 47830–47836.
- Anand et al. 2019 S. Anand, M. Wood, Y. Xia, C. Wolverton and G. J. Snyder, Joule, 2019, 3, 1226–1238.
- Hohenberg and Kohn 1964 P. Hohenberg and W. Kohn, Phys. Rev., 1964, 136, B864.
- Kohn and Sham 1965 W. Kohn and L. J. Sham, Phys. Rev., 1965, 140, A1133.
- Hafner and Kresse 1994 J. Hafner and G. Kresse, Phys. Rev. B, 1994, 49, 14251.
- Hafner and Kresse 1997 J. Hafner and G. Kresse, The Vienna AB-Initio Simulation Program VASP: An Efficient and Versatile Tool for Studying the Structural, Dynamic, and Electronic Properties of Materials, Springer US, New York, 1997.
- Perdew et al. 1996 J. P. Perdew, K. Burke and M. Ernzerhof, Phys. Rev. Lett., 1996, 77, 3865.
- Ziman 1960 J. Ziman, Electrons and Phonons: The Theory of Transport Phenomena in Solids, Oxford University Press, Oxford, 1960.
- Madsen and Singh 2006 G. K. H. Madsen and D. J. Singh, Comput. Phys. Commun., 2006, 175, 67–71.
- Samsonidze and Kozinsky 2018 G. Samsonidze and B. Kozinsky, Adv. Energy Mater., 2018, 8, 1800246.
- Togo and Tanaka 2015 A. Togo and I. Tanaka, Scr. Mater., 2015, 108, 1–5.
- Callaway 1959 J. Callaway, Phys. Rev., 1959, 113, 1046.
- Asen-Palmer et al. 1997 M. Asen-Palmer, K. Bartkowsk, E. Gmelin, M. Cardona, A. P. Zhernov, A. V. Inyushkin, A. Taldenkov, V. I. Ozhogin, K. M. Itoh and E. E. Haller, Phys. Rev. B, 1997, 56, 9431.
- Zhang et al. 2012 Y. Zhang, E. Skoug, J. Cain, V. Ozolin, D. Morelli and C. Wolverton, Phys. Rev. B, 2012, 85, 054306.
- Chauhan et al. 2015 N. S. Chauhan, B. Gahtori, B. Sivaiah, M. D. Mahanti, A. Dhar and A. Bhattacharya, Appl. Phys. Lett., 2015, 113, 013902.
- Bhattacharya et al. 2018 A. Bhattacharya, P. R. Raghuvanshi and G. P. Das, J. Phys. Condens. Matter, 2018, 30, 355003.
- Bhattacharya 2019 A. Bhattacharya, J. Mater. Chem. C, 2019, 7, 13986–13992.
- Denton and Ashcroft 1991 A. R. Denton and N. W. Ashcroft, Phys. Rev. A., 1991, 43, 3161.
- Uher et al. 1999 C. Uher, J. Yang, S. Hu, D. T. Morelli and G. P. Meisner, Phys. Rev. B, 1999, 59, 8615–8621.
- Zou et al. 2013 D. F. Zou, S. H. Xie, Y. Y. Liu, L. G. Lin and J. Y. Li, J. Appl. Phys., 2013, 113, 0–7.
- Feng et al. 2019 Z. Feng, Y. Fu, A. Putatunda, Y. Zhang and D. J. Singh, Phys. Rev. B, 2019, 100, 085202.
- Aliev et al. 1987 G. Aliev, N. B. Brandt, V. V. Kozyrkov, V. V. Moshchalkov, R. V. Skolozdra and Y. V. Stadnyk, JETP Lett., 1987, 45, 684–687.
- Yan et al. 2018 Y. Yan, W. Geng, J. Qiu, H. Ke, C. Luo, J. Yang, C. Uherc and X. Tang, RSC Adv., 2018, 8, 15796.
- Yang et al. 2004 J. Yang, G. P. Meisner and L. Chen, Appl. Phys. Lett, 2004, 85, 1140.