Percolation in metal-insulator composites of randomly packed spherocylindrical nanoparticles
Abstract
While classical percolation is well understood, percolation effects in randomly packed or jammed structures are much less explored. Here we investigate both experimentally and theoretically the electrical percolation in a binary composite system of disordered spherocylinders, to identify the relation between structural (percolation) and functional properties of nanocomposites. Experimentally, we determine the percolation threshold and the conductivity critical exponent for composites of conducting (CrO2) and insulating (Cr2O3) rodlike nanoparticles that are nominally geometrically identical, yielding and respectively. Simulations and modeling are implemented through a combination of the mechanical contraction method and a variant of random walk (de Gennes ant) approach, in which charge diffusion is correlated with the system conductivity via the Nernst-Einstein relation. The percolation threshold and critical exponents identified through finite size scaling are in good agreement with the experimental values. Curiously, the calculated percolation threshold for spherocylinders with an aspect ratio of 6.5, , is very close (within numerical errors) to the one found previously in two other distinct systems of disordered jammed spheres and simple cubic lattice, an intriguing and surprising result.
I Introduction
The concept of percolation enables a connection between the long-range connectivity of randomly distributed objects within a network to global properties of the system spanned by this network. The behavior of such systems can be described by a standard model in which a random probabilistic process shows a continuous phase transition from a finite size percolating cluster below a critical value of the percolation threshold to an infinite cluster above [1]. Percolation is indispensable in interpreting a wide variety of physical, chemical, mechanical, and biological phenomena occurring in disordered systems, from the spread of diseases [2], thermal transport [3], electrical conduction in composites [4], to metal-insulator [5], magnetic [6], and spin quantum Hall [7] phase transitions, and to pharmaceutical drug delivery [8, 9]. Electrical conductivity in a percolating system can be modeled by progressively adding larger numbers of identical conducting particles to an insulating matrix until a geometrically connected conducting phase is generated. The electrical conductivity then scales as , where is the percolation threshold, the critical value of the concentration or fraction of the conducting particles, and is a critical exponent. The percolation threshold is normally dependent on the specific system configuration and the geometry of constituent particles. On the other hand, the critical exponent was expected to be universal, i.e., independent of details of system structures and components ( in three dimensions [1]), whereas more recent studies indicated the nonuniversality of , the values of which were found to range from to or even higher in various composites [10, 11, 12].
While the classical percolation picture described above has been well established, a variant of this problem which addresses the percolation effects of particles packed in disordered (random) or jammed structures is much less thoroughly explored and understood [13] (see Fig. 1 for some examples of such disordered packings). Compared to lattice-like, ordered structures, randomly packed systems usually have different packing fractions, which, in turn, would affect the critical behavior of the system and could play a key role in defining the functionality of the sample. A recent example is the occurrence of double percolation observed in a disordered binary mixture [14], in which both types of particles (CrO2 and MgB2) are conducting or superconducting but their volume fraction vs conductivity relation shows an insulating region in between two separate percolation thresholds. These two thresholds, corresponding to the conductor-insulator and superconductor-insulator transitions respectively, arose from the suppressed interface conduction between a half-metal (CrO2) and a superconductor (MgB2) [15, 16] and the large geometric disparity between particles in this rod-sphere system of binary species [14]. This effect underscores the fundamental and practical importance of the percolation threshold and the relationship between the thresholds, geometric contrast of constituent particles, and the transport properties of the system for various particle networks.
While percolation thresholds and the critical behavior in many ordered three-dimensional (3D) lattices of fixed coordination numbers have been investigated in detail [1, 4, 17, 18, 19, 20, 21], much less is known about systems of disordered packing which form networks of interparticle contacts with variable coordination numbers [22]. In these cases where the constituent particles could be of various types and geometries, such as particle shape and size, and the average number of nearest neighbors may be close to that in a specific ordered lattice, they are lacking long-range order and are randomly or quasi-randomly distributed with a broad range of neighboring particle contact numbers. To develop the methodology for identifying the corresponding percolation properties (such as percolation thresholds and critical exponents) and their correlation to the system functionalities, we will first limit ourselves to a more manageable problem related to dense random distribution of particles of the same size and shape, specifically the disordered mixture of two-component spherocylinders that are geometrically identical but functionally distinct, given that the understanding of this type of system is still lacking.

In this paper, we report both experimental and computational results for a randomly packed system comprising a binary mixture of nominally identical CrO2/Cr2O3 spherocylinders (capsules); see Fig. 1 for a simulation snapshot (top-right panel) and a scanning electron microscopy (SEM) image of the system studied. Specifically, we study a dense disordered network of conducting and insulating spherocylinders of approximately the same size and aspect ratio. To examine the electrical percolation in this system, we first convert the conducting CrO2 rodlike nanoparticles (spherocylinders with an average aspect ratio of ) into nominally geometrically identical insulating Cr2O3 nanoparticles, and then prepare a series of samples of CrO2/Cr2O3 mixture with varying conducting vs insulating volume fractions for electrical transport measurements. The experimental results are compared with large-scale 3D computer simulations and calculations on the corresponding binary disordered composite of non-overlapping hard spherocylinders, which are conducted through a combination of mechanical contraction and Monte Carlo methods and a random walk approach based on the de Gennes ant and the Nernst-Einstein relation.
Good agreement is obtained between our results from experiments and computation, for various percolation and electrical transport properties of this binary network of disordered packing. These include the percolation threshold (experiment) and (simulation), and the scaling behavior near the threshold and the corresponding critical exponent of the electrical conductivity, with and a lower bound identified through [12] (experiment) and (simulation). The small discrepancy between the experimental and theoretical values can be partially attributed to the intrinsic polydispersity of the nanoparticles and some degree of local ordering of the composite used in experiments (see Fig. 1).
An intriguing finding is the calculated value of in this binary system of dense randomly-packed (but not strictly jammed) spherocylinders with an aspect ratio of . This value is very close (within computational errors) to the site percolation threshold of computed recently for disordered jammed spheres [22] and obtained earlier for simple cubic lattice [17, 19]. These are three distinct systems, with different packing fractions, degree of ordering, particle geometry, and different distribution of particle coordination numbers (although with similar values of average coordination numbers). While such an agreement may be accidental for any two systems, it is harder to assume that the same coincidence would occur for the three different systems, where the constraints of the ordered lattice and particle shape are being gradually removed. Hence, one may argue that this result manifests the existence of universality for the percolation threshold in a particular class of systems. Apart from pointing to the closeness of the average coordination numbers in all three systems, a plausible explanation of this result is still lacking; it remains an important open question.
II Experiments
II.1 Sample preparation and structural characterization
Here experimental measurements are conducted to study the electrical transport property of CrO2/Cr2O3 half-metal/insulator nanocomposites at different fractions of CrO2. The CrO2 and Cr2O3 nanoparticles are needle-shaped spherocylinders (see Fig. 1) of similar size, with the average length of approximately 300 nm and diameter of about 40 nm, corresponding to an average aspect ratio of . Composite CrO2/Cr2O3 samples were prepared by mixing metallic ferromagnetic oxide CrO2 nanoparticles with insulating Cr2O3 nanoparticles. The latter were formed by annealing commercially available CrO2 (DuPont) nanoparticles at for 1 hour, using the procedure described in Ref. [23].
The resulting nanoparticles were then analyzed by x-ray diffraction (XRD) spectroscopy to confirm the complete conversion of half-metallic CrO2 into insulating Cr2O3 nanoparticles. XRD spectra over a wide range of diffraction angles 2 (varying from to ) was collected with the help of an x-ray powder diffractometer (Rigaku Miniflex), using Cu radiation of wavelength Å. The x-ray generator was operated at 40 kV with an anode current of 20 mA from stabilized power supplies. The scan was performed at a scanning rate of per minute over the range of angles . Both annealed and unannealed samples of CrO2 were analyzed by XRD, with results given in Fig. 2. Before annealing, peaks appear at 2 angles of approximately , , , … These peaks correspond to the reflected intensity from the (110), (101), (211), … planes of the tetragonal structure of CrO2. Based on the Scherrer formula, the typical crystalline size of the CrO2 nanoparticle is dependent on the wavelength , the line broadening which is the full width at half-maximum, and the Scherrer constant (at the order of 1): nm, which is close to the diameter of the spherocylinder. This estimate is consistent with the result of the high resolution STEM imaging (not shown), indicating good crystallinity of individual nanoparticles. Upon annealing, a clear signature of Cr2O3 peaks has been observed at (012), (104), (024), …, as shown in Fig. 2, confirming the presence of Cr2O3. This is accompanied by noticeably higher peak broadening, indicating a reduced crystalline size of Cr2O3 nanoparticles. Approximately 5 mm diameter pellets with 0.5 mm thickness were formed from the mixture of conducting CrO2 and insulating Cr2O3 particles, using a cold-press die with a uniaxial pressure of 10 GPa. An SEM micrograph of a typical sample is shown in Fig. 1.

II.2 Electrical characterization
Four-point electrical transport measurements were performed in a Quantum Design Physical Property Measurement System (PPMS), which allows a wide range of resistance measurements at variable temperatures. Gold wires were attached to the pellet using silver paste, and the sample was then mounted on a PPMS puck using GE varnish. The variation of resistivity as a function of fraction of CrO2 particles in a CrO2/Cr2O3 composite was measured using PPMS in the temperature range 200 K 300 K. At each nominal composition at least two different samples were prepared. The resistivity was measured using the four-probe technique, which eliminates parasitic contributions from electrical contacts [24]. Experimental errors originated primarily from the geometric factors, such as the finite contact size and the contact placement uncertainty, as well as variations in the sample thickness and anisotropy. In addition to the classical percolation threshold reported here, we have observed tunneling percolation thresholds at lower fractions , manifested by tunneling staircases similar to those described in Refs. [25, 26]. The detailed results of these measurements will be presented elsewhere.
| 300 K | ||
|---|---|---|
| 270 K | ||
| 250 K | ||
| 220 K | ||
| 200 K |
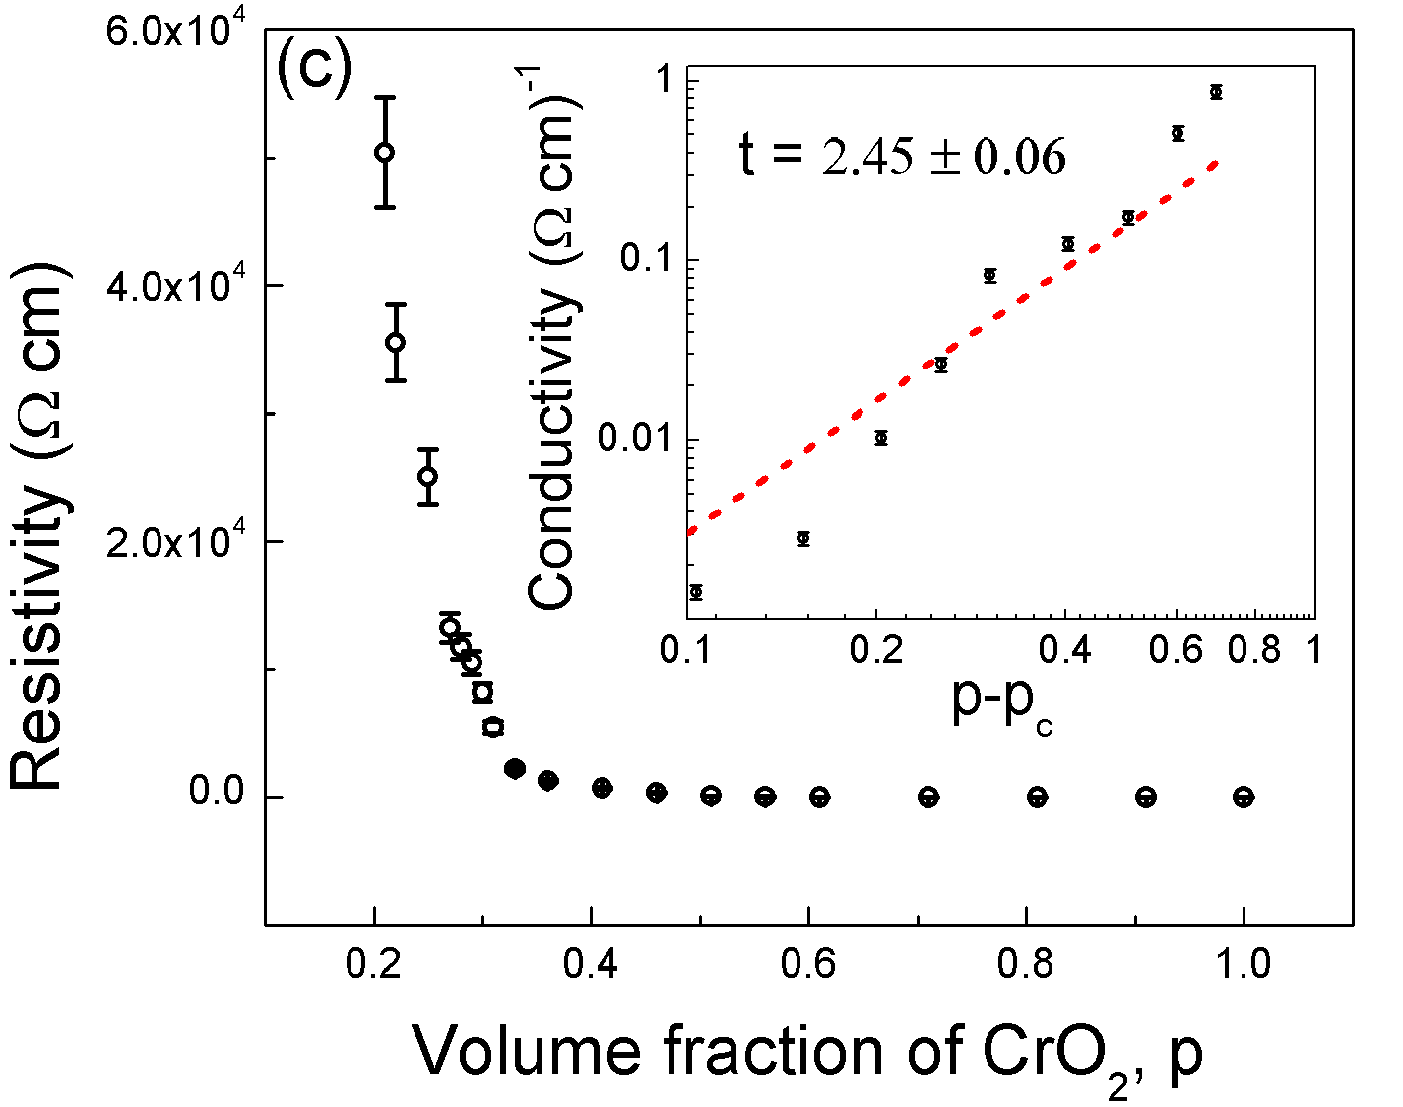
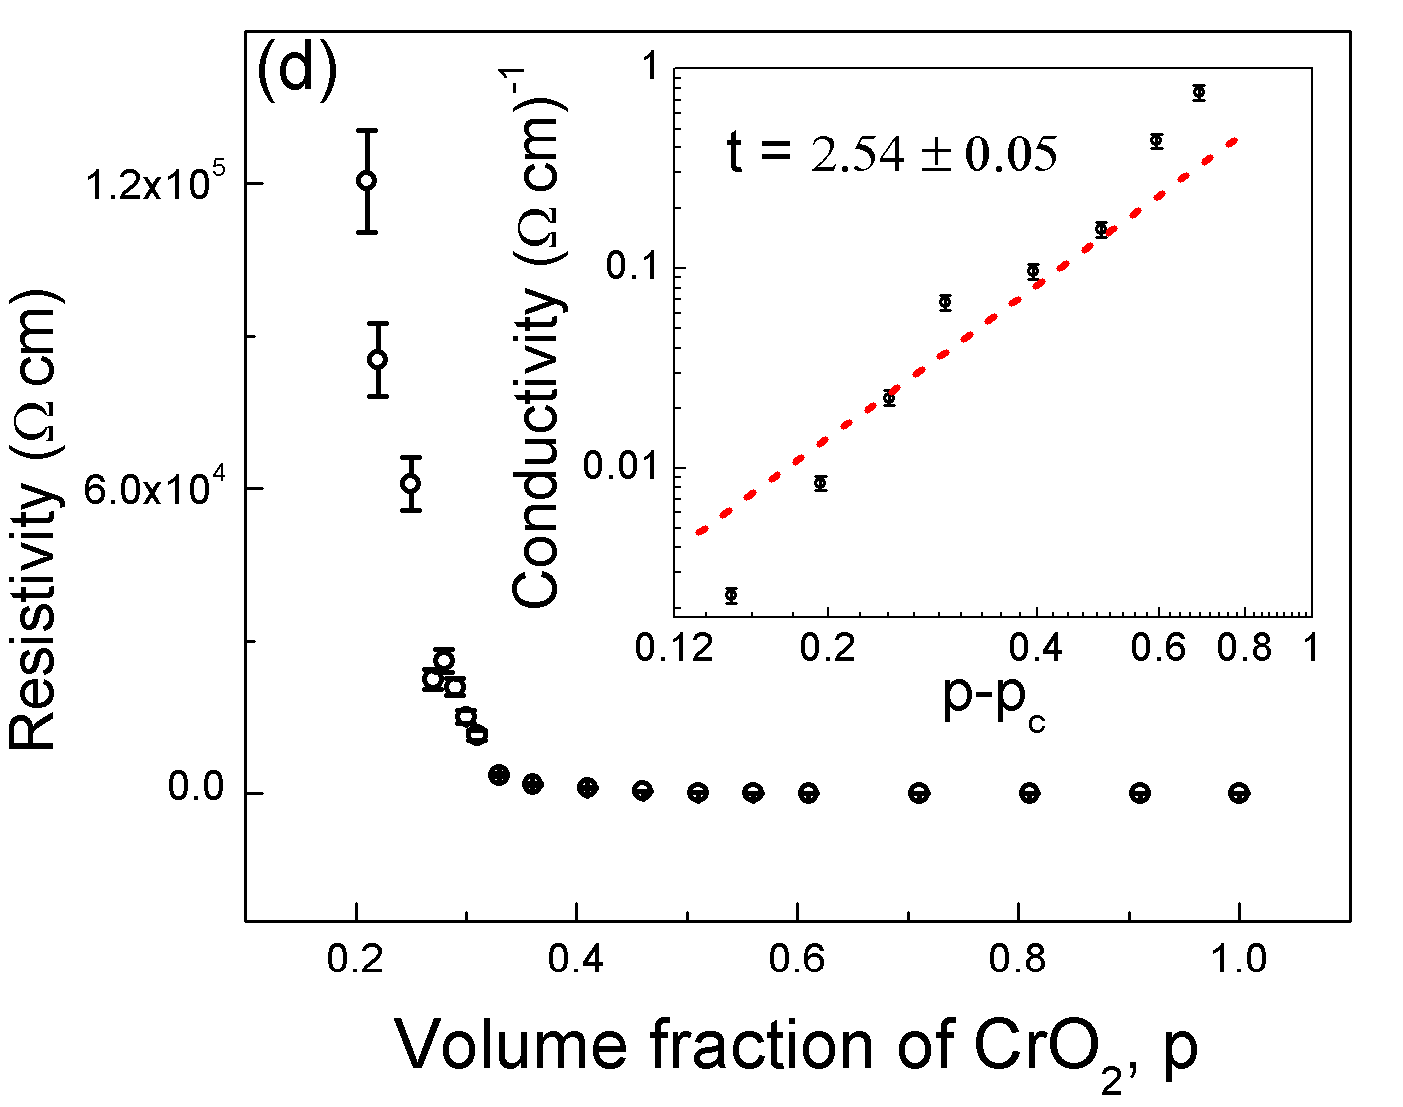
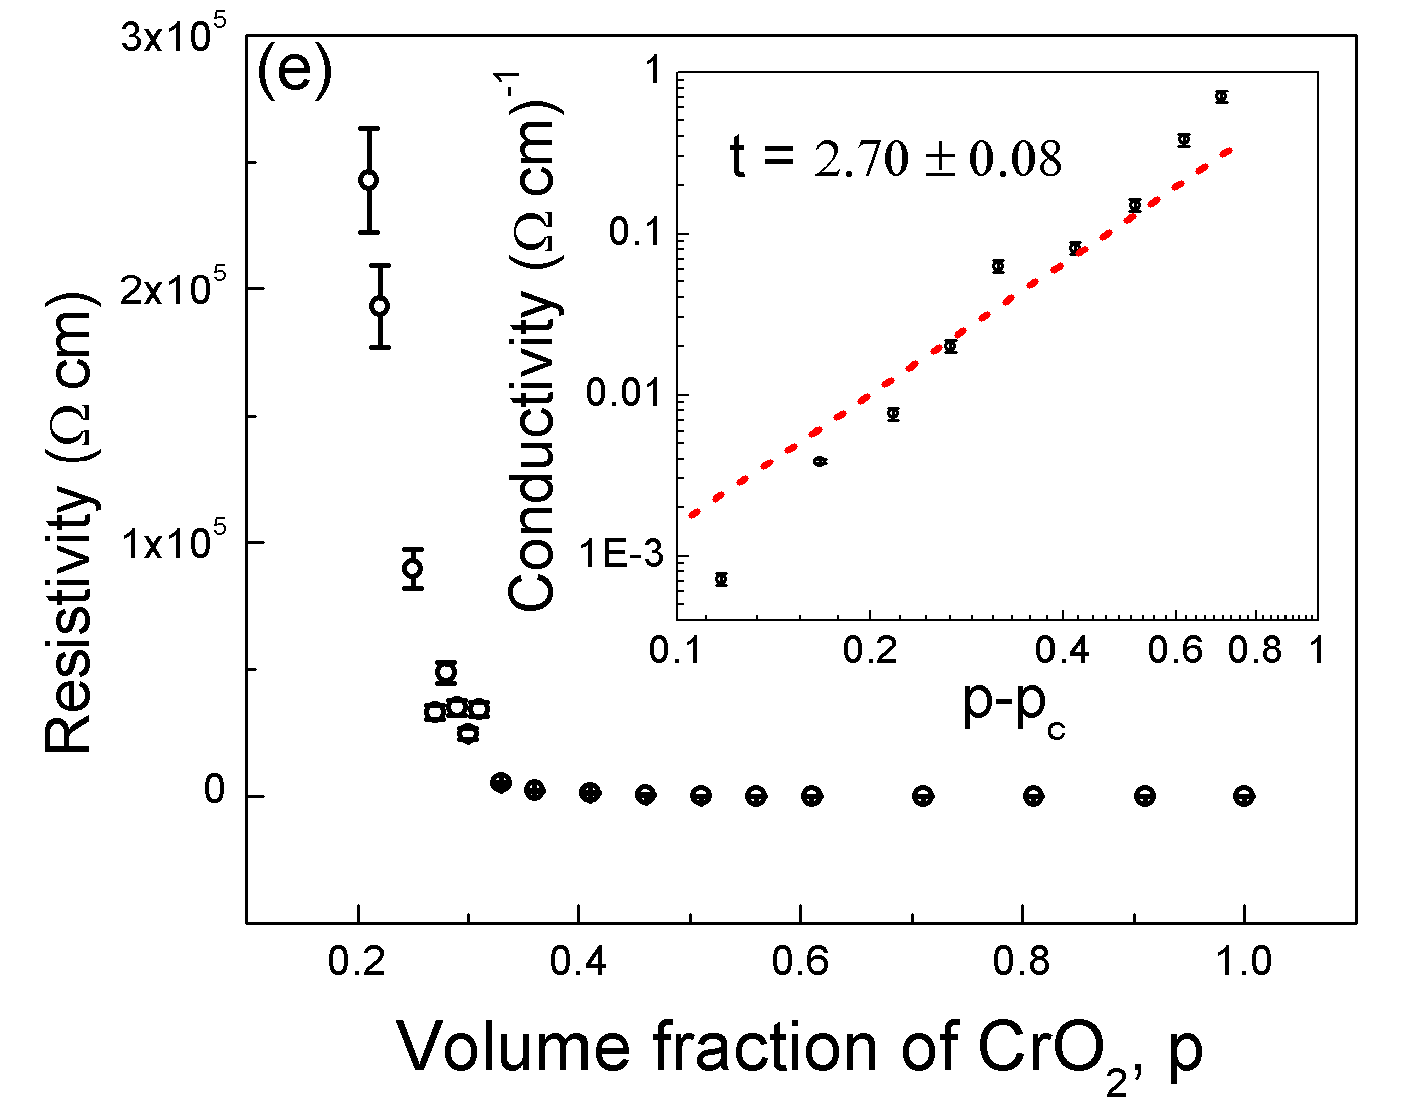
Electrical characterization of nanocomposites for varying fractions of the conducting particles (CrO2) was performed at five different temperatures, 300 K, 270 K, 250 K, 220 K, and 200 K, with the results shown in Fig. 3 and summarized in Table 1. The values of the percolation threshold were determined by optimizing nonlinear regression for (plots not shown) from these five independent measurements of the sample conductivity , as listed in Table 1. Note that the conductivity of metallic CrO2 in this temperature range is only weakly temperature dependent, while Cr2O3 components are at least an order of magnitude more resistive at K as compared to room temperature (see Fig. 3). Thus, the conductivity at K is affected by the leakage current through Cr2O3 nanoparticles and hence was excluded from the determination of the and values of the conducting-insulating system. Averaging over the four lower temperature values of , we identify the percolation threshold as for this nanocomposite system (using the proper weighted mean with the uncertainty evaluated via the standard error propagation). To perform the consistency check of these results, we used two supplementary methods for the threshold determination. In the first, the steepest descent (gradient) approximation [27], the threshold was associated with the extremum of the derivatives of plotted as a function of . In the second method, we used temperature-dependent transport measurements to identify inflection points in the plot of the ratios of sample resistances at a given temperature to the room-temperature values, as described in Ref. [26]. The values of obtained from all these three methods coincide within the experimental accuracy.
Once the percolation threshold at a given temperature was identified, we used its value (with the corresponding error correction) in standard log-log plots to determine the conductivity critical exponent . The results are shown in the insets of Fig. 3 (see also Table 1), demonstrating the scaling behavior of conductivity above the percolation threshold . The average of four lower temperature results yields . This value of conductivity exponent for binary disordered spherocylinders is comparable to some previous results of 3D conductive networks, such as for the conductor-insulator transition in CrO2/MgB2 (spherocylinder/sphere) double-percolating composites [14] and those found in various disordered composites [10, 11].
III Simulations
III.1 Methods
III.1.1 The mechanical contraction method for random packing
To model the structure of a given nanocomposite, it is essential to produce dense random packings of its constituent hard particles in simulations. Conventional Molecular Dynamics simulations are too computationally expensive to be practical when the precise microstates of the system are not essential [28]. Standard Monte Carlo methods inherently sample the equilibrium distribution of particle states [29], while making rapid compression into a disordered, out-of-equilibrium state is not compatible with the premise of the model. Additionally, this results in poor performance since in a dense state an unacceptably high fraction of trial moves would fail the Metropolis criterion [30] for hard particles; that is, a vast majority of potential translations or rotations of particles produce states where particles overlap with their neighbors. These states are invalid and thus must be rejected.
Because of these limitations, here we use an alternative algorithm designed explicitly to produce random packings, the Mechanical Contraction Method (MCM), as developed in Ref. [31]. The premise of MCM is to take a system of spherocylinder particles in an initial low density random state, and bring them together directly, moving each particle only when it would collide with another and only just enough to avoid overlaps. By this approach, the initial entropy of the low density phase is carried through the compression until the entire system can no longer be transformed to a higher density state [32]. Details of the method are given in Ref. [31], with the implementation steps summarized below.
First, the particles’ positions and orientations are randomized at low density (with packing fraction ) by a number of hard particle Monte Carlo moves. At such low densities, virtually all trial moves succeed; thus this step can be performed quickly, even for large systems. This provides the initial state for the MCM. Using the MCM algorithm, the whole system is then scaled down by a small volume factor , and the position of every particle is scaled down accordingly, bringing them uniformly together. The algorithm searches over all particles in the system in arbitrary order, to identify neighboring particles that might be overlapping. This is straightforward for spherocylinders which can be characterized as a set of points within radius of a line segment of length . If the shortest distance between the two particles’ axes of symmetry (within from the particle centroid) is within , they must be overlapping. The amount of overlap is defined as .
The strategy of the MCM algorithm is to move a particle in a direction that reduces the total of its overlaps with neighboring contacted particles the most quickly. This direction is determined by maximizing the effective speed, which is a weighted combination of translational and rotational velocities with respect to all of its contacted particles [31]. Along this direction the particle is moved sufficiently far to reduce the smallest overlap by a tiny amount more than , so that when particle is moved in the opposite direction by the same amount the pair will barely break contact, typically separated by times the needed distance. This will minimize the probability of producing new overlaps when moving the particles. This process is iterated until all overlaps are removed, whereupon the simulation box is further reduced. The procedure is repeated until the system cannot be further compressed with all the generated particle overlaps being removed (within a large enough cutoff number of trials).
We have implemented the MCM algorithm as a custom module in HOOMD-Blue, an open-source general purpose particle simulation engine [33, 34, 35] that was used for generating the related Monte Carlo moves in this algorithm (with excluded-volume interparticle interaction). The custom module developed is available at Ref. [36]. The acquired data were visualized using Ovito open-source particle visualization software [37] (see e.g., Fig. 1).
III.1.2 The random walk method for conductivity calculation
Determining the conductivity of large networks of irregularly connected particles presents a considerable challenge. To directly analyze the circuit formed by conducting particles and use Kirchhoff’s laws requires the construction and solution of a large set of linear equations, a procedure that is time consuming. Moreover, the bulk conductivity of the system is likely insensitive to many small changes in network structure. A more efficient approach can be obtained by tracing a randomly-moving test charge through the system and calculating its diffusion property, in a method analogous to the so-called de Gennes “ant in a labyrinth” [38] and “termite” [39], in concert with using the Nernst-Einstein relation.
This random-walk model was initially proposed by de Gennes to explore the percolation transition in cross-linked network systems [38], where he imagined a microscopic “ant” lost in a labyrinth of nodes, some of which are connected by bonds or chains. If these chains are sufficiently cross-linked to create a percolating network, there should be a finite probability that from any arbitrary starting point the ant could walk along the network to cover infinite distance. Later theoretical work expanded upon this simple percolation test and used this random-walk approach to measure properties related to the diffusion processes, connectivity, and transport in disordered systems or random networks [1, 40]. These include the use of the de Gennes ant to calculate the diffusion constant and hence the conductivity of the random resistor network through the Nernst-Einstein relation, the extension to the de Gennes termite [39] to study the random superconducting network consisting of normal conductors and superconductors, and further to more complex cases of composites involving two [41] or three [42, 43] types of bonds with different conductances.
Here we use this random walk approach to obtain the conductivity of the disordered system of conducting-insulating spherocylinder nanoparticles, by imagining our ant as a test charge diffusing through the particle network, subject to the local conductivity of each particle. In practice, this is done by initializing the random walker on an arbitrarily chosen particle in the system consisting of all the clusters (i.e., the general ensemble [40]), following the procedure for a “blind ant” [44]. At each step, the walker (ant) located at particle chooses at random one of the neighboring particles which it is in contact with. The ant moves to that particle if it is conductive; otherwise the location of the ant remains unchanged. In either case the amount of time taken by the ant is increased by one unit at every step. This corresponds to the assumption that in our system of CrO2/Cr2O3 composites, only two types of particle-particle conductance are taken into account, with the interparticle hopping rates for a random walker being and respectively. The first case corresponds to the conductive type between two CrO2 particles, while the second to the non-conductive type between two Cr2O3 particles or along a mixed CrO2-Cr2O3 link, neglecting any possible leakage current through Cr2O3.
At the same time, each jump of the walker covers an amount of displacement, measured between the geometric centers of the particles, which is tracked and used to calculate the mean-square displacement as a function of total time spent by the walker. (We have also evaluated based on the displacements between interparticle contacts, and obtained very similar results.) In our simulations the progress of each random walk was tracked for steps through the system. The diffusion constant can then be calculated via the relation . It is, in turn, linearly proportional to the dc conductivity of the system via the Nernst-Einstein relation [40]
| (1) |
where is the density of the charge carriers. We can then map the behavior of the electrical conductivity of complex networks onto the diffusion property of random walks. In the disorderly packed system of binary composites studied here, the carrier density is determined by the concentration of conductive (CrO2) particles with fraction ; thus it can be approximated as , where is the packing fraction of all the particles (CrO2 and Cr2O3) evaluated from simulations. In our calculations for each system size, this procedure was repeated with different randomly selected starting particles (i.e., independent walks) in each simulated configuration of binary spherocylinders, and the results were averaged over a large number of system configurations generated independently.
III.1.3 Finite size scaling
Continuum percolation models for disordered particle systems exhibit the same form of critical phenomena as the more-studied lattice percolation models by virtue of universality. This critical behavior is characterized by power-law scaling relations of geometrical, statistical, or some functional properties in terms of the particle probability or fraction near the percolation threshold [1], such as the scaling of conductivity when as examined here for the metal-insulator nanocomposite. Another important quantity is the correlation length , scaling as , which represents the characteristic size of the finite clusters [1, 4].
In principle, all such critical behaviors are defined in the limit of infinite system sizes, requiring simulations to be related to the infinite system to obtain accurate scaling relations and critical exponents. It is particularly important for an accurate determination of , because it defines the reference point of all the scaling relationships for the other critical properties of the system. The definition of is the particle concentration or fraction at which the infinite system is first able to generate an infinite, percolating cluster. However, for finite systems what is measured instead is the effective percolation threshold as a function of the specific finite system size , i.e., . Thus the finite size scaling is needed to extract the infinite-system results of and critical exponents from the finite-size simulations, for which we adopt the method of Ref. [45] as outlined below.
In practice, for each system size , at a given value of the probability of getting at least one cluster of conducting particles that spans through the system across two sides of any direction is first evaluated over a number of independent realizations of system configurations (in the random packing state prepared by the mechanical contraction and MC methods described above). The value of can then be calculated by determining the value of at which this spanning probability . of a finite-size system is expected to follow the scaling relation [1]
| (2) |
where is the scaling function, and is the percolation transition width which tends to decrease towards 0 as increases towards the thermodynamic limit, typical of phase transitions. The percolation transition width scales as [1, 45]
| (3) |
which provides a simple way to determine the correlation-length exponent , leading, together with Eq. (2), to
| (4) |
a scaling relation that is used to obtain the accurate result of the percolation threshold .
In the calculations this is done by fitting with a function of the sigmoidal form. In Ref. [45] for a system of spheres, the scaling fitting function was chosen as , i.e., the cumulative distribution function (CDF) for the normal distribution. In the currently studied system consisting of highly anisotropic spherocylinders, the probability distribution does not have an antisymmetric form with respect to , as seen from our simulation results; thus, here the fitting function is assumed as the CDF for the skew normal (SN) distribution , where the location, scale, and shape parameters of the SN distribution are denoted by , , and , respectively. If the CDF for the normal distribution (as used in Ref. [45]) is recovered. For each system size , defining as the value when and , we have , with very similar value of obtained from our simulation results of different . Thus when setting , can be fitted to the scaling function
| (5) |
We have applied both fitting functions, i.e., CDFs for normal and skew normal distributions, to the simulation data, and obtained very similar results of (within numerical errors) after performing the finite size scaling of Eq. (4). However, the CDF for the skew normal function is a better fit for curves than the CDF for the normal distribution. Therefore, in the following only the results obtained from fitting to Eq. (5) are presented.
To summarize, by running a series of trials of various values of across the transition regime near for a range of system sizes , we can first evaluate and through the fitting to Eq. (5) and directly measure how they scale as a function of . The next step is to use these scaling relations to identify the value of from Eq. (3) and then, based on Eq. (4), extrapolate to the infinite system to obtain the true percolation threshold . The precise value of identified from Eq. (4) can then be used to determine other critical exponents via scaling relations, particularly the critical exponent for conductivity calculated from the random walk (de Gennes ant) method described above.
III.2 Simulation results
Using the methods described above, we conducted a series of simulations of randomly packed conducting-insulating spherocylinders, for six systems with total number of particles , , , , , and . In each system, the particle number is of the form where is an integer ranging from to , to allow for simple initialization in a cubic-shape simulation box with periodic boundary conditions. All the spherocylinders were taken to be of the same size, with units in diameter and units in length, corresponding to an aspect ratio of , same as that of CrO2/Cr2O3 nanocomposites. A typical simulation started with a cubic box of edge length , to ensure sufficient spacing between the spherocylinders for the initial randomization steps. The positions and orientations of the particles were initially thermalized with Hard-Particle Monte Carlo steps at a density . Then the MCM algorithm described above was applied to generate the final dense disordered state with the corresponding compressed system size . For the example of particles, the fully compressed system has an edge length of around 9 units, with . The list of contacting particles obtained during the steps of the MCM routines for overlap removal was utilized to identify connected clusters and percolation paths of the final dense packing state through the Hoshen-Kopelman algorithm [46] with off-lattice extension [47]. For a given system, at each fraction of conducting particles, we performed a large number of replicate simulations, , with different initial random number seeds, to generate different configurations of dense random packing through MCM for each to assure the results were independent. For our initial hypothesis exploration, the number of replicates was chosen in such a way that the expected relative statistical error . We then refined our data by adding approximately the same number of runs for each , bringing the total statistical error close to . For example, for a system of particles, we generated independent configurations via MCM to evaluate the system property at each , while for , we used replicates for each .

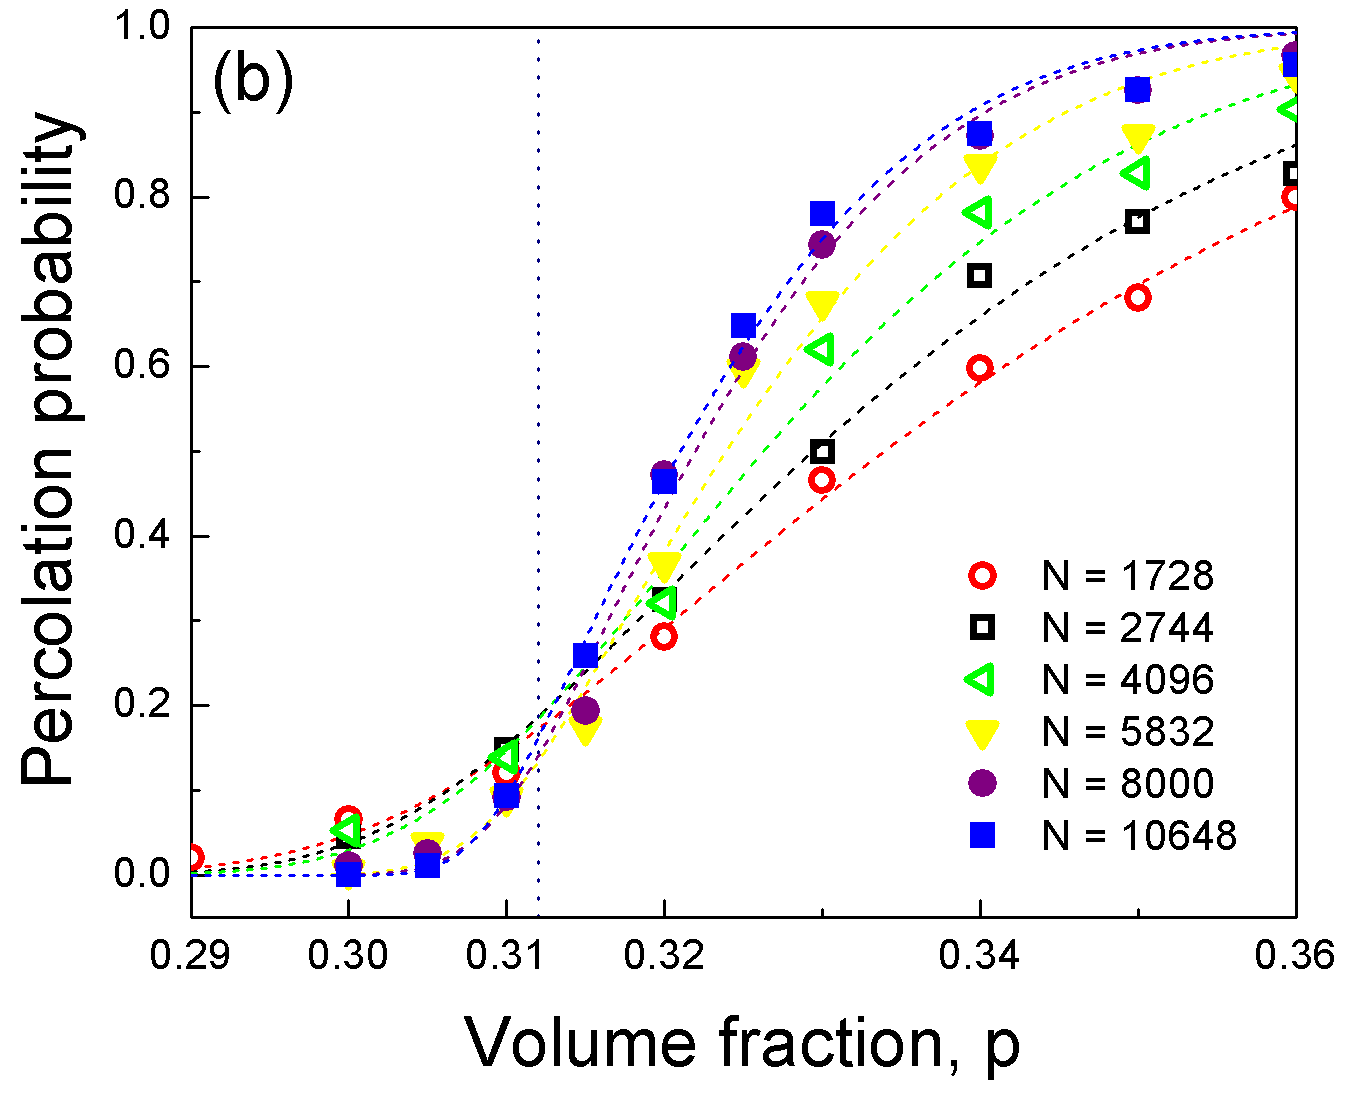
Figure 4(a) shows the plots of the spanning percolation probability calculated over a range of near the percolation threshold, for two different particle numbers, and . A smaller (corresponding to a smaller system size ) yields a broader probability distribution, with a larger width of percolation transition , as expected. The quantitative values of and the effective percolation threshold for various system sizes were determined through the fits of the calculated probability data to Eq. (5), with results presented in Figs. 5 and 6, respectively.

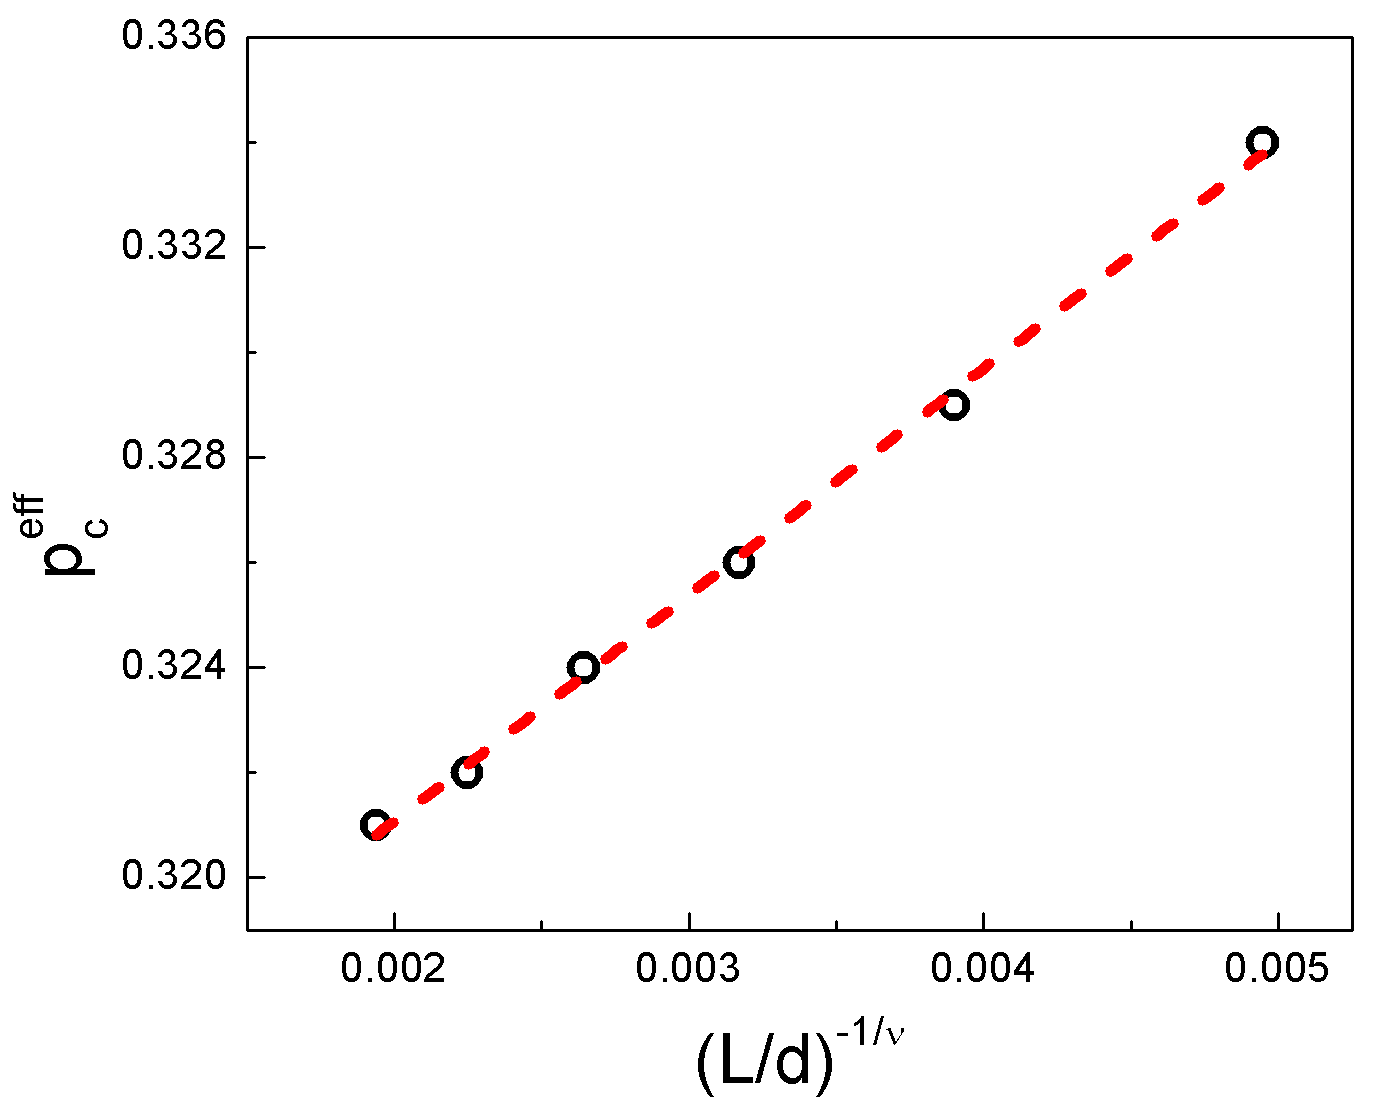
Following the finite-size scaling procedure described above, we first determine the value of the correlation-length critical exponent by fitting the values of transition width to Eq. (3), as shown in Fig. 5. It gives which, in turn, is used to fit the values of plotted against according to Eq. (4). The fitting result, presented in Fig. 6, is used to determine the extrapolated value of the percolation threshold in the limit of infinitely large system of randomly packed spherocylinders. This value of agrees well with the experimental finding of reported in Sec. II.2 for CrO2/Cr2O3 nanocomposites. We note that the value of correlation-length exponent () obtained here is smaller than the standard value of in 3D, which could be attributed to the relatively large errors of width evaluated in the fitting (see Fig. 5) and limited number of particles used in our simulations.
An alternative method to identify can be used by noting that given a certain geometry of the constituent particles and a dimensionality of the system, the critical spanning probability at is a universal quantity [17]. Thus, for systems of different finite sizes the corresponding spanning probabilities are expected to cross at . This is consistent with our simulation results given in Fig. 4(b), which shows a narrow range of such crossing points located from to due to numerical variations, well agreeing with the result of obtained above from finite size scaling.
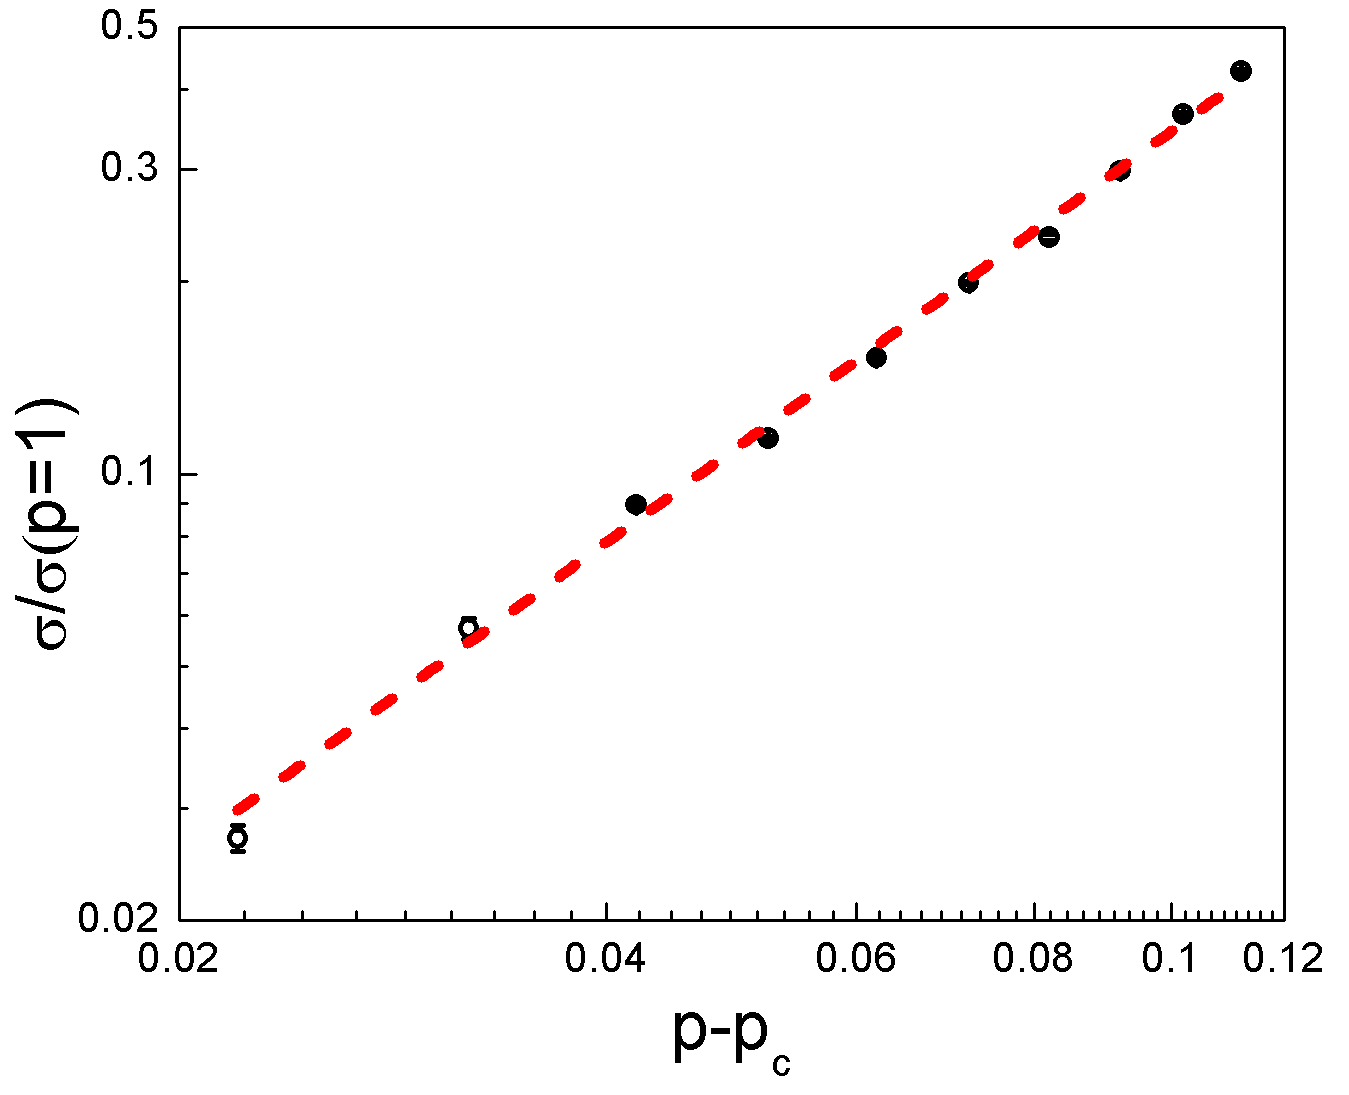
Finally, we ran another series of simulations and applied the random walk method of de Gennes ant described above to calculate the system conductivity for a narrow range of above . A large system size with particles was used, with independent configurations generated via MCM for each . In each configuration independent random walks of “blind ants” (with randomly chosen starting points) were conducted, and the outcomes were averaged over trials at each to obtain the mean-square displacement . The asymptotic regime of was used to calculate the system conductivity . The corresponding results of are presented in Fig. 7, where the conductivity data has been rescaled with respect to , the conductivity of the system consisting of purely conducting particles that was evaluated at . Using this data to fit into the scaling relation , we determined the critical exponent of the system conductivity, yielding .
This calculated value of the conductivity critical exponent is within the range of previous findings of in disordered composites [10, 11, 12], but much smaller than the value of measured for this system experimentally. This discrepancy may be understood in light of analysis of Ref. [12], given that in the nanocomposite system studied here the electrical transport between any two adjacent spherocylinders is mainly governed by their interfacial resistance (due to the presence of surface oxide layers). Thus, the scaling of the system conductivity should be written as [12]
| (6) |
where is the occupation probability of the conducting interjunction (proportional to the average contact number between conducting particles), and with the fraction or concentration of conducting particles, as confirmed in our numerical simulations. When is close to (as in our computation of shown in Fig. 7), from Eq. (6) the conductivity scaling behavior is dominated by , recovering the standard scaling relation for , with the value of identified above. On the other hand, when is far enough from the percolation threshold , as occurred in our experimental measurement and data analysis (see Fig. 3), the range of for the conductivity exponent , as measured for , is expected [12], leading to a lower bound of for the experimental result given in Sec. II.2. Our computed result of is then consistent with the experimentally measured value for the critical exponent, suggesting that our model correctly captures the essential electrical property of this percolating network of disordered spherocylinders.
IV Discussion and Conclusions
We have investigated a binary composite system of randomly packed spherocylinders, to examine the relation between structural (percolation) and transport properties of the system. The composite consists of metal (CrO2) - insulator (Cr2O3) nanoparticles that are of identical rodlike particle geometry but distinct functionality. Our experimental (, with ) and computational (, ) results for both the percolation threshold and conductivity critical exponent are in good agreement. The small observed variations can be partially attributed to a different degree of disorder in experimental and theoretical arrangement of the spherocylinders. While in our simulations we have used a completely disordered system, the samples fabricated for the experimental measurements have a substantial degree of local nematic order which, in turn, may affect the threshold and the critical exponent values. The effects of polydispersity and particle irregularity, which are unavoidable in the experimental setup (see Fig. 1) but neglected in the simulations, may also account for the discrepancy between the experimental and computational results. In addition, the experimental results near the classical percolation threshold may have been affected by the presence of tunneling percolation at lower values of .
We note that our large-scale simulation result for the site percolation threshold of spherocylinders with an aspect ratio of , i.e., , is very close, within numerical errors, to the threshold found in Ref. [22] for jammed disordered spheres [] which, in turn, is almost identical to the threshold of the simple cubic lattice ( [17, 19]). These three systems are geometrically quite distinct, with very different packing factors and different distribution of coordination numbers, although their average coordination numbers are close. The coordination number for the simple cubic lattice is exactly 6, the disordered jammed sphere packing has coordination numbers ranging from 4 to 12, with an average of 6 [22], while for the random close-packing of spherocylinders with a aspect ratio studied here, a broader distribution of coordination numbers is obtained, ranging from 0 to 16 with an average of (averaged over simulations with particles each).
This value of is much lower than the isostatic value of for spherocylindrical particles with degrees of freedom per particle [49] at sufficiently large aspect ratios, indicating that the randomly packed systems examined here are not strictly jammed. It is likely due to the use of MCM, which has been known to produce states of lower for long rods with high aspect ratio [48] and the use of insufficiently small contact tolerance in our numerical simulations as compared to that generating random jammed packings of spheres [22, 50]. This results in a disordered packing state of spherocylinders that are not fully jammed, similar to the nanocomposite system studied here experimentally for which the strict jamming with higher is usually not accessible.
Although systems with the same average coordination number are likely to have similar values of , such a close agreement is unexpected, given the different distribution of coordination numbers and noting that some other systems with the same average coordination number of 6 do not have such close values of (see Table 1 of Ref. [22]). This result implies that not only the values of the threshold may be unaffected by the exact details of particle ordering, as in the case of ordered lattice vs disordered packing of spheres with the same average coordination number, as has been pointed out in Ref. [22], but it may also be insensitive to the details of the particle geometric shape. While this may still be fortuitous, the coincidence seems less likely, given the independent research on three different systems, and with the new result presented here for the dense disordered state of spherocylinders that are geometrically distinct from spheres. If this result also holds for other systems, it may indicate a possible universality of the percolation threshold based on a more profound underlying mechanism which is presently unknown and needs further investigation.
These results are relevant for future device applications of functional nanoparticle composites, for which the ability to control the percolation threshold is critically important. They can also be of interest for a broader range of packing and percolation systems, such as drug release and the design of drug tablets [51], for which the percolation of soluble drug nanoparticles in the packed soluble/insoluble composite plays an important role [22].
Acknowledgements.
Z.-F.H. acknowledges support from the National Science Foundation under Grant No. DMR-1609625. The authors are grateful to Isaac Balberg, Robert Ziff, and Salvatore Torquato for illuminating discussions and helpful suggestions.References
- [1] D. Stauffer and A. Aharony, Introduction to Percolation Theory (Taylor & Francis, London, 1994).
- [2] R. Parshani, S. Carmi, and S. Havlin, Epidemic threshold for the susceptible-infectious-susceptible model on random networks, Phys. Rev. Lett. 104, 258701 (2010).
- [3] P. Bonnet, D. Sireude, B. Garnier, and O. Chauveta, Thermal properties and percolation in carbon nanotube-polymer composites, Appl. Phys. Lett. 91, 201910 (2007).
- [4] A. Bunde and W. Dieterich, Percolation in Composites, J. Electroceram. 5, 81 (2000).
- [5] Z. Ball, H. M. Phillips, D. L. Callahan, and R. Sauerbrey, Percolative metal-insulator transition in excimer laser irradiated polyimide, Phys. Rev. Lett. 73, 2099 (1994).
- [6] H. J. Elmers, J. Hauschild, H. Höche, U. Gradmann, H. Bethge, D. Heuer, and U. Köhler, Submonolayer Magnetism of Fe(110) on W(110): Finite Width Scaling of Stripes and Percolation between Islands, Phys. Rev. Lett. 73, 898 (1994).
- [7] I. A. Gruzberg, A. W. W. Ludwig, and N. Read, Exact Exponents for the Spin Quantum Hall Transition, Phys. Rev. Lett. 82, 4524 (1999).
- [8] R. A. Siegel, J. Kost, and R. Langer, Mechanistic studies of macromolecular drug release from macroporous polymers, J. Control Release 8, 223 (1989).
- [9] I. Caraballo, M. Fernandez-Arevalo, M.A. Holgado, and A.M. Rabasco, Percolation theory: application to the study of the release behaviour from inert matrix systems, Int. J. Pharm. 96, 175 (1993).
- [10] W. Bauhofer and J. Z. Kovacs, A review and analysis of electrical percolation in carbon nanotube polymer composites, Compos. Sci. Techno. 69, 1486 (2009).
- [11] S. Vionnet-Menot, C. Grimaldi, T. Maeder, S. Strässler, and P. Ryser, Tunneling-percolation origin of nonuniversality: Theory and experiments, Phys. Rev. B 71, 064201 (2005).
- [12] I. Balberg, Unified Model for Pseudononuniversal Behavior of the Electrical Conductivity in Percolation Systems, Phys. Rev. Lett. 119, 080601 (2017).
- [13] S. Torquato and F. H. Stillinger, Jammed hard-particle packings: From Kepler to Bernal and beyond, Rev. Mod. Phys. 82, 2633 (2010).
- [14] X. Liu, R. P. Panguluri, Z.-F. Huang, and B. Nadgorny, Double Percolation Transition in Superconductor-Ferromagnet Nanocomposites, Phys. Rev. Lett. 104, 035701 (2010).
- [15] M. J. M. de Jong and C. W. J. Beenakker, Andreev Reflection in Ferromagnet-Superconductor Junctions, Phys. Rev. Lett. 74, 1657 (1995).
- [16] R. J. Soulen Jr., J. M. Byers, M. S. Osofsky, B. Nadgorny, T. Ambrose, S. F. Cheng, P. R. Broussard, C. T. Tanaka, J. Nowak, J. S. Moodera, A. Barry, and J. M. D. Coey, Measuring the spin polarization of a metal with a superconducting point contact, Science 282, 85 (1998).
- [17] C. D. Lorenz and R. M. Ziff, Universality of the excess number of clusters and the crossing probability function in three-dimensional percolation, J. Phys. A: Math. Gen. 31, 8147 (1998).
- [18] H. G. Ballesteros, L. A. Fernandez, V. Martin-Mayor, A. Munoz Sudupe, G. Parisi, and J. J. Ruiz-Lorenzo, Scaling corrections: site percolation and Ising model in three dimensions, J. Phys. A: Math. Gen. 32, 1 (1999).
- [19] J. Wang, Z. Zhou, W. Zhang, T. M. Garoni, and Y. Deng, Bond and site percolation in three dimensions, Phys. Rev. E 87, 052107 (2013).
- [20] K. Malarz, Simple cubic random-site percolation thresholds for neighborhoods containing fourth-nearest neighbors, Phys. Rev. E 91, 043301 (2015).
- [21] J. Tran, T. Yoo, S. Stahlheber, and A. Small, Percolation thresholds on three-dimensional lattices with three nearest neighbors, J. Stat. Mech.: Th. Exp. 2013, 05014 (2013).
- [22] R. M. Ziff and S. Torquato, Percolation of disordered jammed sphere packings, J. Phys. A: Math. Theor. 50, 085001 (2017).
- [23] J. Wang, P. Che, J. Feng, M. Lu, J. Liu, and J. Meng, A large low-field tunneling magnetoresistance of CrO2/(CrO2/Cr2O3) powder compact with two coercivities, J. Appl. Phys. 97, 073907 (2005).
- [24] I. Miccoli, F. Edler, H. Pfnur, and C. Tegenkamp, The 100th anniversary of the four-point probe technique: the role of probe geometries in isotropic and anisotropic systems, J. Phys.: Condens. Matter 27, 223201 (2015).
- [25] I. Balberg, D. Azulay, Y. Goldstein, J. Jedrzejewski, G. Ravid, and E. Savir, Eur. Phys. J. B 86, 428 (2013).
- [26] R. Mukherjee, Z.-F. Huang, and B. Nadgorny, Multiple percolation tunneling staircase in metal-semiconductor nanoparticle composites, Appl. Phys. Lett. 105, 173104 (2014).
- [27] Y.-J. Chen, X.-Y. Zhang, T.-Y. Cai, and Z.-Y. Li, Hopping and non-universal conductivity in half-metallic CrO2 composites, Chin. Phys. Lett. 20, 721 (2003).
- [28] M. Kubo, Y. Omi, R. Miura, A. Stirling, A. Miyamoto, M. Kawasaki, M. Yoshimoto, and H. Koinuma, Atomic control of layer-by-layer epitaxial growth on SrTiO3 (001): Molecular-dynamics simulations, Phys. Rev. B 56, 13535 (1997)
- [29] G. Russo and P. Smereka, Computation of strained epitaxial growth in three dimensions by kinetic Monte Carlo, J. Comput. Phys. 214,809 (2006).
- [30] N. Metropolis, A. W. Rosenbluth, M. N. Rosenbluth, A. H. Teller, and E. Teller, Equation of State Calculations by Fast Computing Machines, J. Chem. Phys. 21, 1087 (1953).
- [31] S. R. Williams and A. P. Philipse, Random packings of spheres and spherocylinders simulated by mechanical contraction, Phys. Rev. E 67, 051301 (2003).
- [32] A. V. Kyrylyuk, M. A. van de Haar, L. Rossi, A. Wouterse, and A. P. Philipse, Isochoric ideality in jammed random packings of non-spherical granular matter, Soft Matter 7, 1671 (2011).
- [33] J. A. Anderson, C. D. Lorenz, and A. Travesset, General purpose molecular dynamics simulations fully implemented on graphics processing units, J. Comput. Phys. 227, 5342 (2008).
- [34] J. Glaser, T. D. Nguyen, J. A. Anderson, P. Liu, F. Spiga, J. A. Millan, D. C. Morse, and S. C. Glotzer, Strong scaling of general-purpose molecular dynamics simulations on GPUs, Comput. Phys. Commun. 192, 97 (2015).
- [35] J. A. Anderson, M. E. Irrgang, and S. C. Glotzer, Scalable Metropolis Monte Carlo for simulation of hard shapes, Comput. Phys. Commun. 204, 21 (2016).
- [36] https://github.com/brendonwaters/Mechanical-Contraction-Method
- [37] A. Stukowski, Visualization and analysis of atomistic simulation data with OVITO - the Open Visualization Tool, Modelling Simul. Mater. Sci. Eng. 18, 015012 (2010).
- [38] P. G. de Gennes, La percolation: un concept unificateur (Percolation a unifying concept), La Recherche 7, 919 (1976).
- [39] P. G. de Gennes, Percolation: Quelques Systemes Nouveaux, J. Phys. (Paris) Colloq. 41, C3-17 (1980).
- [40] S. Havlin and D. Ben-Avraham, Diffusion in disordered media, Adv. Phys. 36, 695 (1987).
- [41] A. Bunde, A. Coniglio, D. C. Hong, and H. E. Stanley, Transport in a two-component randomly composite material: scaling theory and computer simulations of termite diffusion near the superconducting limit, J. Phys. A: Math. Gen. 18, L137 (1985).
- [42] A. Bunde, W. Dieterich, and E. Roman, Dispersed Ionic Conductors and Percolation Theory, Phys. Rev. Lett. 55, 5 (1985).
- [43] H. E. Roman, A. Bunde, and W. Dieterich, Conductivity of dispersed ionic conductors: percolation model with two critical points, Phys. Rev. B 34, 3439 (1986).
- [44] I. Majid, D. Ben-Avraham, S. Havlin, and H. E. Stanley, Exact-enumeration approach to random walks on percolation clusters in two dimensions, Phys. Rev. B 30, 1626 (1984).
- [45] M. D. Rintoul and S. Torquato, Precise determination of the critical threshold and exponents in a three-dimensional continuum percolation model, J. Phys. A: Math. Gen. 30, L585 (1997).
- [46] J. Hoshen and R. Kopelman, Percolation and cluster distribution I. Cluster multiple labeling technique and critical concentration algorithm, Phys. Rev. B 14, 3438 (1976).
- [47] A. Al-Futaisi and T. W. Patzek, Extension of Hoshen-Kopelman algorithm to non-lattice environments, Physica A 321, 665 (2003).
- [48] A. Wouterse, S. Luding, and A. P. Philipse, On contact numbers in random rod packings, Granul. Matter 11, 169 (2009).
- [49] A. Donev, R. Connelly, F. H. Stillinger, and S. Torquato, Underconstrained jammed packings of nonspherical hard particles: Ellipses and ellipsoids, Phys. Rev. E 75, 051304 (2007).
- [50] S. Atkinson, F. H. Stillinger, and S. Torquato, Detailed characterization of rattlers in exactly isostatic, strictly jammed sphere packings, Phys. Rev. E 88, 062208 (2013).
- [51] W. Jiang, S. Kim, X. Zhang, R. A. Lionberger, B. M. Davit, D. P. Conner, and L. X. Yu, The role of predictive biopharmaceutical modeling and simulation in drug development and regulatory evaluation, Int. J. Pharmaceutics 418, 151 (2011).