Observations of the gamma-ray emitting narrow-line Seyfert 1, SBS 0846+513, and its host galaxy
Abstract
The gamma-ray emitting galaxy SBS has been classified as a Narrow-Line Seyfert 1 from its spectroscopy, and on that basis it was thought likely to have a small central black hole hosted in a spiral galaxy. But very few of the gamma-ray Narrow-Line Seyfert 1s have high-resolution imaging of their hosts, so it is unknown how those expectations hold up for the gamma-emitting class. We have observed this galaxy in the -band with the Large Binocular Telescope’s LUCI1 camera and the ARGOS adaptive optics system. We estimate its black hole mass to lie between , using the correlation with bulge luminosity, or using the correlation with Sérsic index, putting its mass at the high end of the Narrow Line Seyfert 1 range. These estimates are independent of the Broad Line Region viewing geometry and avoid underestimates due to looking down the jet axis. Its host shows evidence of a bulge + disc structure, both from two-dimensional modeling and isophote shape, in keeping with the expectations. Mergers and interactions appear to be common among the gamma-ray Narrow-Line Seyfert 1s, and we see some circumstantial evidence for companion galaxies or disturbed features in the host.
keywords:
instrumentation: adaptive optics – galaxies: active – galaxies: Seyfert – quasars: supermassive black holes1 Introduction
The relation that links galaxies with the black hole (BH) at their centres has been known for a while, and it is valid for non-active and active galaxies (e.g., Ferrarese & Merritt 2000). The host galaxy of an active galactic nucleus (AGN) is the closest environment with which the nucleus interacts and co-evolves (Kormendy & Ho, 2013). For example, accretion on to the central BH can ionize and heat the gas, suppressing the star formation (SF) in the circumnuclear region (Page et al., 2012). Simultaneously, the host directly affects the nuclear activity by regulating the gas supply of the BH. A remarkable example of this feedback is the interplay between the host and the relativistic plasma jet that can be launched by the BH. For example, jets are observed digging their way through the host galaxy gas (Morganti et al., 2015), and they can efficiently suppress the SF activity far from the nucleus (Lanz et al., 2016). Although jets are crucial components in some AGN, they are far from understood. Why and how they are formed is still unclear, but the host galaxy likely plays a crucial role in this. In particular, powerful relativistic jets are preferentially, though not exclusively, associated with ellipticals (Laor, 2000), and merging or interaction may be the keys that trigger the jet activity (Chiaberge et al., 2015).
An important new laboratory to study the jet phenomenon is the AGN class known as narrow-line Seyfert 1 (NLS1s). Many of the sources referred to as Narrow-Line Seyfert 1s are actually quasars under the standard definition (total magnitude ), though this limit does not distinguish between the host and nuclear emission. The physical arguments regarding the Narrow-Line Seyfert 1s we expect to apply to narrow-line type-1 quasars, as well, and in this discussion, we refer to them collectively as NLS1. These objects were first classified by Osterbrock & Pogge (1985) and are defined by the low full width at half maximum of H (2000 km s-1; Goodrich 1989). The narrowness of permitted lines is believed to be due to the low rotational velocity around a low-mass black hole (; Grupe & Mathur 2004). Other lines of reasoning support the idea of small BH masses for NLS1, including their X-ray power spectrum distribution (Pan et al., 2018) and the rapidity of their X-ray variability (Boller et al., 1997; Brandt et al., 1999; Yao et al., 2015; Gallo, 2018). Taking into account their luminosity, comparable to that of broad-line Seyfert 1s, this is suggestive of a high Eddington ratio (Boroson & Green, 1992). These properties have been interpreted as a sign of young age (Mathur, 2000). If this is the case, NLS1s may be the low- analog of the progenitors of high-mass AGN, sharing properties with early quasars.
However, it has been claimed that NLS1s are not genuinely young AGN (e.g., Sbarrato et al. 2018). Narrow permitted lines may also be due to the projection effects caused by a flattened broad-line region observed pole-on (Decarli et al., 2008). Were this the case, the BH masses derived from spectral line widths (Calderone et al., 2013) would be underestimated. Fortunately, the host galaxy can help disentangling these two scenarios. Generally speaking, ellipticals tend to harbor more massive BH than spirals (e.g., Salucci et al. 2000), and the black hole mass correlates with properties of the bulge (e.g., Magorrian et al. 1998; Marconi & Hunt 2003; Graham & Driver 2007). So a measurement of the host galaxy type can tell us about the central black hole’s mass in a way that is independent of geometry.
In 2009, -rays were detected from radio-loud NLS1 (Abdo et al., 2009), and in the years since, about 19 NLS1 have been detected with the Fermi Gamma-Ray Space Telescope (Romano et al., 2018; Järvelä et al., 2020). These have shown unambiguously that there exists a subset of NLS1 that are radio-loud and have powerful, relativistic jets, even though with their smaller black holes, they may have been expected not to (Laor, 2000). The -NLS1s are an intriguing and still poorly-understood sample. If they are from the same broader population as the radio-quiet NLS1, then what triggers the relativistic jet? As described by Komossa (2018), a large number of -NLS1 seem to be in interacting systems. In fact, of the sources analysed in the study, only PKS and SBS did not show evidence for interaction at the then-available resolution. On the other hand, the majority of radio-quiet NLS1 do not show an excess of companion galaxies or evidence for mergers (Krongold, Dultzin-Hacyan, & Marziani, 2001; Xu et al., 2012). In general, jetted NLS1 preferably reside in denser regions than do the non-jetted NLS1 sources, at least in terms of large-scale environment (Järvelä, Lähteenmäki, & Berton, 2018).
Perhaps the host galaxies are different between the radio-quiet NLS1 and the radio-loud (especially the -emitters). But only a few studies have been dedicated to the hosts of NLS1s. Crenshaw, Kraemer, & Gabel (2003) studied 19 NLS1s with HST, all non-jetted at , finding a majority of spirals and frequent starburst rings. A high incidence of pseudobulges was found by Orban de Xivry et al. (2011) and confirmed by a subsequent study with HST of 10 more non-jetted sources up to z = 0.164 (Mathur et al., 2012). However, nothing can be said for non-jetted sources at higher . Regarding radio-loud, jetted NLS1s (7 per cent of the whole NLS1 population; see Komossa et al. 2006), four sources have been studied individually (Zhou et al., 2007; Antón, Browne, & Marchã, 2008; Kotilainen et al., 2016; Olguín-Iglesias et al., 2017; D’Ammando et al., 2017, 2018; Berton et al., 2019). On a larger sample is that by Järvelä, Lähteenmäki, & Berton (2018) with the Nordic Optical Telescope (NOT), but even in that case only three jetted sources were successfully resolved. In general, the results are still unclear. Most jetted NLS1s studied so far are hosted by spirals and disturbed morphologies. The recent study by Olguín-Iglesias, Kotilainen, & Chavushyan (2020) further supports this result. They image 29 radio-loud NLS1s, successfully detecting 21 and fitting bulge + disc models. However, a couple of NLS1 have been found to reside in non-interacting ellipticals (D’Ammando et al., 2017, 2018). This result may support the low-inclination scenario for NLS1s, and might contradict the relation between merging/interaction and jet formation, or it could be that visible signatures of past interaction have relaxed. It is clear that more examples are needed to shed light on the host-AGN connection.
We selected SBS (RA = 849581, Dec = +51°08′257), a -ray emitting Narrow-Line Seyfert 1111SBS has total absolute magnitude , so it is properly considered a quasar, but as we discussed above, we group Seyferts and quasars together in our discussions of NLS1. at , with the goals of observing the host galaxy’s morphology and determining its black hole mass in a geometrically-independent way. It was unresolved in existing imagery and did not show clear evidence of interaction, and the new observations would put it near the high-redshift end of -NLS1 imaged at high resolution. Its relatively high redshift makes any investigation with ground-based telescopes difficult, but adaptive optics is a great help. An important requirement for adaptive optics is the presence of a nearby bright reference star that can be used to model the wave front and correct the images for atmospheric distortion. However, most jetted NLS1s are located well outside the Galactic plane, and they do not have any suitable reference star in the vicinities. For this reason, we decide to observe SBS with the Advanced Rayleigh Guided Ground Layer Adaptive Optics System (ARGOS) on the LBT Utility Camera in the Infrared (LUCI1) camera mounted on the Large Binocular Telescope (LBT). This innovative system can produce a laser guide star that was used as reference for our observations.
2 SBS 0846+513
SBS was already identified as a potential blazar by Arp et al. (1979), although it was considered as a BL Lac at high redshift, and its correct distance was estimated only with the Sloan Digital Sky Survey (SDSS) (Schneider et al., 2003). The source was already known for its extreme flaring activity, with a brightening of about 4 magnitudes in approximately a month (Arp et al., 1979), which was initially attributed to gravitational lensing effects (Nottale, 1986). The source was identified as an NLS1 by Zhou et al. (2006) and Yuan et al. (2008), given its H FWHM of km/s, within the NLS1 definition. After the launch of Fermi, it was detected at -rays during its first observed flare (Donato & Perkins, 2011; Foschini, 2011). The black hole mass of SBS was estimated both using the FWHM and the second-order moment of H , and in both cases the estimate is approximately at , well within the typical range of NLS1s (Yuan et al., 2008; Foschini et al., 2015). At radio frequencies the source has been monitored for years, showing high amplitude variability both in flux and in polarization (Maune et al., 2014; Angelakis et al., 2015; Paliya et al., 2016). At kiloparsec scale, it presents a compact structure with no diffuse emission (Berton et al., 2018), while on parsec scale it shows a core-jet structure with superluminal motion and apparent velocity up to (e.g., Lister et al. 2016). Regarding its host galaxy, no significant structure was detected with the Hubble Space Telescope (HST ) (Maoz et al., 1993) in an observation made before the telescope’s spherical aberration was corrected. Our new data are the first high-resolution observations of this source.
3 Observations
3.1 Imaging
We observed SBS with the LUCI1 camera for two nights on 2016 December 14-15, as part of the commissioning run for ARGOS. LUCI1 and LUCI2 are twin instruments designed for both spectroscopy and imaging. In the imaging mode, they provide a 44 arcmin field of view.
On December 14, we observed with the infrared Ks and J filters, but the seeing was bad and the images unusable. On December 15, we observed with the J filter only. On this night, the seeing and image quality were good, and we obtained a total exposure time of 31.7 minutes for the science observations, with individual exposures of 10 s each. The image scale is 0.118 arcsec per pixel. Building up a composite Point Spread Function (PSF) from stars in the field, we obtain a PSF Full Width at Half-Maximum (FWHM) of 0.308 arcsec. The image reduction and PSF construction are described in §4.1
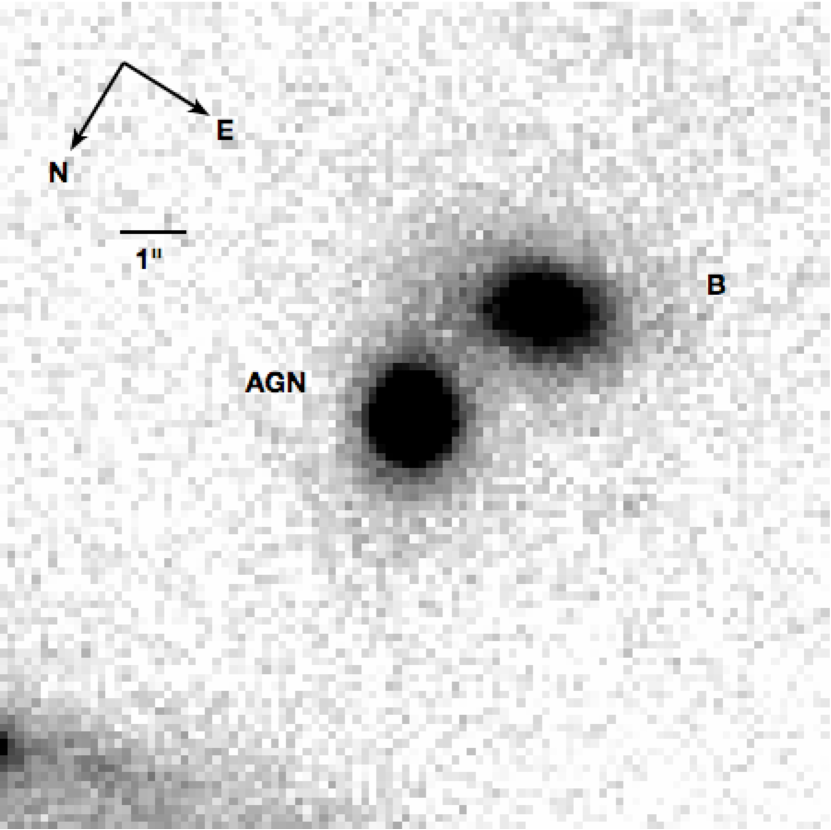
The target region is shown in Fig. 1. The NLS1, SBS , is marked ‘AGN.’ Partially overlapping the AGN is a second galaxy, labelled ‘B’ in the image, that has a projected distance of 2.45 arcsec centre-to-centre.
3.2 Spectroscopy and Redshift
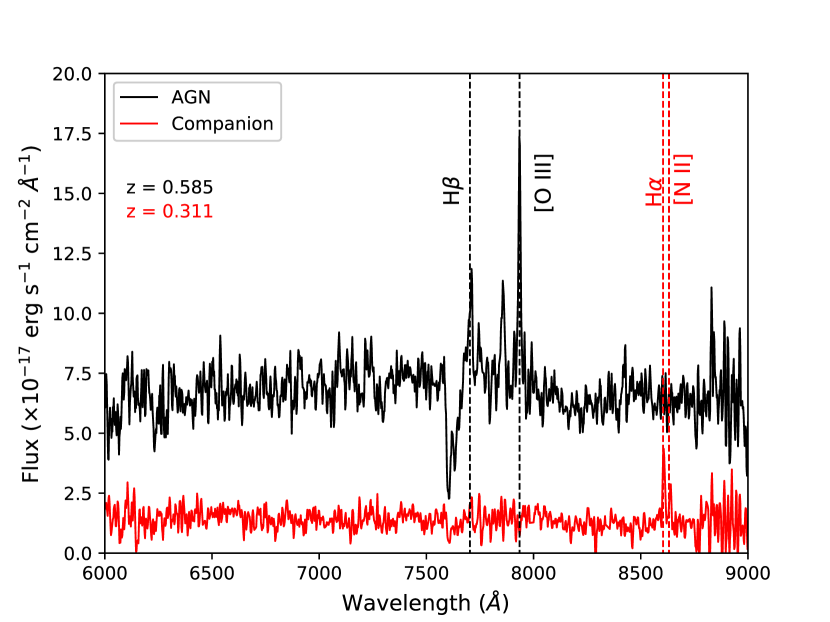
Because Galaxy B is projected to partially overlap the AGN, it raises the question of whether or not B is a physical companion, and possibly interacting. We addressed this spectroscopically, observing SBS with the Alhambra Faint Object Spectrograph and Camera (ALFOSC) on the Nordic Optical Telescope (NOT) on May 9, 2018. The spectrum was obtained with a 1 arcsec slit oriented at position angle , to fit both SBS and Galaxy B in the slit at the same time. The spectrum interval covered was between 5650 and 10150 Å, with a resolution R770 and a total exposure time of 1800 s. After the standard bias and flat-field correction, the wavelength calibration was performed using a ThAr lamp. We flux calibrated the spectrum using as reference the standard star HD 93521.
The spectrum of the two sources is shown in Fig. 2. We clearly identify the AGN lines at , as expected. Both H and [O iii] 4959, 5007 are clearly visible, next to the telluric absorption by the atmosphere. In the putative companion, instead, neither line is visible at the same wavelength. Instead, we detected at 8604 and 8631 Å, two narrow emission lines compatible with redshifted H and [N ii]6584 at . In principle, the H region and the [O iii] 5007 Å line would also be visible in Galaxy B, but they are not detected in the spectrum, possibly suggesting the presence of internal absorption. Regardless of the reason these are not detected, Galaxy B is definitely not at the same redshift as SBS .
4 Analysis
4.1 Image Processing
The data reduction process for producing the science image follows the steps described by Georgiev et al. (2019) in their ARGOS commissioning paper. After a basic reduction, correcting for non-linearity and persistence effects, bad pixel masking and flat fielding, sky frames were created from exposures spaced about 10 minutes apart in order to negate effects by the rapidly-varying Near-Infrared (NIR) atmosphere. The best 164 exposures were used in this case. Bright sources, such as stars and galaxies (with pixel values above the background) were masked prior to combination. Several sky frames were used to subtract the sky in a group of exposures spaced within about 15 minutes.
Due in part to the extended spiral galaxy nearby and its effect on the flatfielding, the sky in source-free areas varies somewhat in the region around the AGN. At 15 arcsec east of the AGN, it has a mean of 1.47 Analog-to-Digital Units (ADU), 16 arcsec west of the AGN, the mean is 2.24 ADU, and 22 arcsec south of the AGN, the mean is 3.03 ADU. The large galaxy is to the north of the AGN, so no measurement is made there. The statistics for these regions is listed in Table 1. To minimize these effects in the analysis, we restrict the model fit (§4.3) to a region close to the AGN.
| (1) | (2) | (3) | (4) | (5) | (6) |
|---|---|---|---|---|---|
| Region | Mean | Minimum | Maximum | Distance | |
| (ADU) | (ADU) | (ADU) | (ADU) | (arcsec) | |
| East | 1.47 | -18.41 | 21.81 | 4.52 | 15 |
| West | 2.24 | -20.32 | 16.1 | 4.41 | 16 |
| South | 3.03 | -17.02 | 17.25 | 4.35 | 22 |
| 1C residual | -83.49 | 101.12 | 5.79 | 0 | |
| 2C residual | -65.23 | 97.17 | 5.58 | 0 |
4.2 Photometric Calibration
We calibrated the J-band magnitude system using the 2-Micron All Sky Survey (2MASS) Extended Source Catalog and Point Source Catalog. Instrumental magnitudes for sources from our image were extracted with Source Extractor and compared to the 2MASS catalogs. Excluding the AGN (which is variable), Galaxy B (which is merged with the AGN in 2MASS), and one bright star that is saturated, nine sources in this field are found in the Point Source Catalog (PSC). Two of these are spiral galaxies and are also listed in the Extended Source Catalog (XSC). We adopt the XSC magnitudes for these two and the PSC magnitudes for the remaining seven. With these sources, we obtain a magnitude calibration with a standard deviation of mag.
4.3 Host + Nucleus Modeling
Because this active galaxy has a bright nucleus, any study of its morphology requires a fit to both the nucleus–modeled with the point spread function (PSF)–and the host galaxy. We use galfit (Peng et al., 2011) to perform a 2-dimensional fit to the image, simultaneously modeling the nucleus, the host galaxy, and Galaxy B, with the sky fitted as a constant value. Because of the spatial variations in the sky described in §4.1, we perform the fit over a region spanning pixels (11.911.9 arcsec), centred on the AGN. This is wide enough to cover the visible extent of the AGN host and Galaxy B but narrow enough so that the sky variation within the region is small. The large, foreground spiral seen in the north corner of Fig. 1 and the region of brighter sky to the south of Galaxy B (which may include a low-surface-brightness source) are both masked out of the fit, as are smaller, dimmer clumps. The PSF model is constructed as a composite of 16 isolated stars from across the field of view and has a Full Width at Half Maximum of 2.6 arcsec. It spans pixels (2.22.2 arcsec) and is put into galfit with normal sampling.
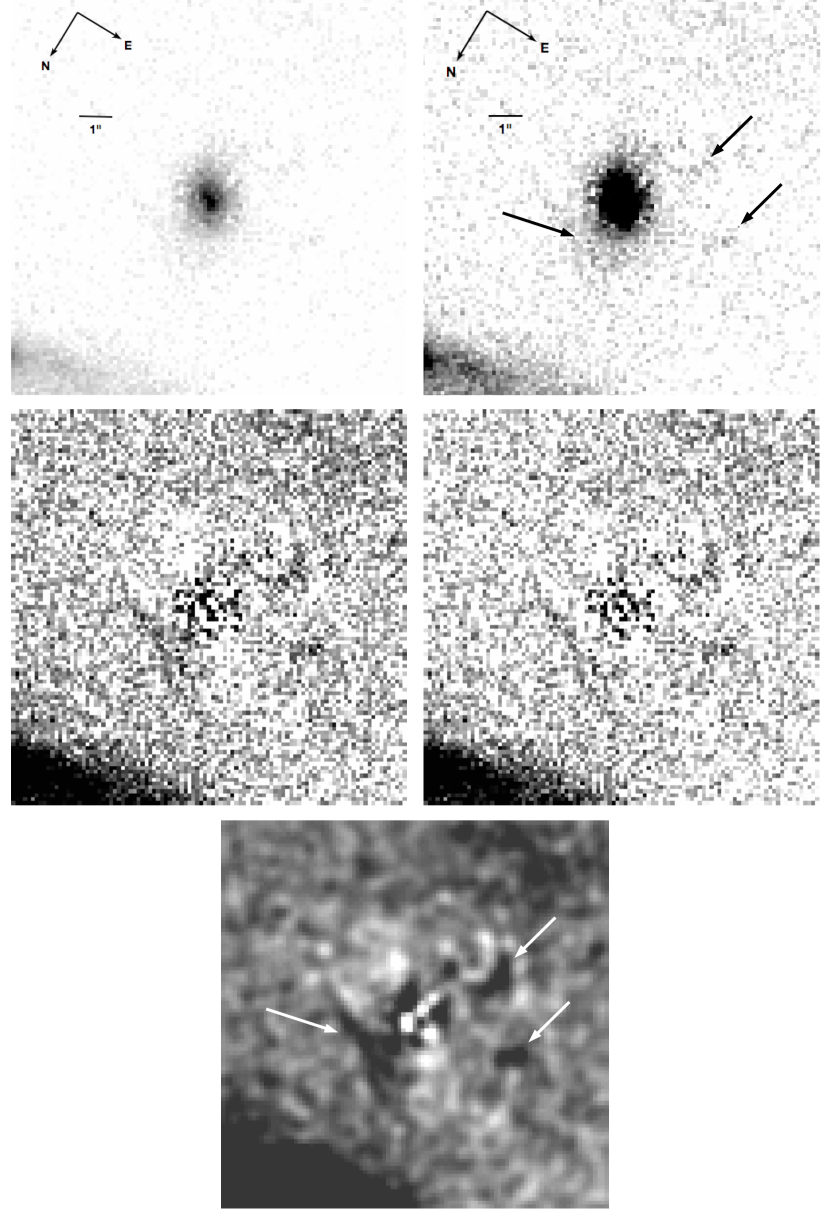
To determine the morphology, two models of the host galaxy are tried. Model 1C is a one-component fit to the AGN host using a Sérsic model, while model 2C performs a two-component fit to the host, using a Sérsic bulge and an exponential disc. The Sérsic index, , is a free parameter in both cases. Since we are not interested in the details of its morphology, Galaxy B is modeled with only single Sérsic component (with the index as a free parameter) in both cases, which leaves acceptably low residuals. Including separate bulge and disc components results in unreasonable fits. The sky is modeled as a constant value; allowing it to ‘tilt’ across the field does not improve the fit. The host galaxy is shown in the PSF-subtracted residual image in Fig. 3, along with the total residuals, formed by subtracting the complete model from the image. The fitting results are summarized in Table 2 for the AGN and Table 3 for Galaxy B, and the statistics of the residuals are listed in Table 1.
Absolute magnitudes and physical scales for both galaxies are presented in Table 4, using a cosmology of , , and . At the AGN’s redshift, the scale is 6.59 kpc/arcsec, while for Galaxy B, it is 4.53 kpc/arcsec. To calculate the absolute magnitudes, we adopt -corrections for the AGN nucleus from Glikman, Helfand, & White (2006) and for the AGN host and Galaxy B from Mannucci et al. (2001). For the purposes of the -correction, we assume the AGN host is an E-type galaxy for the 1C model and an Sa-type galaxy for the 2C model, while Galaxy B is treated as an Sa type.
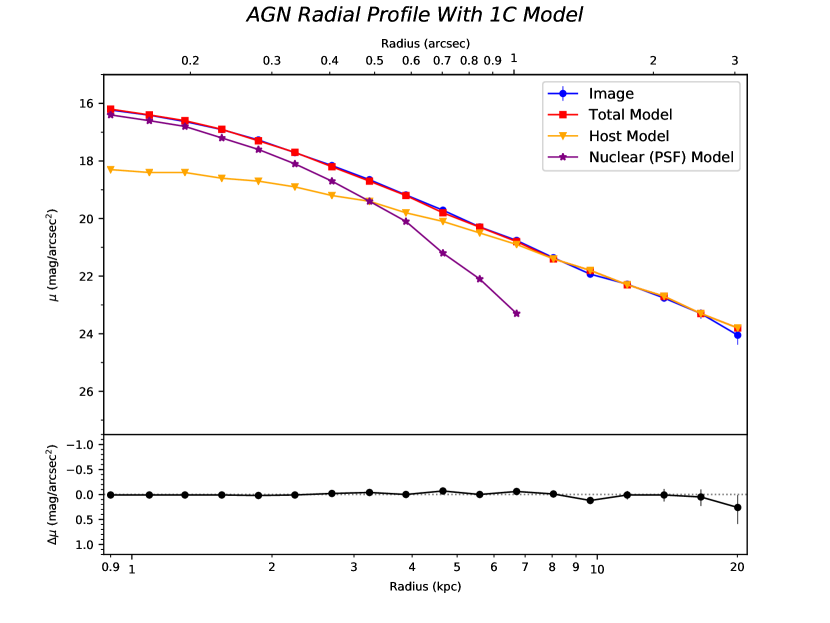
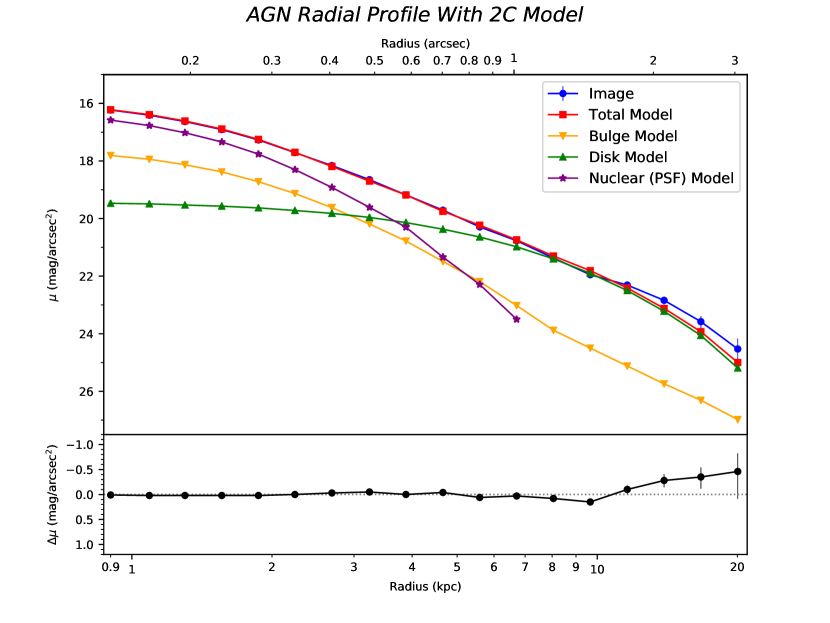
In addition to the two-dimensional modeling, we examine the AGN’s radial profile and isophote structure. Fig. 4 and Fig. 5 show the radial surface brightness () profiles of the AGN for the 1C and 2C models, respectively, measured using iraf’s ellipse task with circular annuli. Plots are included of the image (with the sky and the Galaxy B model subtracted), the total model, and the separate components of that model–the host model (1C: Sérsic only; 2C: Sérsic bulge and exponential disc) and the nuclear model (stellar PSF). The profile is taken out to an angular distance of 3 arcsec from the centre of the nucleus, corresponding to a projected distance of 20 kpc at the redshift of the source. The bottom portion of the figure shows the difference between the image and the total model for each isophote: .
In Fig. 6, iraf’s ellipse task is also used to measure the Fourier parameter of the isophotes of the PSF-subtracted host. Negative values of indicate boxiness in a given isophote, a more rectangular deviation from an ellipse, while positive values indicate discy, lemon-shaped isophotes. An overall discy trend to the isophotes is associated with the presence of galactic discs. The convolution of the bright centre of the galaxy with the PSF biases the shape of the innermost isophotes, so we do not plot isophotes closer than 0.4 arcsec (2.6 kpc) from the centre. The vertical axis is scaled by a factor of , and the dashed horizontal line at separates the positive (discy) values from negative (boxy) values.
| (1) | (2) | (3) | (4) | (5) | (6) | (7) | (8) | (9) | (10) | (11) |
|---|---|---|---|---|---|---|---|---|---|---|
| Model | Nucleus (PSF) | Bulge | disc | |||||||
| (mag) | (mag) | () | (mag) | () | ||||||
| 1C | 1.2 | 20.3 [] | 20.3 [] | 1.1 [0.1] | 3.4 | 0.41 | – | – | – | – |
| 2C | 1.1 | 20.4 [] | 21.3 [] | 0.1 [] | 7.3 | 0.86 | 20.9 [] | 0.6 [] | (1) | 0.30 |
| (1) | (2) | (3) | (4) | (5) |
|---|---|---|---|---|
| Model | ||||
| (mag) | () | |||
| 1C | 20.1 [] | 1.2 [] | 2.3 | 0.33 |
| 2C | 20.1 [] | 1.1 [] | 2.2 | 0.34 |
| (1) | (2) | (3) | (4) | (5) | (6) | (7) | (8) | (9) | (10) |
|---|---|---|---|---|---|---|---|---|---|
| Model | Nucleus | Bulge | disc | Galaxy B | |||||
| (mag) | (mag) | (kpc) | (mag) | (kpc) | (mag) | (mag) | (kpc) | ||
| 1C | -22.4 | -22.7 | 7.5 [0.5] | – | – | 1.00 | -22.7 | -21.1 | 5.2 [0.2] |
| 2C | -22.3 | -21.6 | 0.7 [0.1] | -22.0 | 4.0 [0.1] | 0.41 | -22.6 | -21.1 | 5.1 [0.2] |
4.4 Black Hole Mass
We use three methods to determine the central black hole mass–the correlation with the host bulge, and two correlations with the Sérsic index. Detailed results are shown in Table 5. The relationship between host spheroidal luminosity and black hole mass is given by Marconi & Hunt (2003) as
| (1) |
where for the -band, , , , represents the black hole mass, is the Sun’s mass, and is the -band spheroidal luminosity. In terms of spheroidal magnitude, , this becomes
| (2) |
Using for the Sun’s magnitude, we obtain a black hole mass of for the 1C model and for the 2C model.
The radial profile method of Graham & Driver (2007) correlates the Sérsic index, , with the black hole mass. They fit both linear (their Equ. 4) and quadratic (their Equ. 7) relationships to the data. The linear fit gives
| (3) |
while the quadratic fit is
| (4) |
As shown in Table 5, model 1C leads to a mass of for the linear fit or for the quadratic fit. Since the two-component model bulge is smaller than the PSF width, we do not calculate profile-derived masses for model 2C.
| Method | Model | |
|---|---|---|
| Bulge luminosity | 1C | 8.19 [0.08] |
| Bulge luminosity | 2C | 7.70 [0.10] |
| Sérsic linear | 1C | 7.96 [0.12] |
| Sérsic quadratic | 1C | 8.16 [0.13] |
5 Discussion
5.1 Host Galaxy
In interpreting the relationship of these gamma-ray emitters to the broader population of NLS1, it is important to compare their morphologies. But very few of the gamma-ray emitters’ hosts have been resolved, because the fraction of NLS1 known to emit gamma-rays peaks at , where their hosts become harder to distinguish, and high-resolution observations such as these are necessary. Narrow-Line Seyfert 1s at low redshift have been found to reside primarily in spiral galaxies, similar to the overall population of Seyfert 1s. Crenshaw, Kraemer, & Gabel (2003) and Deo, Crenshaw, & Kraemer (2006) have only one clear E type in their NLS1 samples. Olguín-Iglesias et al. (2017) has one classified as SB0.
How does SBS ’s morphology compare to lower-redshift NLS1? As shown in Table 2, the one-component (1C) and two-component (2C) models of the AGN have similar goodness of fit, with a small improvement in the 2C model. The one-component model finds the AGN host galaxy to be roughly of the de Vaucouleurs profile, with an overall Sérsic index of 3.4. The two-component model uses an exponential disc and finds the bulge to have a steeper Sérsic index of 7.3, but the bulge is smaller than the PSF width, so we cannot do much interpretation of it. The bulge-to-total ratio of 0.41 (and to the extent we can interpret it, the bulge Sérsic index) is consistent with an Sab Hubble type (Weinzirl et al., 2009). Using the 6dF luminosity function of Jones et al. (2006) and a Hubble constant of km/s/Mpc, we obtain , while the host galaxy of SBS has a total magnitude of -22.7 (1C model) or -22.6 (2C)222The small discrepancy comes from the different -corrections for the morphologies.. This puts the host at 1 mag fainter than .
The radial profile in Fig. 4 shows a good fit of the 1C model to the image out to 3 arcsec (20 kpc). Beyond this point, the variations in the background produce some regions of negative values in the sky-subtracted image, which we can’t display in magnitude form. The 2C model (Fig. 5) gives a close fit over most of the isophotes but shows some divergence at the outermost radii, where the model is too faint. Still, the 2C model has a slightly better reduced than the 1C model in the two-dimensional fit.
We next examine the radial variation of the isophotes’ parameter (Fig. 6), which is associated with boxy (negative) or discy (positive) isophotes. We disregard the central 0.3 arcsec, where the isophote shapes are likely to be dominated by convolution with the PSF. We see that has a roughly-peaked distribution, rising from close to the centre, to large positive values in the kpc region, beyond which it declines irregularly. Though the graph is not smooth, under the criteria of Bender et al. (1989), we can assign a characteristic value of , and this strengthens the evidence for a disc.
In Fig. 3, we show residuals created by subtracting the PSF and Galaxy B models (top row) and the total model (middle and bottom rows) from the image. In the top row, we can see more clearly some clumps of material, marked by arrows. The lower two are just visible in Fig. 1 but are clearer in the residual, while the third (southeast of the AGN) is normally covered by Galaxy B until that model is subtracted. The extended features to the northwest and southeast of the AGN could be spiral arms. They’re on opposite sides, at about the same distance from the nucleus, but their shapes aren’t symmetrical and could show a disturbance. These three features are only of low significance ( above sky level), and it would be interesting to see them in a deeper image.
Another interpretation of the hook-shaped pattern southeast of the AGN could be as a feature of Galaxy B. The outer isophotes of this galaxy have a slightly asymmetrical appearance to the eye, extending a bit farther to the west than the east. Our attempts to account for this in galfit (such as adding Fourier components or a non-concentric bulge and disc) either failed to improve the fit or kept it from converging.
The residual statistics for the unmasked regions are listed in the bottom two rows of Table 1. There is no systematic offset from the sky level, though there is a higher standard deviation compared to the neighboring source-free regions. Some of this comes from noise in the PSF model for the nucleus, which is scaled in brightness during the fit. The noisy disc at the centre of the fitting region in Fig. 3 (middle row) results from the scaled-up PSF noise and extends out to a radius of 1 arcsec. The 2C model leaves a residual with a slightly lower standard deviation than the 1C model does, but then its PSF (which is a source of noise) is fainter by 0.1 mag. The brighter region to the south of Galaxy B, an area masked from the model fit, includes some low-surface-brightness sources that are just outside the cropped field.
So in its morphology, SBS does not appear obviously different from the common spiral galaxies of low-redshift NLS1. The bulge + disc model fits it slightly better than the spheroidal model, the isophotes show a discy structure in their Fourier components, and there are possible indications of spiral structure. Thus we tentatively conclude that the host of SBS is a bulge + disc galaxy. Either deeper ground-based observations with full adaptive optics or space-based observations with the Hubble Space Telescope or the James Webb Space Telescope would improve the resolution and the model of the galactic bulge, which is unresolved here.
5.2 AGN Environment
We considered whether or not SBS has a companion, perhaps involved in a merger that could have triggered its active phase. In Fig. 1, we see that Galaxy B is separated from SBS by a projected distance of 2.45 arcsec. Their proximity has caused problems in the past. In fact, SBS was once (Hewitt & Burbidge, 1989) placed at a redshift of , due to the contamination of its spectrum by Galaxy B, whose redshift was roughly modeled as 0.235 in prior papers. At the resolution of the LBT, there is still a very slight overlap, and the possibility of a merger is interesting, given the role mergers sometimes play in triggering AGN.
From our spectroscopy (§3.2), we find the redshift of SBS is , using H and [OIII] lines, but the redshift of Galaxy B is 0.311, using H and [NII] lines. So the two galaxies are only visual companions, which are not interacting with each other.
Some of the three features marked in Fig. 3 could be dwarf companions of the AGN. If so, it would be consistent with the studies that show a majority of -NLS1 have signs of mergers or interactions (Komossa, 2018). The small clump to the east lies at a projected distance of 23 kpc (3.5 arcsec) from the AGN. We have leaned towards interpreting the longer features to the northwest and southeast as arms of the AGN host, but it is possible they are also companions, if they are at the AGN redshift at all. A 3-pixel Gaussian smoothing is applied to the image in the bottom row to show them better.
5.3 Black Hole Mass
Earlier mass estimates for SBS have come from a variety of methods. Zhou et al. (2005) puts its mass at using the Broad-Line Region (BLR) H linewidth, using the – relation with the Narrow-Line Region [OIII] to get stellar motion in the bulge, or using the – relation with the elliptical galaxy mass-to-light ratio and a host template spectrum. Yuan et al. (2008) obtain using the BLR H linewidth, which is close to the calculated by Foschini et al. (2015). Using the estimates of black hole mass uncertainties by Vestergaard (2004), both of these are consistent with the non-BLR masses of Zhou et al. (2005). Shen et al. (2011) derive mass estimates for SBS based on Sloan Digital Sky Survey spectra, including H and MGII-derived masses by a variety of calibrations. These range from –. These are slightly higher than the masses discussed above, but given their uncertainties, the low end of this range is consistent with the H estimate of Zhou et al. (2005).
As mentioned in §1, it has been argued that the narrow widths of NLS1s’ permitted lines might not be due to smaller black hole masses but to geometry–that these galaxies are viewed nearly pole-on to a disc-like BLR, minimizing the Doppler effects and leading to an underestimate of the black hole mass. In gamma-ray emitting NLS1s, at least, we are more likely to have a nearly pole-on view of the black hole, since we must be looking along the radio jet. But since we are able to resolve much of the host galaxy in the case of SBS , we can derive measures of the black hole mass that are independent of the BLR flattening and orientation, using the correlations with bulge luminosity and radial profile.
Being derived from the host galaxy, the masses we calculate in Table 5 are independent of BLR geometry and viewing angle. Using our preferred (bulge + disc) host morphology, the mass-luminosity relation of the bulge gives us the lowest of the four mass estimates. At , it is comparable to the upper end of the range of masses from the prior work on this AGN. The mass-luminosity relation assumes a classical bulge, and pseudobulges tend to have smaller black hole masses for their luminosity (Mathur et al., 2012). Since our bulge is effectively unresolved (the effective radius is narrower than the PSF), we don’t know if it is classical or pseudo, and so the black hole mass could be lower. On the other hand, if we accept the one-component model, then we count the luminosity of the entire host galaxy as the ‘bulge,’ and we obtain our highest estimate, . The Sérsic index methods applied to the one-component model give results that are close to this upper value, but because the bulge in the two-component model is so narrow, we don’t try to derive a mass from its profile. So the biggest variation in the mass estimates comes from adopting either the one or the two-component model. In the end, the low end of our mass estimates (our preferred model) is consistent with previous results, while the high end is a factor of two or three times larger than these. This indicates that the H -derived masses for this source are not substantially underestimated.
How does the mass of SBS compare with other NLS1 in general and gamma-ray emitters in particular? Based on a sample selected by Rakshit et al. (2017), Berton et al. (2020) report on their study of 3933 NLS1 whose H lines fit a Gaussian or Lorentzian profile, using SDSS data extending out to a redshift of . Of these, none has a black hole mass greater than . Even our lowest mass estimate for SBS would make it more massive than all but 1.8 per cent (72 out of 3932) of the complete Berton et al. (2020) sample. A better comparison would account for the variation in mass distribution with redshift. Restricting ourselves to sources within a redshift range of from SBS (), we see that it is, at minimum, more massive than all but 4.5 per cent (35 out of 776) of NLS1 in that range. Regarding gamma-ray emitting NLS1, the 10 other -NLS1 with measured masses (Foschini et al., 2015) range from up to . Our mass calculations for SBS puts it at least in the upper half of this group (more massive than 5 out of 10, at the low end), and at the high end, more massive than all of the others.
Komossa (2018) compiles mass estimates for two -NLS1 (1H and PKS ) whose black holes have been measured with several techniques, including host galaxy correlations (original host analyses by León Tavares et al. 2014 and D’Ammando et al. 2018, respectively), single-epoch H spectroscopy, SED modeling, and others. It is interesting to note that the host-galaxy-derived methods return much higher masses than the single-epoch H spectra in those cases: by one order of magnitude for 1H and by two orders of magnitude for PKS . In fact, the host galaxy correlations lead to the highest mass estimates of any of the methods on the list. Since single-epoch spectra are orientation-dependent while the host galaxy methods are not, one possibility is that the spectra are underestimating the black hole mass. However, the H results in these two cases are more consistent with mass results from several other methods, as we expect. The consistency is good for 1H ; in the case of PKS , the H result returns the lowest mass of four methods across seven studies, but the greatest difference is between H and the host galaxy result.
On the other hand, the host galaxy methods could be overestimating the black hole mass. León Tavares et al. (2014) find similar goodness-of-fit for the elliptical (bulge) and spiral (bulge + disc) models for 1H ’s host, and they choose the elliptical model for simplicity. The bulge in the -band spiral model is 1.5 mag fainter than in the elliptical model, and it has a Sérsic index of , which is consistent with a pseudobulge. For PKS , D’Ammando et al. (2018) find a lower for their spiral model than the elliptical model. Choosing the spiral would make the bulge 0.4 mag fainter. The Sérsic index is fixed at in this case, so we cannot tell from their report if the bulge would be classical or a pseudobulge. However, Olguín-Iglesias, Kotilainen, & Chavushyan (2020) find a spiral host with a bulge whose Sérsic index is close to 1, indicating a pseudobulge and decreasing the black hole mass. In both of these cases, then, using the spiral model to derive the black hole mass would be justifiable, and it would return a lower result.
It would be interesting to make more general comparisons between the masses of the known -NLS1 and the non--emitters, but we must be cautious using even the H -derived masses for each group, because of different assumed values for the virial factor, . For example, the Berton et al. (2020) sample of NLS1 uses , while the -NLS1 masses of Foschini et al. (2015) are calculated using . Since is related, in part, to the inclination angle of the Broad-Line Region, and the -NLS1 must be viewed close to pole-on, then these different values may be appropriate. But more work is needed, and it would be good to have a larger set of orientation-independent measures of black hole mass as a comparison.
It should be noted that there is a very strong statistical argument that the majority of Narrow-Line Seyfert 1s cannot have BH masses as high as Broad-Line Seyfert 1s (BLS1) and simply be underestimated due to their geometry. As pointed out by Komossa et al. (2006), if NLS1s were just the face-on analogues of BLS1s and narrower Balmer line widths because the Broad Line Region was flattened and viewed close to pole-on, then we should see a large fraction of beamed NLS1s. In fact, more NLS1s would be seen as beamed than BLS1s, because they would be the population with more face-on sources. Yet the opposite is the case. Studies consistently find that the fraction of radio-loud sources is smaller in NLS1s.
So SBS has a massive black hole, larger than most NLS1, but consistent with estimates of the other gamma-ray emitting NLS1. The H -derived masses for this source are not greatly underestimated.
5.4 Variability
SBS shows strong variability at all wavelengths, from radio (e.g., Angelakis et al. 2015) to mid-IR (see Caccianiga et al. 2015) to -rays (see Foschini et al. 2015). Comparing the photometry of SBS between our observations and the 2MASS Extended Source Catalog, we see the AGN nucleus has dimmed significantly since the 2MASS observation of 1998 December 23. The 2MASS observations are not able to resolve the AGN and Galaxy B, so we subtract the light we measure for the host galaxies of these two and find the nucleus in 1998 had . So it has dimmed by 4.4 mag to the we observed on 2016 December 15. SBS is known to have exceptional changes in the optical (e.g., the 4-magnitude variation in about a month recorded by Arp et al. 1979), so this level of variability is not unusual for this object and is well within the historical range.
6 Conclusions
We observed the Narrow-Line Seyfert 1 galaxy SBS in the -band with the LUCI1 camera, aided by laser-guide ground-layer adaptive optics system, ARGOS, on the Large Binocular Telescope. The galaxy has a significant gamma-ray emission, likely from a relativistic jet. Very little is known about the host galaxies of the -NLS1 and how they fit into the broader population of normal NLS1.
The host galaxy is resolved. There is a slight preference for the spiral model over the elliptical, and we see evidence for what may be spiral arms. This and its discy isophotes argue for a bulge + disc host galaxy, which is consistent with most NLS1 at lower redshift, even though relativistic jets are more common in ellipticals. Space-based observations from the Hubble Space Telescope or the James Webb Space Telescope would be useful to improve the resolution of the host, model the bulge, and look for signs of galaxy interactions.
Using correlations between black hole mass on the one hand and bulge luminosity and Sérsic index on the other, we find it harbors a central black hole with a mass likely around , but possibly as high as . These measurements are independent of the viewing angle to the Broad Line Region and therefore avoid any biases due to BLR geometry, and they indicate that the H -derived masses for this object are not greatly underestimated. The mass lies at the high end of the normal NLS1 range but is consistent with other -NLS1 masses.
Acknowledgements
T. S. H. would like to thank Luigi Foschini for many useful discussions, especially on the interpretation of the mass.
S. A. acknowledges financial support from the Centre for Research & Development in Mathematics and Applications (CIDMA) strategic project UID/MAT/04106/2019 and from Enabling Green E-science for the Square Kilometre Array Research Infrastructure (ENGAGESKA), POCI-01-0145-FEDER-022217, funded by the Programa Operacional Competitividade e Internacionalização (COMPETE 2020) and FCT, Portugal.
This paper is based on observations made with the Large Binocular Telscope and the Nordic Optical Telescope. The Large Binocular Telescope is managed by the Large Binocular Telescope Observatory Collaboration, headquartered at the University of Arizona, in Tucson, Arizona, U.S.A. The Nordic Optical Telescope is operated by the Nordic Optical Telescope Scientific Association at the Observatorio del Roque de los Muchachos, La Palma, Spain, of the Instituto de Astrofisica de Canarias. Our research has made use of the NASA/IPAC Extragalactic Database (NED), which is funded by the National Aeronautics and Space Administration and operated by the California Institute of Technology.
Data Availability
The data underlying this article will be shared on reasonable request to the corresponding author.
References
- Angelakis et al. (2015) Angelakis E., Fuhrmann L., Marchili N., Foschini L., Myserlis I., Karamanavis V., Komossa S., et al., 2015, A&A, 575, A55
- Arp et al. (1979) Arp H., Sargent W. L. W., Willis A. G., Oosterbaan C. E., 1979, ApJ, 230, 68
- Abdo et al. (2009) Abdo A. A., Ackermann M., Ajello M., Axelsson M., Baldini L., Ballet J., Barbiellini G., et al., 2009, ApJ, 699, 976
- Antón, Browne, & Marchã (2008) Antón S., Browne I. W. A., Marchã M. J., 2008, A&A, 490, 583
- Berton et al. (2018) Berton M., Congiu E., Järvelä E., Antonucci R., Kharb P., Lister M. L., Tarchi A., et al., 2018, A&A, 614, A87
- Berton et al. (2019) Berton M., Congiu E., Ciroi S., Komossa S., Frezzato M., Di Mille F., Antón S., et al., 2019, AJ, 157, 48
- Berton et al. (2020) Berton M., Björklund I., Lähteenmäki A., Congiu E., Järvelä E., Terreran G., La Mura G., 2020, CoSka, 50, 270
- Bender et al. (1989) Bender R., Surma P., Doebereiner S., Moellenhoff C., Madejsky R., 1989, A&A, 217, 35
- Boller et al. (1997) Boller T., Brandt W. N., Fabian A. C., Fink H. H., 1997, MNRAS, 289, 393
- Boroson & Green (1992) Boroson T. A., Green R. F., 1992, ApJS, 80, 109
- Brandt et al. (1999) Brandt W. N., Boller T., Fabian A. C., Ruszkowski M., 1999, MNRAS, 303, L53
- Caccianiga et al. (2015) Caccianiga A., Antón S., Ballo L., Foschini L., Maccacaro T., Della Ceca R., Severgnini P., et al., 2015, MNRAS, 451, 1795
- Calderone et al. (2013) Calderone G., Ghisellini G., Colpi M., Dotti M., 2013, MNRAS, 431, 210
- Chiaberge et al. (2015) Chiaberge M., Gilli R., Lotz J. M., Norman C., 2015, ApJ, 806, 147
- Crenshaw, Kraemer, & Gabel (2003) Crenshaw D. M., Kraemer S. B., Gabel J. R., 2003, AJ, 126, 1690
- D’Ammando et al. (2017) D’Ammando F., Acosta-Pulido J. A., Capetti A., Raiteri C. M., Baldi R. D., Orienti M., Ramos Almeida C., 2017, MNRAS, 469, L11
- D’Ammando et al. (2018) D’Ammando F., Acosta-Pulido J. A., Capetti A., Baldi R. D., Orienti M., Raiteri C. M., Ramos Almeida C., 2018, MNRAS, 478, L66
- Decarli et al. (2008) Decarli R., Dotti M., Fontana M., Haardt F., 2008, MNRAS, 386, L15
- Deo, Crenshaw, & Kraemer (2006) Deo R. P., Crenshaw D. M., Kraemer S. B., 2006, AJ, 132, 321
- Donato & Perkins (2011) Donato D., Perkins J. S., 2011, ATel, 3452
- Ferrarese & Merritt (2000) Ferrarese L., Merritt D., 2000, ApJL, 539, L9
- Foschini (2011) Foschini L., 2011, nlsg.conf, 24
- Foschini et al. (2015) Foschini L., Berton M., Caccianiga A., Ciroi S., Cracco V., Peterson B. M., Angelakis E., et al., 2015, A&A, 575, A13
- Gallo (2018) Gallo L., 2018, rnls.conf, 34
- Georgiev et al. (2019) Georgiev I. Y., Neumayer N., Gässler W., Rabien S., Busoni L., Bonaglia M., Ziegleder J., et al., 2019, MNRAS, 484, 3356
- Glikman, Helfand, & White (2006) Glikman E., Helfand D. J., White R. L., 2006, ApJ, 640, 579
- Goodrich (1989) Goodrich R. W., 1989, ApJ, 342, 224
- Graham & Driver (2007) Graham A. W., Driver S. P., 2007, ApJ, 655, 77
- Grupe & Mathur (2004) Grupe D., Mathur S., 2004, ApJL, 606, L41
- Hewitt & Burbidge (1989) Hewitt A., Burbidge G., 1989, ApJS, 69, 1
- Järvelä, Lähteenmäki, & Berton (2018) Järvelä E., Lähteenmäki A., Berton M., 2018, A&A, 619, A69
- Järvelä et al. (2020) Järvelä E., Berton M., Ciroi S., Congiu E., Lähteenmäki A., Di Mille F., 2020, A&A, 636, L12
- Jones et al. (2006) Jones D. H., Peterson B. A., Colless M., Saunders W., 2006, MNRAS, 369, 25
- Komossa et al. (2006) Komossa S., Voges W., Xu D., Mathur S., Adorf H.-M., Lemson G., Duschl W. J., et al., 2006, AJ, 132, 531
- Komossa (2018) Komossa S., 2018, Revisiting narrow-line Seyfert 1 galaxies and their place in the Universe (NLS1-2018), 15
- Kormendy & Ho (2013) Kormendy J., Ho L. C., 2013, ARA&A, 51, 511
- Kotilainen et al. (2016) Kotilainen J. K., León-Tavares J., Olguín-Iglesias A., Baes M., Anórve C., Chavushyan V., Carrasco L., 2016, ApJ, 832, 157
- Krongold, Dultzin-Hacyan, & Marziani (2001) Krongold Y., Dultzin-Hacyan D., Marziani P., 2001, AJ, 121, 702
- Laor (2000) Laor A., 2000, ApJL, 543, L111
- Lanz et al. (2016) Lanz L., Ogle P. M., Alatalo K., Appleton P. N., 2016, ApJ, 826, 29
- León Tavares et al. (2014) León Tavares J., Kotilainen J., Chavushyan V., Añorve C., Puerari I., Cruz-González I., Patiño-Alvarez V., et al., 2014, ApJ, 795, 58
- Lister et al. (2016) Lister M. L., Aller M. F., Aller H. D., Homan D. C., Kellermann K. I., Kovalev Y. Y., Pushkarev A. B., et al., 2016, AJ, 152, 12
- Magorrian et al. (1998) Magorrian J., Tremaine S., Richstone D., Bender R., Bower G., Dressler A., Faber S. M., et al., 1998, AJ, 115, 2285
- Mannucci et al. (2001) Mannucci F., Basile F., Poggianti B. M., Cimatti A., Daddi E., Pozzetti L., Vanzi L., 2001, MNRAS, 326, 745
- Maoz et al. (1993) Maoz D., Bahcall J. N., Doxsey R., Schneider D. P., Bahcall N. A., Lahav O., Yanny B., 1993, ApJ, 402, 69
- Marconi & Hunt (2003) Marconi A., Hunt L. K., 2003, ApJL, 589, L21
- Mathur (2000) Mathur S., 2000, MNRAS, 314, L17
- Mathur et al. (2012) Mathur S., Fields D., Peterson B. M., Grupe D., 2012, ApJ, 754, 146
- Maune et al. (2014) Maune J. D., Eggen J. R., Miller H. R., Marshall K., Readhead A. C. S., Hovatta T., King O., 2014, ApJ, 794, 93
- Morganti et al. (2015) Morganti R., Oosterloo T. A., Oonk J. B. R., Frieswijk W., Tadhunter C. N., 2015, ASPC, 499, 125
- Nottale (1986) Nottale L., 1986, A&A, 157, 383
- Olguín-Iglesias et al. (2017) Olguín-Iglesias A., Kotilainen J. K., León Tavares J., Chavushyan V., Añorve C., 2017, MNRAS, 467, 3712
- Olguín-Iglesias, Kotilainen, & Chavushyan (2020) Olguín-Iglesias A., Kotilainen J., Chavushyan V., 2020, MNRAS, 492, 1450
- Orban de Xivry et al. (2011) Orban de Xivry G., Davies R., Schartmann M., Komossa S., Marconi A., Hicks E., Engel H., et al., 2011, MNRAS, 417, 2721
- Osterbrock & Pogge (1985) Osterbrock D. E., Pogge R. W., 1985, ApJ, 297, 166
- Paliya et al. (2016) Paliya V. S., Rajput B., Stalin C. S., Pandey S. B., 2016, ApJ, 819, 121
- Pan et al. (2018) Pan H.-W., Yuan W., Yao S., Komossa S., Jin C., 2018, ApJ, 866, 69
- Page et al. (2012) Page M. J., Symeonidis M., Vieira J. D., Altieri B., Amblard A., Arumugam V., Aussel H., et al., 2012, Natur, 485, 213
- Peng et al. (2011) Peng C. Y., Ho L. C., Impey C. D., Rix H.-W., 2011, ascl.soft
- Rakshit et al. (2017) Rakshit S., Stalin C. S., Chand H., Zhang X.-G., 2017, ApJS, 229, 39
- Romano et al. (2018) Romano P., Vercellone S., Foschini L., Tavecchio F., Landoni M., Knödlseder J., 2018, MNRAS, 481, 5046
- Salucci et al. (2000) Salucci P., Ratnam C., Monaco P., Danese L., 2000, MNRAS, 317, 488
- Sbarrato et al. (2018) Sbarrato T., Dotti M., Ghirlanda G., Tavecchio F., 2018, A&A, 616, A43
- Schneider et al. (2003) Schneider D. P., Fan X., Hall P. B., Jester S., Richards G. T., Stoughton C., Strauss M. A., et al., 2003, AJ, 126, 2579
- Shen et al. (2011) Shen Y., Richards G. T., Strauss M. A., Hall P. B., Schneider D. P., Snedden S., Bizyaev D., et al., 2011, ApJS, 194, 45
- Vestergaard (2004) Vestergaard M., 2004, ASPC, 311, 69
- Weinzirl et al. (2009) Weinzirl T., Jogee S., Khochfar S., Burkert A., Kormendy J., 2009, ApJ, 696, 411
- Xu et al. (2012) Xu D., Komossa S., Zhou H., Lu H., Li C., Grupe D., Wang J., et al., 2012, AJ, 143, 83
- Yao et al. (2015) Yao S., Yuan W., Komossa S., Grupe D., Fuhrmann L., Liu B., 2015, AJ, 150, 23
- Yuan et al. (2008) Yuan W., Zhou H. Y., Komossa S., Dong X. B., Wang T. G., Lu H. L., Bai J. M., 2008, ApJ, 685, 801
- Zhou et al. (2005) Zhou H.-Y., Wang T.-G., Dong X.-B., Li C., Zhang X.-G., 2005, ChJAA, 5, 41
- Zhou et al. (2006) Zhou H., Wang T., Yuan W., Lu H., Dong X., Wang J., Lu Y., 2006, ApJS, 166, 128
- Zhou et al. (2007) Zhou H., Wang T., Yuan W., Shan H., Komossa S., Lu H., Liu Y., et al., 2007, ApJL, 658, L13