An Autonomous Approach to Measure Social Distances and Hygienic Practices during COVID-19 Pandemic in Public Open Spaces
Abstract
Coronavirus has been spreading around the world since the end of 2019. Due to its high risk of danger causing severe acute respiratory syndrome that could be lethal, human behavior and activities in a crowded environment (e.g. public open spaces) need to be studied. Hence, there is a great need to ensure the safety of public use of park facilities in public open spaces where people’s activity and density might be higher due to the needs after stay-at-home executive orders. This work provides a scalable sensing approach to detect physical activities within public open spaces and monitor adherence to social distancing guidelines suggested by the US Centers for Disease Control and Prevention (CDC). A deep learning-based computer vision sensing framework is designed to investigate the careful and proper utilization of parks and their facilities with hard surfaces (e.g. benches, fence poles, and trash cans) using video feeds from a pre-installed surveillance camera network. The sensing framework consists of CNN-based object detector, multi-target tracker, mapping module, and a group reasoning module. Recognition modules of hard-surface contact and facial clothing/ mask wearing are also incorporated to further analyze the ratio of park users who perform hygienic practices in public spaces as suggested by CDC. The experiments are carried out at several key locations at the Detroit Riverfront Parks between March 2020 and May 2020 during the outbreak of the COVID-19 pandemic in the state of Michigan and Wayne County. The sensing framework is validated by comparing automatic sensing results with manually labeled ground truth results. The proposed approach significantly improves the efficiency of providing spatial and temporal statistics of users in public open spaces by creating straightforward data visualizations for federal and state agencies. The results can further provide on-time triggering information for an alarming or actuator system which can later be added to intervene inappropriate behavior during this pandemic.
1 Introduction
The spread of coronavirus disease 2019 (COVID-19), an infectious disease caused by severe acute respiratory syndrome coronavirus 2, has taken the world into pandemic in only a few months.The World Health Organization (WHO) declared the COVID‑19 outbreak a public health emergency of international concern (PHEIC) on Jan.30 2020 and a pandemic on Mar.11 2020 [45]. On Feb.26 2020, US CDC Confirms Possible Instance of Community Spread of COVID-19 in California and U.S. [8] The US federal government and state governments are making efforts to warn people, to prepare health systems, and to suppress the spread of the pandemic. For example, the State of Michigan declared a state of emergency on Mar. 10 2020 [42] and the stay-at-home executive order (2020-42 (COVID-19)) [43] on Apr.9 2020. Together with the these legislative efforts, US Centers for Disease Control and Prevention (CDC) recommends social distancing and other hygienic practices, such as avoiding physical contact with hard surfaces and wearing protective facial coverings or masks. According to CDC guidelines [10], social distancing (a.k.a. physical distancing) means ”keeping space between yourself and other people outside of your home”. The practice of social distancing [10] includes: (1) staying at least 6 feet (about 2 arms’ length) from other people, (2) abstaining from gathering in groups, (3) staying out of crowded places and avoiding mass gatherings. CDC also suggests wearing facial coverings or masks in public settings for protection due to a significant portion of asymptomatic and pre-symptomatic individuals [9].
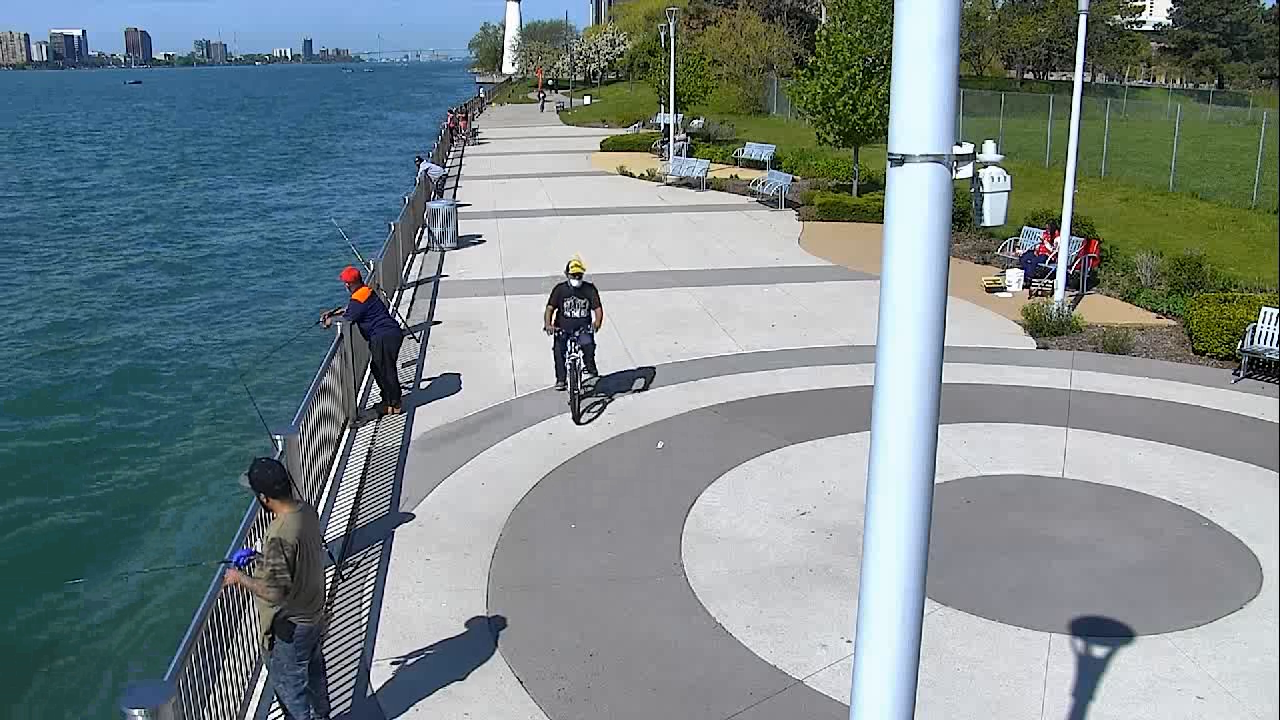
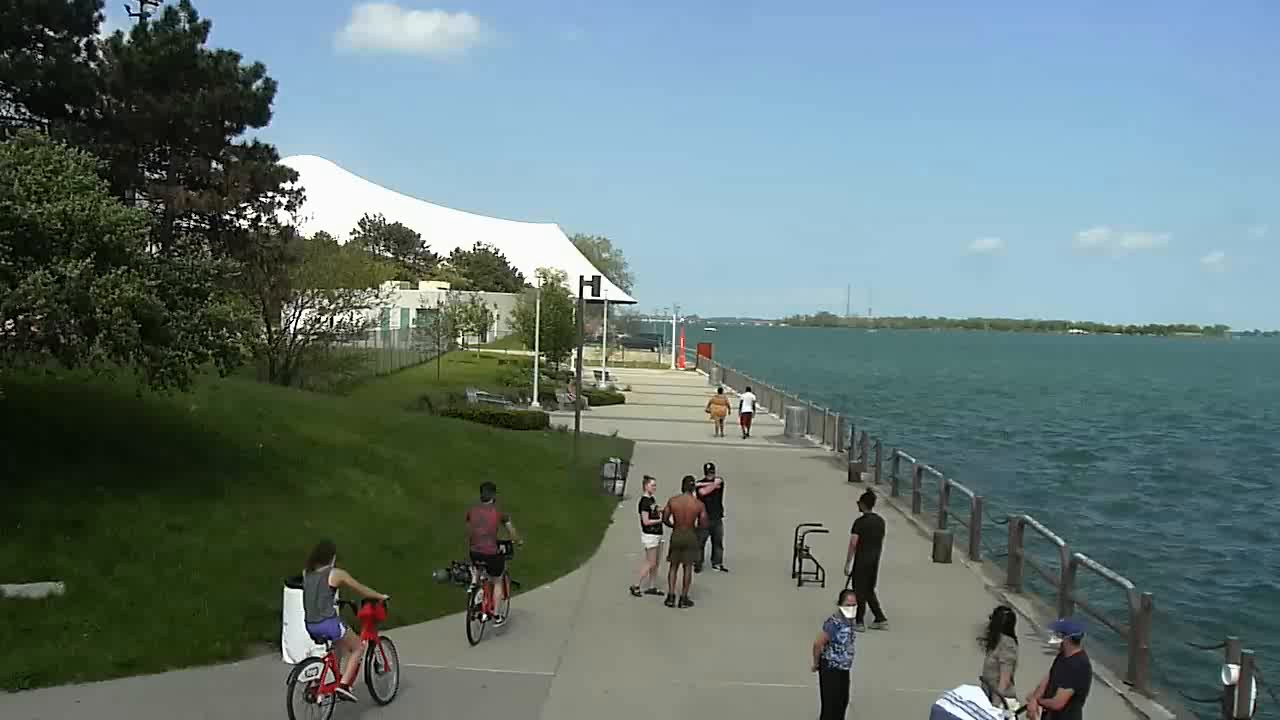
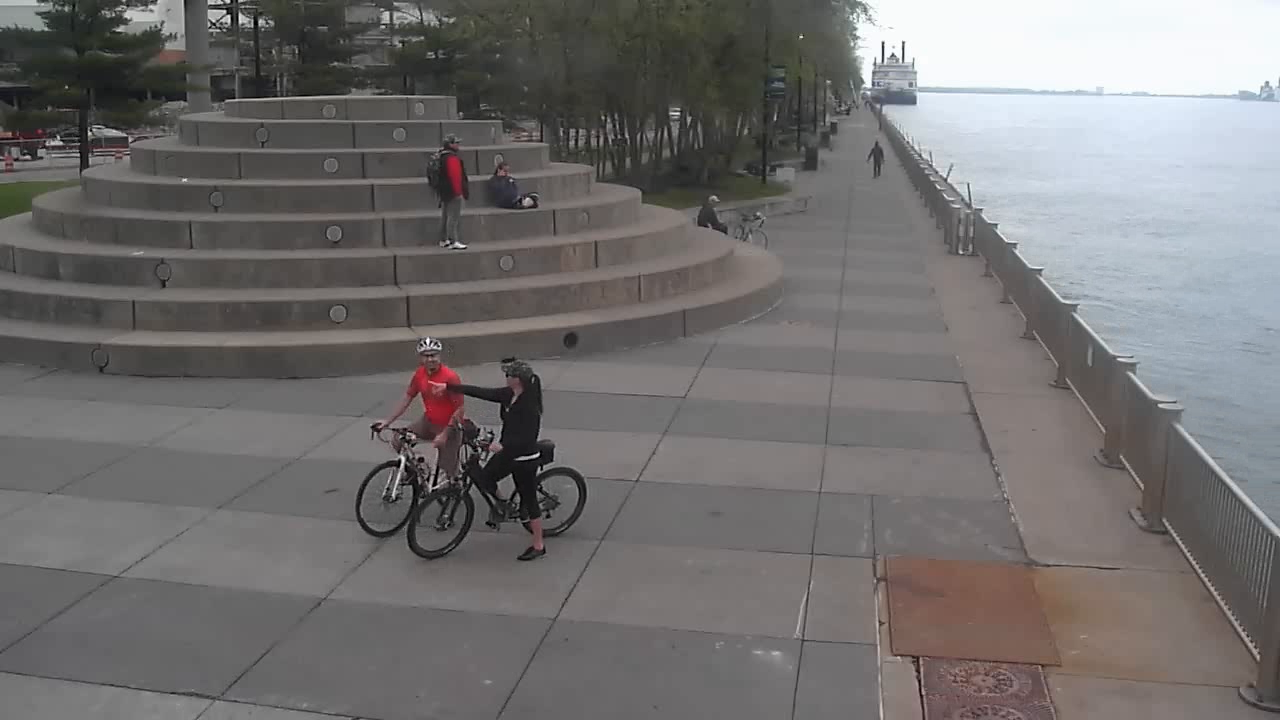
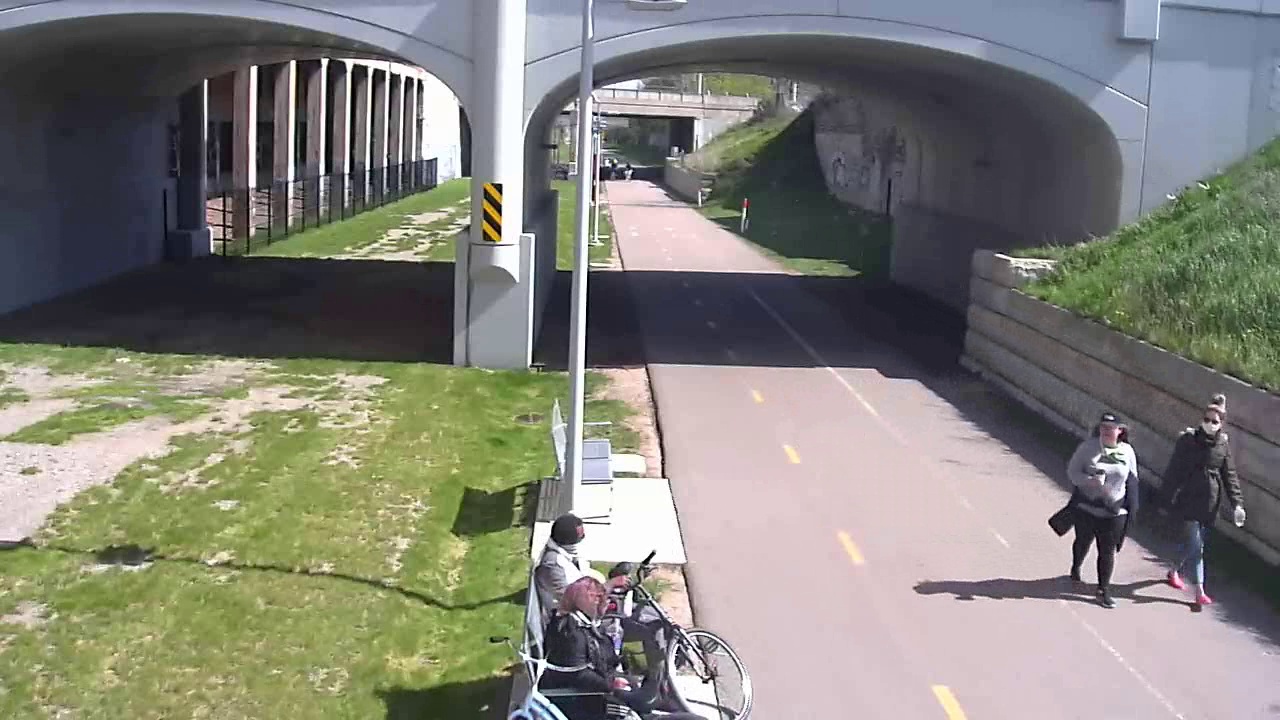
Public open spaces (POS) provide important platforms for residents to perform physical activities which can reduce the risk of chronic disease [11]. Due to the pandemic and the executive orders, many people have to stay and work at home for extended periods of time. Additionally, gyms, recreational centers, and non-essential retail stores have been temporarily closed to the public. This has led to a sharp increase in the use of POS as people are seeking opportunities for physical exercise or simply needing to spend more time outdoors in a natural environment as shown in Fig. 1. During this time public space managers are faced with a challenging question: how to maintain the utility of the POS and at the same time ensure the safety of both park patrons and workers? It is not economically efficient or safe for park employees to manually monitor (large) POS and possibly intervene to correct poor hygienic practices. Hence, there is an urgent need to monitor social distancing and hygienic practices of patrons utilizing and enjoying park facilities within POS.
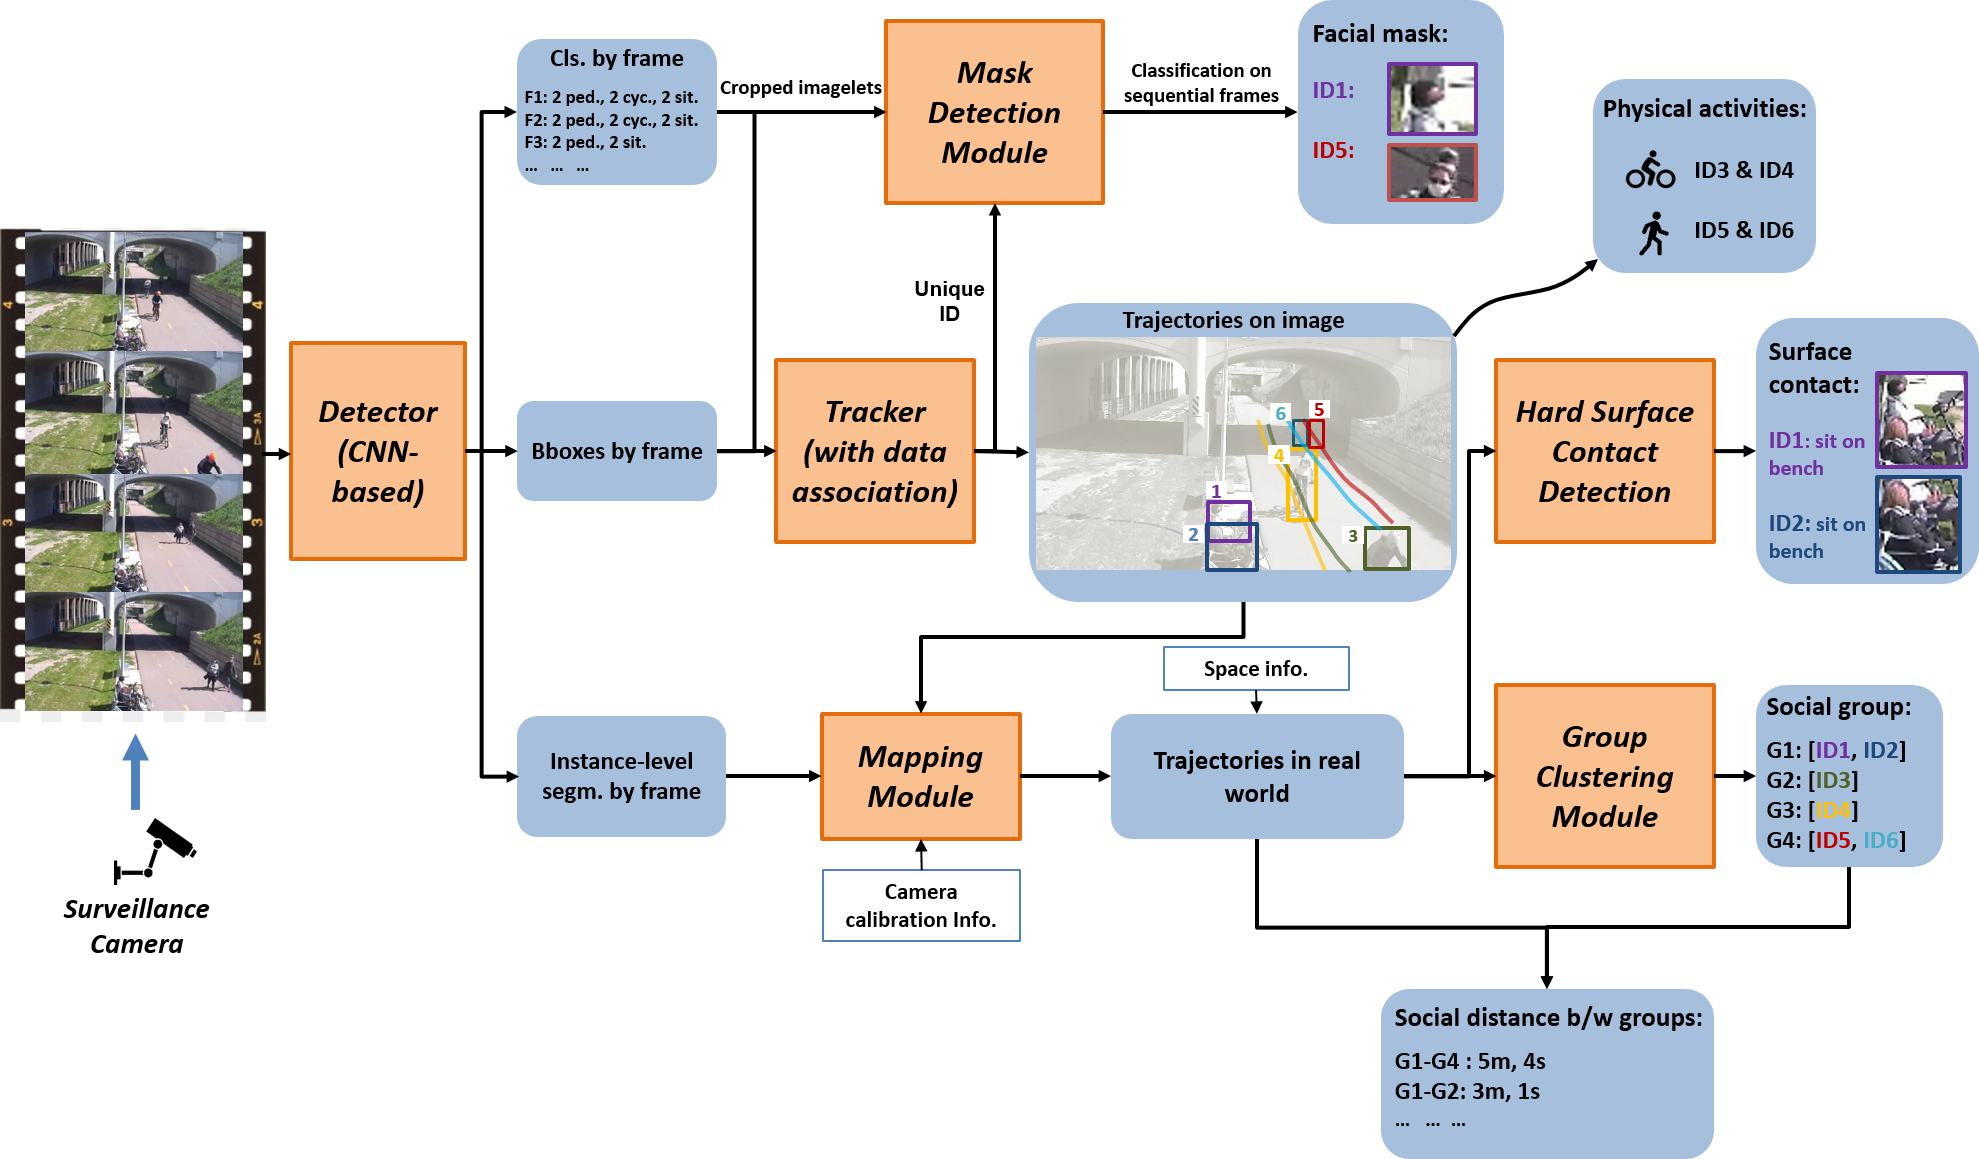
The objective of the paper is to propose an autonomous sensing approach (as shown in Fig. 2) to recognize patrons’ physical activities in POS using pre-installed surveillance cameras and to monitor the practices of social distancing and hygienic protections which suppress the wide spread of COVID-19. The contribution of this proof-of-concept work lies in: (1) it proposes an efficient and safe tool to inform POS managers or government of the POS utilization with healthy precaution during the pandemic; (2) it is cost efficient for reusing the monocular cameras (which have already been pre-installed for surveillance purposes) for social sensing tasks; (3) multi-task capacities is incorporated on the sensing framework, spatio-temporal and social data could be collected for future applications (e.g. urban design or improvement of parks and facilities). The cameras in current use at the Detroit riverfront lack sufficient resolution for facial recognition. To further ensure the privacy, the sensing framework is designed that only anonymized version of the patrons information is extracted with raw images not saved once the system is fully trained.
The structure of the paper is as follows. First, relative studies (e.g. human detection and tracking, crowd analysis and group detection, etc.) will be presented. Second, algorithms of different function modules (e.g. detection, tracking, activity mapping, group detection, mask detection, etc.) with tempo-spatial assessment of social dynamics will be described. Third, the evaluation of each function module and experiment results will be represented as well as the applications (e.g. activity mapping, measurement of social distance measuring, patron-facility contact detection, etc.). In the end, the concluding remarks will be summarized.
2 Related Works
Human Detection and Tracking Object detection models are utilized to identify and locate objects in images. Region-based detection models (e.g. Fast R-CNN [15] and Faster R-CNN [47]) rely on region proposal networks (RPN) [47] and convolutional neural networks (CNN) to estimate bounding boxes (bboxes) of objects. In contrast, single-stage models (e.g. YOLO [46] and SSD [37]) perform object detection without a separate region proposal step. Although the former methods suffer from comparatively slow detection speed, they outperform the latter in detection accuracy [61]. Mask R-CNN [21] is a region-based detection method that yields richer information of detected objects by providing instance segmentation and bbox coordinates. Furthermore, detected contours can provide location information of specific body parts [32]. Recently, new anchor-free detectors (e.g. FCOS [53], FoveaBox [26]) have been developed to achieve higher performance in detecting accurate bboxes without using anchor references. The tracking-by-detection paradigm is usually adopted to perform due to the good performance of the aforementioned, emerging CNN-based detectors. For example, SORT [4] and DeepSort [56] are widely used robust online tracking algorithms with detector-tracker coupled schemes. Tracking is accomplished in a general tracking scenario where videos or video frames have not been rectified and no prior ego-motion information is provided. In this study, the DeepSort algorithm [56] is adopted to build the tracking module and includes various components (e.g. Kalman filter, cascade matching, IoU assignment [4], etc.). The tracker will perform data association tasks based on frame-based detection results from CNN detectors.
Human Activity in Public Open Spaces Manually observing social interactions with the naked eye, either in real-time or though recorded videos, has been the primary method for studying social behavior [55]. Researchers have been working on human activity recognition (HAR) using different sensors, including non-vision based (e.g. wearable) and vision-based sensors. In [28, 58], multiple wearable sensors (e.g. accelerometers, gyroscopes, and magnetometers) are attached to the body of a subject to measure motion attributes to recognize different activities. However, wearable sensors are intrusive to users [23] and can only cover a very limited number of users in a POS. Traditional CV methods using vision-based sensors usually rely on a few visual features (e.g. HoG, local binary pattern, or RGB), which can not achieve robust pedestrian detection (especially under extreme illumination conditions). [57] is one of the few studies that employed a computer vision-based method to measure human activity (e.g. sitting or walking) in a POS. The people detection method was based on background subtraction and blob detection. In the past few years, deep learning [30, 17] methods using deep neural networks have grown rapidly and are drawing attention as the result of their supreme performance in many applications. Others have used deep features of images to extract high-level representation for activity recognition tasks [5, 16]. A complete HAR study [54] usually consists of two steps: 1) person detection, and 2) activity/body shape recognition based on feature representations (e.g. silhouette representation). For simplicity, the recognition of different activities will be embedded within the classification task of the instance segmentation using Mask R-CNN detector in this study.
Collective Motion and Small Groups Groups are defined as clusters of people with similar features (e.g. location, speed, moving direction). Understanding group-level dynamics and properties is important for a large range of applications. Group dynamics have been extensively studied in sociopsychological and biological research as primary processes influencing crowd behaviors (e.g. animal behavior in crowd). Researchers in computer vision [49] used video surveillance feeds to study internal intra-group dynamics (e.g., collecvtiveness, stability, and uniformity) and external inter-group dynamics (e.g.,conflicted movement between passing groups). Collective behavior and the collective motion of groups are attractive phenomena in both nature and human society. In social psychology literature, collective behavior is referred as a generic term for the often extraordinary and dramatic actions of groups and the individuals within [36]. Models of collective behavior fall between two extremes. At one extreme entire crowds are considered as one entity with a homogeneous ”group mind” [36]. While the other extreme treats individuals as independent units acting to maximize their own utility and making local decisions based on the principle of least effort [51]. The real-world scenario falls between the two extremes, both isolated individuals and small groups of people coexist within a crowd [13]. Lau et. al. [29] is one of the first researchers to cluster measured 3D data points (from a laser range finder) into groups of human-size blobs for merging and splitting groups over time based on proxemics [19]. Proxemics can be used to define groups based on ranges of personal and social interaction distances - though if only location information is considered this method is not robust. For example, if an isolated individual approaches near a group and gets within a certain distance they will be treated as a member of the group. Models describing human traffic flow can either be macroscopic, focusing on space allocation, or microscopic focusing on pedestrian groups and interactions between agents [40].In this paper, the authors will focus on micro-level traffic flow and individual tracking. One objective is to analyze sets of trajectories or tracklets to identify pedestrian groups within crowded environments. Identifying groups is necessary for the social distancing aspect of this study.
Facial Occlusion/Mask Detection: While researchers have worked towards masked face detection [14, 44, 59], Ge et. al. [12] presented the largest and richest masked face dataset (MAFA). The MAFA dataset includes 30,811 images consisting of 35,806 masked faces. MAFA also provides detailed annotations describing face and mask location as well as mask type and degree of occlusion. Ge et. al. [12] proposed a three-module framework which utilized LLE-CNNs for masked face detection. The methodology in [12] was able to outperform 6 other state-of-art face detectors in detecting occluded faces from the MAFA dataset by over 15%, including the hierarchal deformable part model presented in [14]. In this paper, a custom dataset will be presented and used for training a CNN-based facial mask detector using in-field surveillance videos (with relative low resolution).
3 Method
3.1 Patron Recognition and Activity Mapping
3.1.1 Detection on Video Frames
In the proposed sensing framework, the detection module adopts Mask R-CNN [21] which provides instance segmentation which helps achieve more accurate mapping. The architecture of the Mask R-CNN model includes a convolutional neural network (CNN) backbone structure (e.g. ResNet [22]), a region proposal network (RPN) [48], a ROI Align module [21], and a classifier (e.g. to classify and regress bboxes and masks). In Mask R-CNN the bbox regression process is performed in two cascaded stages: the first stage is the objectiveness (class-agnostic) bbox regression, which is processed in the RPN, and the second stage is the class-based bbox regression which is processed after the regions of interest are generated. This study utilizes ResNet [22] as the CNN backbone to extract feature maps from the input images. A feature Pyramid Network (FPN) [33] is also implemented with the CNN backbone to extract multi-scale features (in both semantic and location aspects) with the bottom-up top-down approach.
This paper will use Mask R-CNN as the detector in the proposed sensing framework and use a single-stage detector just for comparison. The training process, dataset selection, and evaluation will be presented in Section. 4.
3.1.2 Tracking by Detection
In this study, a popular tracking paradigm, tracking-by-detection, is adopted to build the patron tracking and unique ID assignment. Deep Sort algorithm [56] is utilized to build the tracking module integrated by various components (e.g., Kalman filter, cascade matching, IoU assignment, etc.). The tracking problem is formatted as an assignment problem between existing tracks (based on detection and tracking results on previous frames) and new detection results on the current frame. The proposed detection module serves as the detector while the Hungarian algorithm [27] solves the assignment problem. The tracking algorithm utilizes both motion and appearance for data association metrics as shown in Fig. 3. It has a more robust tracking performance (especially under occlusion condition) than other tracking methods (e.g. SORT [4] ).

A wide residual network consisting of ten convolution layers [56] is used to extract the appearance features of cropped images from the original image (within detection bboxes). The CNN weights have been trained on a large-scale Re-ID dataset [62]. The CNN [60] obtains discriminative contexts from the cropped images (of detected patrons) and maps them onto vectors with fixed length. After feature extraction using the CNN, the discriminative feature vectors of two different patrons are expected to vary widely, while discrimintive feature vectors of a single patron taken from different frames are expected to be similar.
The tracking module (as shown in Fig. 3) utilizes both motion related and appearance related information of the detected/tracked objects. The tracking procedure is based on the detection results (in a frame-by-frame fashion) that are obtained using the detection module. The motion related information is updated by the Kalman filter algorithm [24] and appearance related information is generated by a Re-ID CNN. Both the distances in motion ( in squared Mahalanobis distance) and in appearance ( in cosine distance) between a detection and an existing tracker are used in the following data association step. Data association between the detected results (on current frame) and the identified tracks (on previous frames) is performed across sequential frames. Trajectory results of patrons are obtained after the data association process.
3.1.3 Mapping using Monocular Camera
A pinhole camera model [38] is used to develop a mapping module to relate detected results on images to the real world. In the pinhole camera model for monocular cameras (e.g. most surveillance cameras), a 3D point location in the world coordinate system (WCS) can be projected onto the image plane with location in the 2D pixel coordinate system (PCS) . The projection can be achieved by using a perspective transformation:
| (1) |
where is the scaling factor, is the intrinsic matrix, is the rotation matrix, is the translation vector represented in the camera coordinate system (CCS), , and .
3.2 Social Distance and Group Clustering
Small groups are more prevalent than large crowds in public spaces (e.g. pedestrian scenes, cyclist scenes). This study focuses on small groups, which are typically composed of family members and friends and are much more common at public community parks than heavy crowds composed of tens or hundreds of individuals. Properly identifying these small groups is especially relevant in the context of social distancing. Members within a group (e.g. a family with children or a couple) have clear awareness of the travel history and health of their companions and so it is less imperative and slightly unrealistic to expect these individuals to maintain social distancing between others in the group. However, due to infection dangers from long-time exposure to unfamiliar individuals, it is still imperative for groups to maintain social distancing between other groups and individuals. Therefore, in order to adequately monitor social distancing in POS, it is necessary to firstly identify and distinguish different groups.
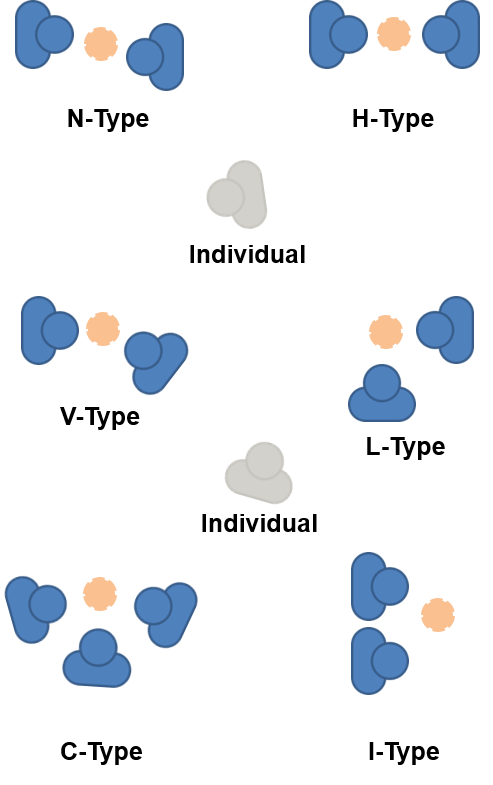
In POS, groups are usually either in conversation or in (collective) motion. Although conversational groups can be dynamic, they tend to change slowly compared to groups in motion. Conversational groups can be described using various F-type formations [6] and physical location with pose orientation of individuals can be used to infer possible o-space and memberships (Fig. 4(a)). Recognition methods for both types of groups are being actively researched and developed. However, due to the usage patterns of the site (DRFC) studied, this paper focuses on the recognition of groups in motion (Fig. 4(b)). The DRFC is primarily used by patrons for physical activities (e.g. walking, jogger, and bicycling) on a stroll, especially during the pandemic period. This study aims to recognize social groups in motion by using physical locations and other social cues derived from information captured by the monocular surveillance cameras.
3.2.1 Group Detection Method
The group detection task is treated as a clustering problem, in which patrons detected in current time window compose the set . is defined a set of all possible partitions of . The task is to find the best possible partition that satisfies a preset criteria. The partition problem is solved using Correlation Clustering (CC) algorithm [1] which is expressed as:
| (2) |
where is an affinity matrix based on the feature selection and is the element corresponding to -th row and -th column. If , and belong to the same group and vice versa. represents the confidence of prediction or the predicted pairwise affinity.
The affinity between two elements (e.g. and ) is a weighted sum of the similarity features.
| (3) |
where and are parameters that can be either selected or trained using a large dataset with ground-truth group clusters.

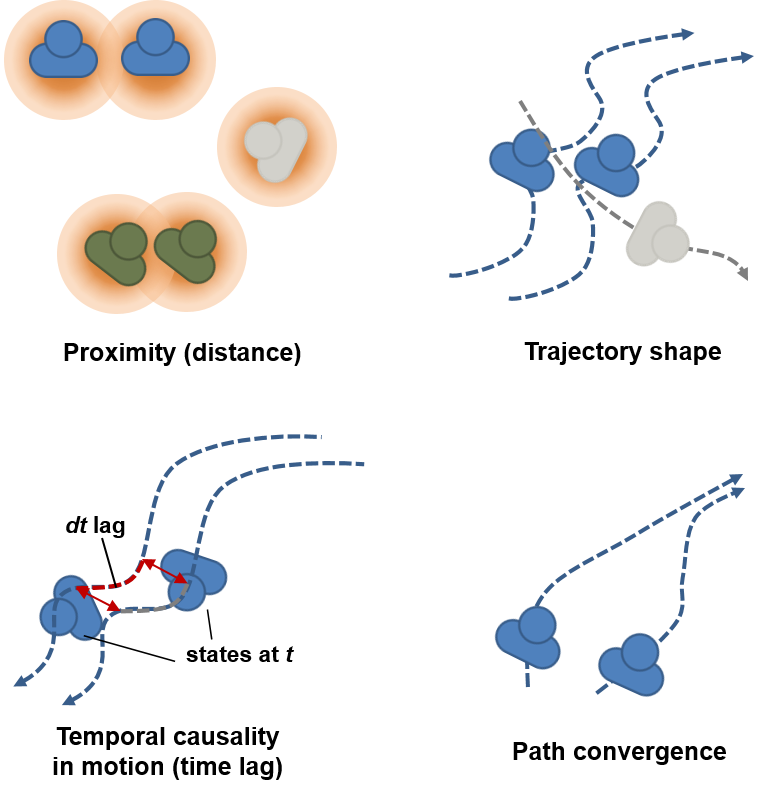
As shown in Fig. 5, the pairwise features or feature vectors (depending on the number of features adopted) are calculated for all possible couples (e.g. ) within . The pairwise features are then multiplied by the parameters to get a weighted sum representing the affinity within each couple. The Cluster Correlation algorithm is then employed to decide whether to merge couples or separate individuals from couples. is an optimized partition of representing the final result of the group detection module.
3.2.2 Similarity Features for Group Members
This study will explore the features or coherence from any two individuals and then determine the relationship of the two by using some relation features. The most straightforward thoughts is the spatial information of patrons in POS. Social science researchers [41] used cascaded metrics (all three need to be satisfied) to determine the group membership of any two individuals: (1) the location of the two are within 7 feet of each other (e.g., ); (2) the speed difference is within 0.5 ft/sec (e.g., ); and (3) the directions of motion are within 3 degrees of each other. Inspired by the metrics for determining group membership between two individuals, Ge et. al. [13] built thresholds (e.g. distance and speed difference) to filter out unqualified couples and designed a relatively robust feature which uses the combination of location/proximity and velocity cues for group membership reasoning. Symmetric Hausdorf distance was adopted for measuring inter-group closeness. The temporal information is only considered when checking the affinity or feature across nearby video frames.
Apart from location and velocity, Solera et. al. [50] extends to extract additional social features from trajectories, such as motion causality, trajectory shape similarity, and common goals. The aforementioned studies used feature based tracking method (e.g. corner features of people) while this study uses (CNN) detection based tracking method. The affinity features will be extracted from the spatial-temporal information of the patrons in POS environment.These features can be used to form an affinity distance of the weighted combination for the following optimization in group clustering. The parameters for the weighted combination can be obtained from a structural support vector machine that is trained on grouping dataset. A pairwise feature vector [50] within time window (usually a fixed interval of several seconds) for each couple is expressed as:
| (4) |
3.3 Inferring People-Facility Contact and Mask Wearing
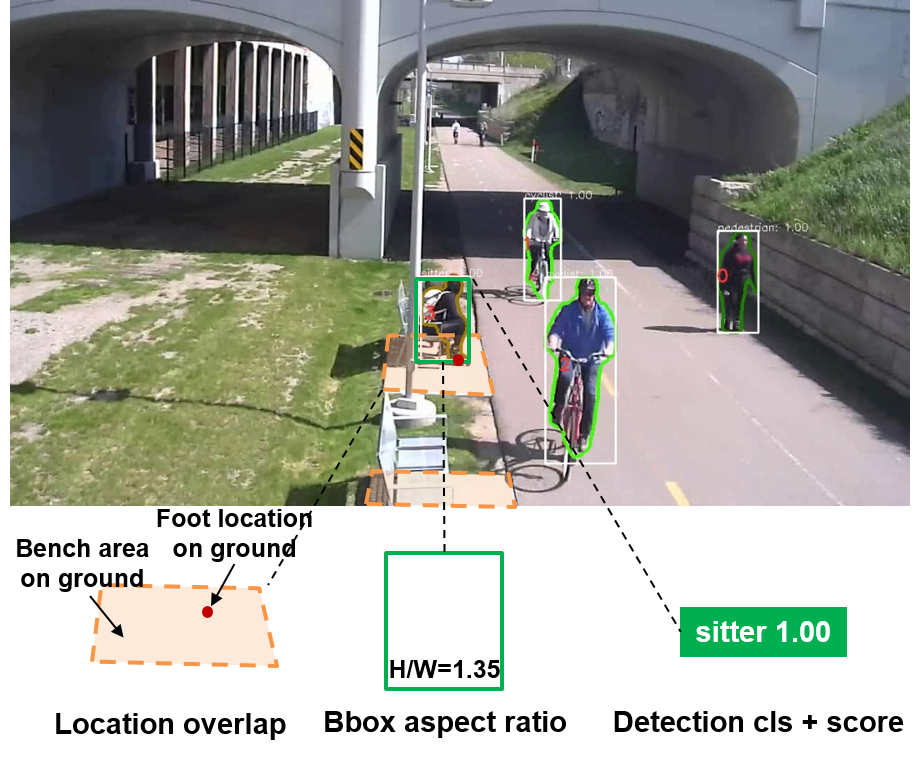
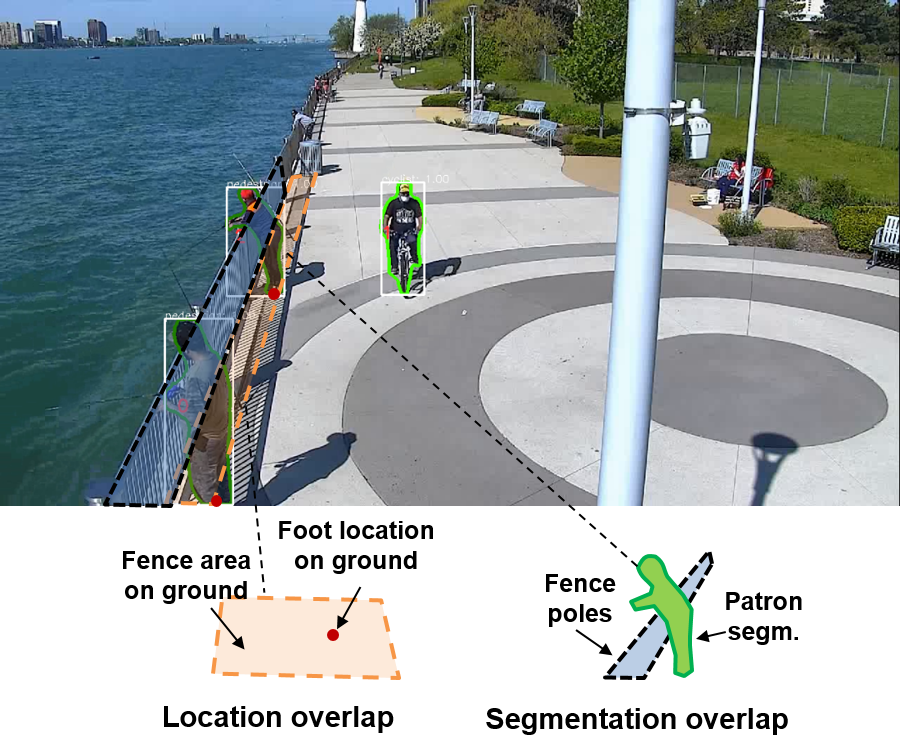
The COVID-19 virus can reportedly stay active on hard surfaces for extended periods of time, surviving many hours past the initial contact time. Gloomy weather, humidity, and low temperatures can extend the COVID-19 virus hard surface survival time even longer. Thus the physical contact between patrons and hard surfaces in POS is important to track although can be challenging to infer from surveillance footage (2D images) alone. However, with some prior knowledge of the environmental setting, geographical information of potentially hazardous surfaces (e.g., park facilities and architectural designs) can be incorporated into the proposed sensing method, and it can be feasible to quickly identify the usage of park facilities. The physical contact between patrons and park facilities can be inferred from the relationship of detected/tracked patrons with geospatial information (e.g., location of chairs, trashcans, and fencing). For example, if a person sits on a bench (as shown in Fig. 6(a)) or leans against a fence (Fig. 6(b)), the event can be inferred, recorded, and timed with a tracking module. Although possible interventions are not studied in this paper, POS owners or managers can take advantage of the monitoring results and revise cleaning strategies or implement further signage warning patrons of hygienic risk.

The CDC recommends wearing face masks in public settings to help slow the spread of COVID-19. In order to track pedestrian use of facial coverings a mask detection tool was developed. The mask detection tool utilizes the detected pedestrian bboxes from the Mask R-CNN detection model as well as tracking information associated with the detection. If a tracked pedestrian is determined by the tracking state information to be heading towards the camera, the head area (top ) of the bbox is cropped and fed into the mask detection tool. For better performance the face mask detection tool will wait until a patron is closer to the camera before initializing, bboxes with insufficient data (when pedestrians are farther away from the camera) are ignored. Surveillance cameras in POS are usually low resolution and are installed higher up on light poles for a larger field of view. For these reasons face mask detection can be challenging. For example, when patrons are near the surveillance cameras used in this study the cropped head areas are on average only 40 80 px2, with the defining feature (face mask) typically being between 10-20 10-20 px2. The face mask detection tool utilizes a CNN-based binary classifier with a ResNet-18 backbone (as shown in Fig. 7) to classify the cropped head areas and associated tracker IDs as having a facial covering or not. In order to ensure the robustness in detection, the top 1/6 of each image is further cropped, normalized (by color), and resized into a size of 64 64 px2 before passing through the CNN-based classifier.
4 Experiment and Result
4.1 Activity Recognition in OPOS
| Detector | AP per ppl. class | mAP (ppl.) | |||||
|---|---|---|---|---|---|---|---|
| ped. | cycl. | scoot. | skat. | sitter | ppl.oth | ||
| mask (bbox) | 96.36 | 96.50 | 89.39 | 89.52 | 89.14 | 74.08 | 89.17 |
| mask (segm) | 96.31 | 96.46 | 89.39 | 89.52 | 89.52 | 73.11 | 89.05 |
| retina (bbox) | 97.59 | 98.10 | 95.53 | 38.05 | 89.89 | 68.43 | 81.26 |
Among the existing models, Mask R-CNN has a much better trade-off balance between accuracy and speed and is a good candidate for the detector in the sensing framework. However, for comparison, this work also presents the detection results from one-stage detectors in the POS environment. The weights of the CNN backbone in the detection models are firstly trained on the ImageNet-1K dataset [7] and COCO_2017 dataset [34]. Transfer learning for Mask R-CNN is performed using maskrcnn-benchmark platform [39]. The mini batch size is set as 2 images/batch and horizontal flipping data augmentation is adopted for training. The schedule includes 90k iterations and starts at a learning rate of 0.0025. The learning rate is decreased by a factor of 0.1 after 60k and 80k iterations and finally terminates at 90k iterations. This schedule results in 25.56 epochs over the OPOS_training dataset [52] which consists of 7043 images with 16902 annotated bboxes and (instance) segmentations. The OPOS dataset include classes of people in POS with different physical activities (e.g. bicycling, scootering, sitting, etc.) and classes of usual objects (e.g. cars, strollers, dogs, etc.). In order to ensure a thorough training, the order of the images in the training dataset is shuffled after each epoch. To compare the performance of the trained detectors, evaluation is performed adopting AP50 metrics on OPOS testing dataset with 783 images with 2000 annotated objects. As shown Table 1, the Mask R-CNN outperforms RetinaNet by 7.91% in overall people detection (mean average precision in bbox). Mask R-CNN also provides segmentation information that enables correct localization of patrons compared to bbox.
| Method | MOTA | MOTP | Prcn | Rcll | GT | MT | PT | ML | IDs | ID Ct. | |
|---|---|---|---|---|---|---|---|---|---|---|---|
| detect+track (raw results) | 80.30% | 87.60% | 95.00% | 85.70% | 53 | 33 | 20 | 0 | 36 | 59 | |
| 72.40% | 85.70% | 95.30% | 77.70% | 53 | 18 | 35 | 0 | 33 | 59 | ||
| 56.40% | 83.80% | 92.80% | 63.00% | 53 | 6 | 42 | 5 | 28 | 52 | ||
| detect+track (filtered results) | 80.40% | 87.60% | 95.00% | 85.70% | 53 | 33 | 20 | 0 | 36 | 57 | |
| 72.60% | 85.70% | 95.50% | 77.60% | 53 | 18 | 35 | 0 | 30 | 56 | ||
| 56.10% | 83.80% | 93.00% | 62.60% | 53 | 6 | 41 | 6 | 27 | 49 | ||
In order to evaluate the actual tracking performance of the proposed framework using in-field surveillance videos, a custom tracking dataset is built using a 30-min long video (speed: 7FPS, resolution: 1280x720 px2) collected at DRFC. The dataset (in MOT-16 format) includes 53 unique individuals partaking in activities over 9847 frames. This custom dataset can represent the sparsity/crowdedness and the moving patterns of the patrons at the study location. The proposed framework has satisfactory evaluation scores on the custom dataset and has a much lower ID switch number than other methods. The MOT metric [2] adopted to obtain the tracking performance evaluation scores (Table 2). In practice, tracking patrons in video can often generate more unique IDs due to false positives in the detection process. However these tracklets are usually short and are over a small number of frames. This study also tests a post processing step to filter out these tracklets. The threshold for filtering is set as 4, any tracklets that is shorter than 4 frames will be discarded. It is found this filtering step can reduce the total ID count to the ground truth making it a useful function in real practice for patron counting. The error in patron counting using both detection and tracking is about 7% which is acceptable in an engineering application.
4.2 Group Detection and Social Distance Measuring
| Training dataset | Testing dataset | Window size | Prcn | Rcll | F1 |
|---|---|---|---|---|---|
| CBE | DRFC | 10s | 83.72% | 82.33% | 83.02% |
| CBE | stu003 | 10s | 91.91% | 81.27% | 86.26% |
In order to validate the group detection algorithm in the field, a dataset is built by using a 1-hr video collected at DRFC. The dataset includes (manually annotated) unique IDs and trajectories for each individual in the real world coordinate system, and grouping information of the individuals. Instance-level bbox and segmentations on each frame are annotated firstly by detector and then manually revised. The custom grouping dataset consists of 154 unique individuals including cyclists, pedestrians, scooters, and skaters. There are 33 small groups consisting of 2 or 3 individuals and 86 singletons in total. Due to the lack of large grouping dataset with DRFC crowding scenario, the study uses the pre-trained results of the parameters (i.e. and in Eq. 3) using a Structural SVM framework [50] on a public dataset for crowd analysis (Crowds-By-Examples (CBE) dataset [31]). The group detection algorithm with the trained parameters is evaluated on DRFC grouping dataset. stu003 is one split of the CBE dataset (with medium density crowd) including 406 unique individuals and 108 groups. For comparison, the evaluation results on stu003 split is also presented in Table 3. Although the parameters are not tuned for the DRFC environment, the group detection algorithm achieves comparable performance on the DRFC grouping dataset with an F1 score of 83.02%. Training of the parameters will be carried out in the future once a large custom training dataset (at the study location) is available. A large custom training dataset is expected to get a more suitable combination of affinity features and can thus enhance the accuracy of the group detection algorithm in the field.
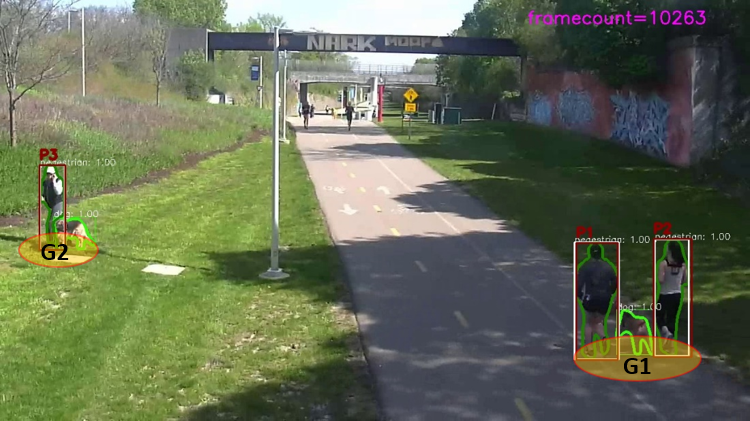
G1-G2(12.7m)
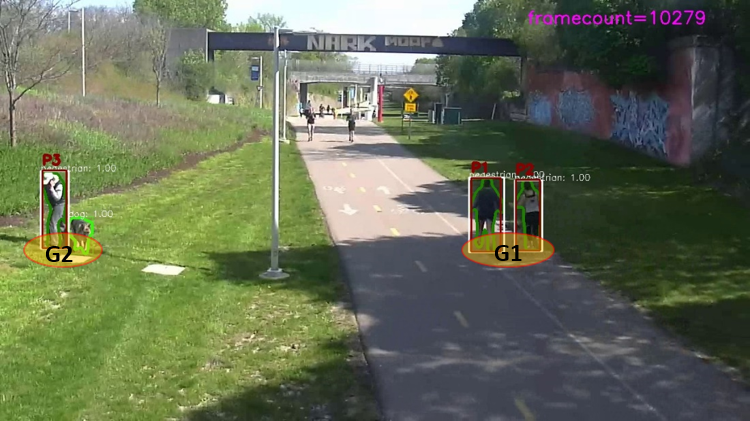
G1-G2(9.8m)
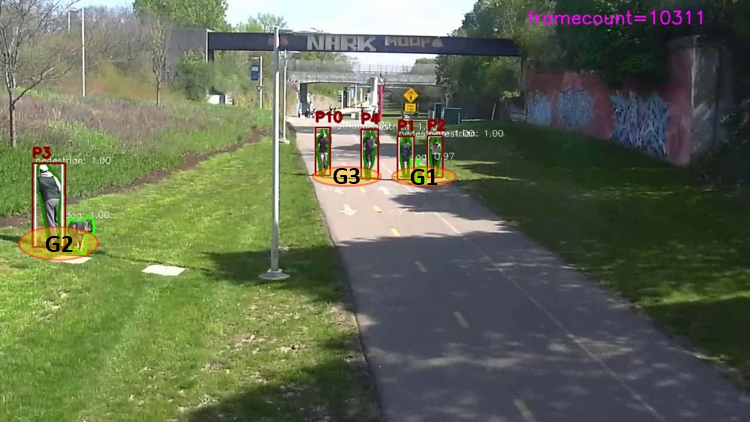
G1-G3(1.2m)
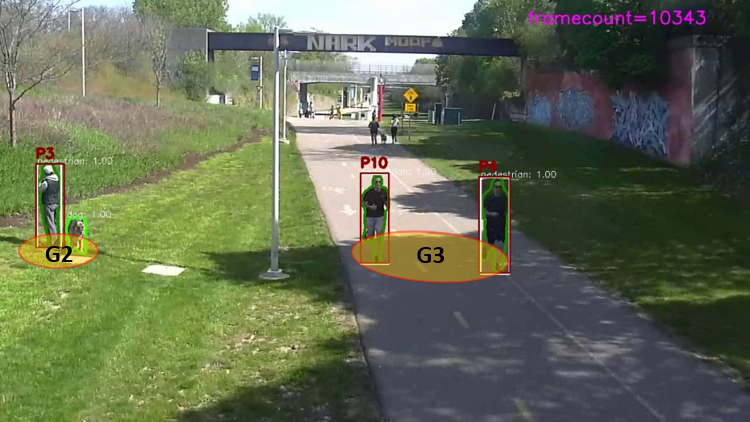
G2-G3(7.4m)
Fig. 8 shows examples of group clustering and measurements of social distances between different groups and inside each group. Pedestrians P1, P2, and P3 are firstly detected and tracked starting on frame-10263. P1 and P2 are walking upward while P3 is standing on the grass. Later, P4 and P10 enter the scene jogging downward. Based on the tracked trajectories, P1 and P2 are detected as group G1, P3 as group G2, and P4 and P10 as group G3. The diameter of groups and the distance between groups are monitored at different times/frames. For example, the diameter of group G1 is measured as 1.0-1.2m across different frames and the diameter of group G3 is measured as 1.9-2.5m across different frames. Although the diameter of G3 is a bit large, the similar trajectories and temporal relations between P4 and P10 ensure accurate group clustering. The closest distance between G1 and G3 occurs at frame-10311 (as show in Fig. 8(c)) when the distance is measured as 1.2m which is shorter than the suggested social distance of 2m. However, the total time for passing is very short and lasts only for a few seconds. Monitoring social distancing practices can be achieved automatically using the proposed sensing framework.
4.3 Patron-Facility Contact Detection and Mask Detection
Physical contact between patrons and park facilities can be inferred from the locations of detected patrons. A mapping module is developed to transform the detection and tracking results from pixel-wise coordinates to the real world coordinate system. Patrons are firstly detected and segmented by the detector on the video frame, then the bottom pixel coordinates (, ) on the segmented contour corresponding to the bottom part of a patron (e.g. one foot for pedestrian or one tire for cyclist) are extracted (denoted as red dots in Fig. 6). Based on the location information and other cues (e.g. aspect ratio of bbox, overlap between segmentations), physical contact events can be detected.

In order to train and validate the proposed CNN-based mask detector/classifier, a custom dataset is built by collecting cropped images of patrons wearing and not wearing facial masks at DRFC during COVID-19 pandemic. The images are manually curated from surveillance camera footage and consist of 1,580 positive examples (cropped faces with facial coverings) and 3,720 negative examples (cropped faces without facial coverings and arbitrary crops from the surveillance footage). Of the 5,300 image test-set, 4,500 images are used for training while 800 images are withheld for validation. For training, a batch size of 325 is adopted with 45 epochs. Adaptive moment estimation (Adam) [25] and a learning rate of 0.07 are used for training. The evaluation yields a precision of 94%, a recall of 80%, and an F1 score of 86% on the testing dataset. The performance is satisfactory considering the small size of the head portion of patrons and the low-resolution characteristics of the surveillance images.
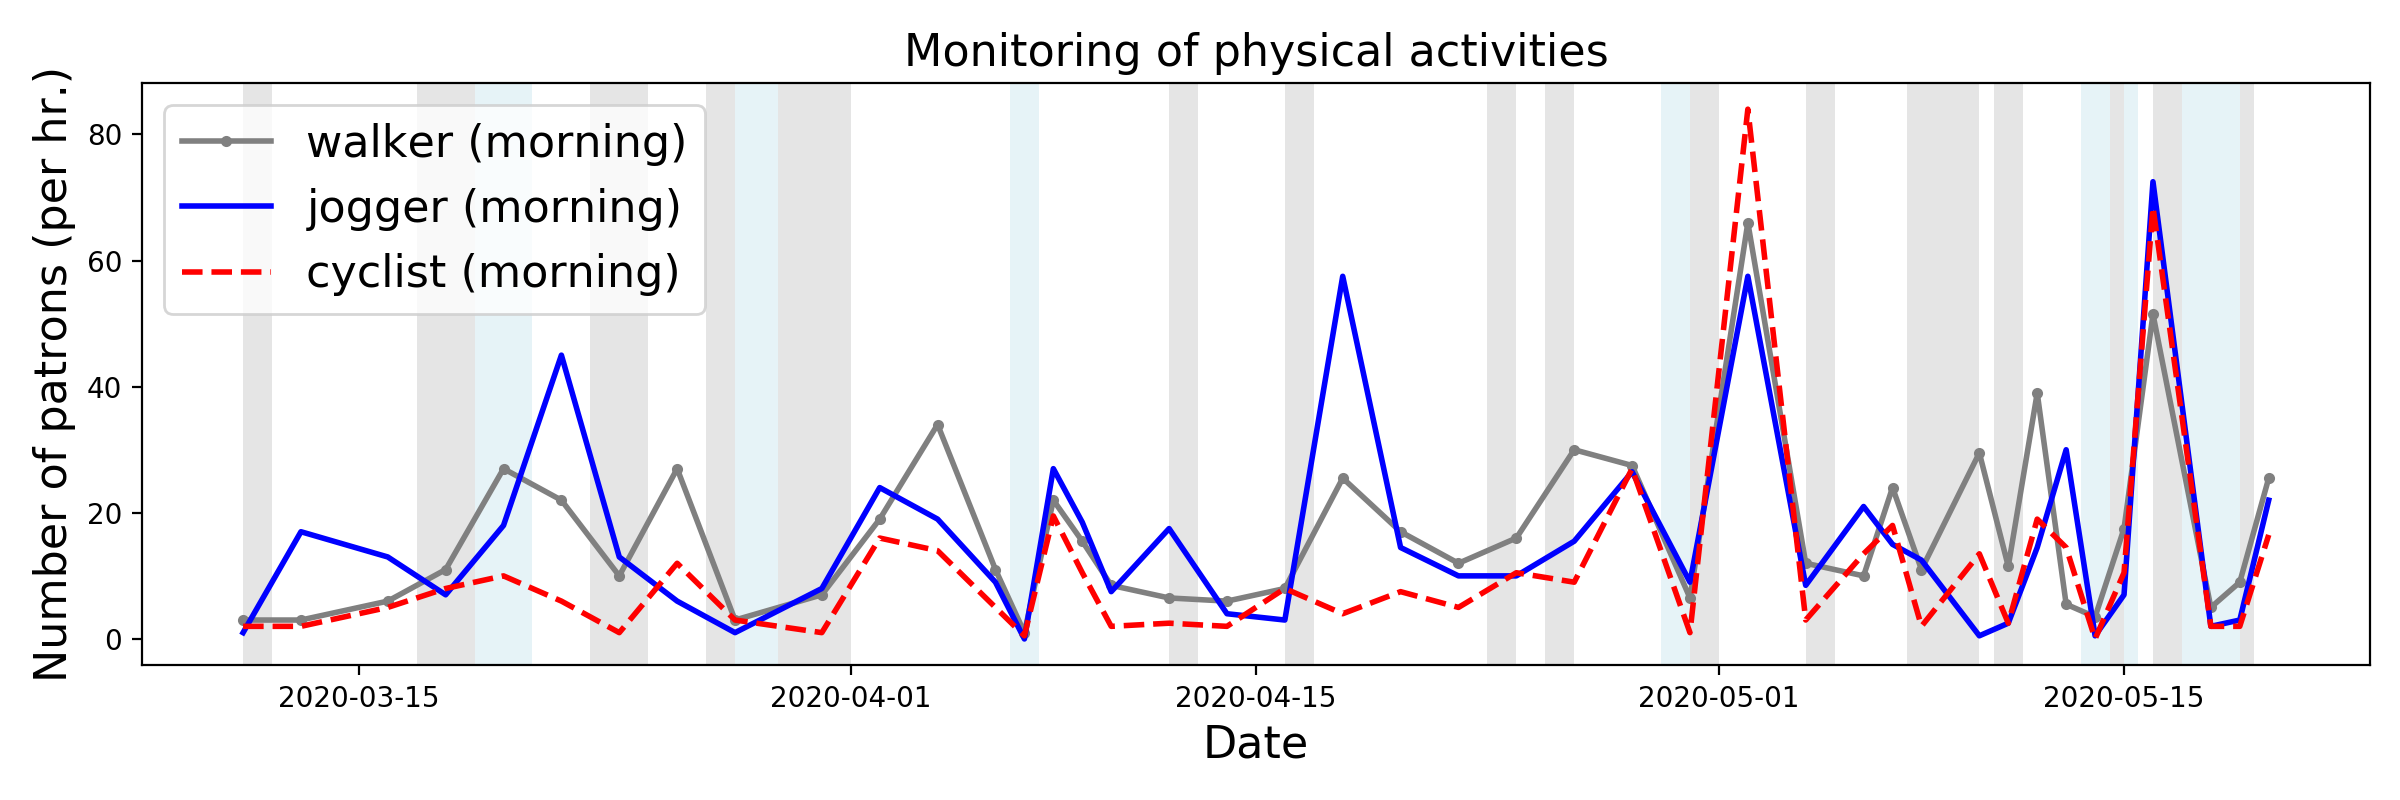
The proposed proof-of-concept study also reports some applawications in automatic monitoring of patron activities and hygienic practices among patrons in a two-month period (Mar 11 - May 19, 2020). Video data from one surveillance camera at the Dequindre Cut is used to study the primary physical activities in the mornings from 10:00 to 12:00. It is found that most of the spikes in Fig. 9(a) occur during sunny days while low activity level is usually associated with gloomy or rainy weather conditions. The result shows the overall physical activities at DRFC (e.g. walking, jogging, and bicycling) have a strong correlation with weather conditions. Although fluctuating during the time, the overall trend of wearing facial masks in POS or at least at DRFC can be revealed from Fig. 9(b). The conclusion is drawn by observing the increasing of both total number and rate of patrons who wear facial masks (the highest rate is about 40% around May 15). Regarding the use of park benches, it seems that patrons at DRFC have not been avoiding them and are not following recommendations to avoid physical contact with hard surfaces in public spaces.
5 Conclusion
This paper presents a proof-of-concept study of an automatic sensing framework to measure social distancing and hygienic practices in public open spaces during COVID-19 pandemic. The multi-task framework integrates multiple function modules to achieve patron sensing and activity recognition, social distance monitoring between social groups, and facial mask detection. The function modules for various tasks have been validated using multiple custom datasets with manual annotations on DRFC videos. The proposed sensing framework is at service at DRFC and some preliminary results from in-field applications are also demonstrated. More studies on improving the framework and more applications in patron activity sensing during the COVID-19 will be carried out in future. The authors envision wider applications of the method in other public open spaces and different built environments.
Acknowledgement
The support from the National Science Foundation (NSF) under grant #1831347 is gratefully acknowledged.
References
- [1] Nikhil Bansal, Avrim Blum, and Shuchi Chawla. Correlation clustering. Machine learning, 56(1-3):89–113, 2004.
- [2] Keni Bernardin and Rainer Stiefelhagen. Evaluating multiple object tracking performance: the clear mot metrics. Journal on Image and Video Processing, 2008:1, 2008.
- [3] Donald J Berndt and James Clifford. Using dynamic time warping to find patterns in time series. In Proceedings of the 3rd International Conference on Knowledge Discovery and Data Mining, pages 359–370, 1994.
- [4] Alex Bewley, Zongyuan Ge, Lionel Ott, Fabio Ramos, and Ben Upcroft. Simple online and realtime tracking. In 2016 IEEE International Conference on Image Processing (ICIP), pages 3464–3468. IEEE, 2016.
- [5] Fabian Caba Heilbron, Victor Escorcia, Bernard Ghanem, and Juan Carlos Niebles. Activitynet: A large-scale video benchmark for human activity understanding. In The IEEE Conference on Computer Vision and Pattern Recognition (CVPR), pages 961–970, 2015.
- [6] T Matthew Ciolek and Adam Kendon. Environment and the spatial arrangement of conversational encounters. Sociological Inquiry, 50(3-4):237–271, 1980.
- [7] Jia Deng, Wei Dong, Richard Socher, Li-Jia Li, Kai Li, and Li Fei-Fei. Imagenet: A large-scale hierarchical image database. In 2009 IEEE Conference on Computer Vision and Pattern Recognition, pages 248–255. Ieee, 2009.
- [8] Centers for Disease Control and Prevention (CDC). Cdc confirms possible instance of community spread of covid-19 in u.s. https://www.cdc.gov/media/releases/2020/s0226-Covid-19-spread.html, 2020. Accessed: 2020-05-25.
- [9] Centers for Disease Control and Prevention (CDC). Recommendation regarding the use of cloth face coverings, especially in areas of significant community-based transmission. https://www.cdc.gov/coronavirus/2019-ncov/prevent-getting-sick/cloth-face-cover.html, 2020. Accessed: 2020-05-25.
- [10] Centers for Disease Control and Prevention (CDC). Social distancing. https://www.cdc.gov/coronavirus/2019-ncov/prevent-getting-sick/social-distancing.html, 2020. Accessed: 2020-05-25.
- [11] Jacinta Francis, Lisa J Wood, Matthew Knuiman, and Billie Giles-Corti. Quality or quantity? exploring the relationship between public open space attributes and mental health in perth, western australia. Social Science & Medicine, 74(10):1570–1577, 2012.
- [12] Shiming Ge, Jia Li, Qiting Ye, and Zhao Luo. Detecting masked faces in the wild with lle-cnns. In Proceedings of the IEEE Conference on Computer Vision and Pattern Recognition, pages 2682–2690, 2017.
- [13] Weina Ge, Robert T Collins, and R Barry Ruback. Vision-based analysis of small groups in pedestrian crowds. IEEE transactions on pattern analysis and machine intelligence, 34(5):1003–1016, 2012.
- [14] Golnaz Ghiasi and Charless C Fowlkes. Occlusion coherence: Localizing occluded faces with a hierarchical deformable part model. In Proceedings of the IEEE Conference on Computer Vision and Pattern Recognition, pages 2385–2392, 2014.
- [15] Ross Girshick. Fast r-cnn. In Proceedings of the IEEE International Conference on Computer Vision, pages 1440–1448, 2015.
- [16] Georgia Gkioxari, Ross Girshick, Piotr Dollár, and Kaiming He. Detecting and recognizing human-object interactions. In The IEEE Conference on Computer Vision and Pattern Recognition (CVPR), pages 8359–8367, 2018.
- [17] Ian Goodfellow, Yoshua Bengio, and Aaron Courville. Deep learning. MIT press, 2016.
- [18] Clive WJ Granger. Investigating causal relations by econometric models and cross-spectral methods. Econometrica: journal of the Econometric Society, pages 424–438, 1969.
- [19] Edward T Hall. A system for the notation of proxemic behavior. American anthropologist, 65(5):1003–1026, 1963.
- [20] Edward Twitchell Hall. The hidden dimension, volume 609. Garden City, NY: Doubleday, 1966.
- [21] Kaiming He, Georgia Gkioxari, Piotr Dollár, and Ross Girshick. Mask r-cnn. In The IEEE International Conference on Computer Vision (ICCV), pages 2961–2969, 2017.
- [22] Kaiming He, Xiangyu Zhang, Shaoqing Ren, and Jian Sun. Deep residual learning for image recognition. In The IEEE Conference on Computer Vision and Pattern Recognition (CVPR), pages 770–778, 2016.
- [23] Ahmad Jalal, Yeon-Ho Kim, Yong-Joong Kim, Shaharyar Kamal, and Daijin Kim. Robust human activity recognition from depth video using spatiotemporal multi-fused features. Pattern Recognition, 61:295–308, 2017.
- [24] Rudolph Emil Kalman. A new approach to linear filtering and prediction problems. Journal of basic Engineering, 82(1):35–45, 1960.
- [25] Diederik P Kingma and Jimmy Ba. Adam: A method for stochastic optimization. arXiv preprint arXiv:1412.6980, 2014.
- [26] Tao Kong, Fuchun Sun, Huaping Liu, Yuning Jiang, and Jianbo Shi. Foveabox: Beyond anchor-based object detector. arXiv preprint arXiv:1904.03797, 2019.
- [27] Harold W Kuhn. The hungarian method for the assignment problem. Naval research logistics quarterly, 2(1-2):83–97, 1955.
- [28] Oscar D Lara and Miguel A Labrador. A survey on human activity recognition using wearable sensors. IEEE Communications Surveys & Tutorials, 15(3):1192–1209, 2012.
- [29] Boris Lau, Kai O Arras, and Wolfram Burgard. Multi-model hypothesis group tracking and group size estimation. International Journal of Social Robotics, 2(1):19–30, 2010.
- [30] Yann LeCun, Yoshua Bengio, and Geoffrey Hinton. Deep learning. Nature, 521(7553):436–444, 2015.
- [31] Alon Lerner, Yiorgos Chrysanthou, and Dani Lischinski. Crowds by example. In Computer graphics forum, volume 26, pages 655–664. Wiley Online Library, 2007.
- [32] Jianshu Li, Jian Zhao, Yunchao Wei, Congyan Lang, Yidong Li, Terence Sim, Shuicheng Yan, and Jiashi Feng. Multiple-human parsing in the wild. arXiv preprint arXiv:1705.07206, 2017.
- [33] Tsung-Yi Lin, Piotr Dollár, Ross Girshick, Kaiming He, Bharath Hariharan, and Serge Belongie. Feature pyramid networks for object detection. In Proceedings of the IEEE Conference on Computer Vision and Pattern Recognition, pages 2117–2125, 2017.
- [34] Tsung-Yi Lin, Michael Maire, Serge Belongie, James Hays, Pietro Perona, Deva Ramanan, Piotr Dollár, and C Lawrence Zitnick. Microsoft coco: Common objects in context. In European Conference on Computer Vision, pages 740–755. Springer, 2014.
- [35] Weiyao Lin, Hang Chu, Jianxin Wu, Bin Sheng, and Zhenzhong Chen. A heat-map-based algorithm for recognizing group activities in videos. IEEE Transactions on Circuits and Systems for Video Technology, 23(11):1980–1992, 2013.
- [36] Gardner Ed Lindzey. Handbook of social psychology. I. Theory and method. II. Special fields and applications.(2 vols). Addison-Wesley Publishing Co., 1954.
- [37] Wei Liu, Dragomir Anguelov, Dumitru Erhan, Christian Szegedy, Scott Reed, Cheng-Yang Fu, and Alexander C Berg. Ssd: Single shot multibox detector. In European Conference on Computer Vision, pages 21–37. Springer, 2016.
- [38] Yi Ma, Stefano Soatto, Jana Kosecka, and S Shankar Sastry. An invitation to 3-d vision: from images to geometric models, volume 26. Springer Science & Business Media, 2012.
- [39] Francisco Massa and Ross Girshick. maskrcnn-benchmark: Fast, modular reference implementation of Instance Segmentation and Object Detection algorithms in PyTorch. https://github.com/facebookresearch/maskrcnn-benchmark, 2018.
- [40] Adolf D May. Traffic flow fundamentals. New Jersey: Prentice Hall, 1990.
- [41] Clark McPhail and Ronald T Wohlstein. Using film to analyze pedestrian behavior. Sociological Methods & Research, 10(3):347–375, 1982.
- [42] Michigan.gov. Executive order 2020-04 - declaration of state of emergency. https://www.michigan.gov/whitmer/0,9309,7-387-90499_90705-521576--,00.html, 2020. Accessed: 2020-05-25.
- [43] Michigan.gov. Executive order 2020-42 (covid-19). https://www.michigan.gov/whitmer/0,9309,7-387-90499_90705-525182--,00.html, 2020. Accessed: 2020-05-25.
- [44] Michael Opitz, Georg Waltner, Georg Poier, Horst Possegger, and Horst Bischof. Grid loss: Detecting occluded faces. In European conference on computer vision, pages 386–402. Springer, 2016.
- [45] World Health Organization et al. Who director-general’s opening remarks at the media briefing on covid-19-11 march 2020. Geneva, Switzerland, 2020.
- [46] Joseph Redmon, Santosh Divvala, Ross Girshick, and Ali Farhadi. You only look once: Unified, real-time object detection. In The IEEE Conference on Computer Vision and Pattern Recognition, pages 779–788, 2016.
- [47] Shaoqing Ren, Kaiming He, Ross Girshick, and Jian Sun. Faster r-cnn: Towards real-time object detection with region proposal networks. In C. Cortes, N. D. Lawrence, D. D. Lee, M. Sugiyama, and R. Garnett, editors, Advances in Neural Information Processing Systems 28, pages 91–99. Curran Associates, Inc., 2015.
- [48] Shaoqing Ren, Kaiming He, Ross Girshick, and Jian Sun. Faster r-cnn: Towards real-time object detection with region proposal networks. In Advances in neural information processing systems, pages 91–99, 2015.
- [49] Jing Shao, Chen Change Loy, and Xiaogang Wang. Scene-independent group profiling in crowd. In Proceedings of the IEEE Conference on Computer Vision and Pattern Recognition, pages 2219–2226, 2014.
- [50] Francesco Solera, Simone Calderara, and Rita Cucchiara. Socially constrained structural learning for groups detection in crowd. IEEE transactions on pattern analysis and machine intelligence, 38(5):995–1008, 2015.
- [51] G Keith Still. Crowd dynamics. PhD thesis, University of Warwick, 2000.
- [52] Peng Sun, Rui Hou, and Jerome Lynch. Measuring the utilization of public open spaces by deep learning: a benchmark study at the detroit riverfront. In The IEEE Winter Conference on Applications of Computer Vision (WACV), pages 2228–2237, March 2020.
- [53] Zhi Tian, Chunhua Shen, Hao Chen, and Tong He. Fcos: Fully convolutional one-stage object detection. arXiv preprint arXiv:1904.01355, 2019.
- [54] Michalis Vrigkas, Christophoros Nikou, and Ioannis A Kakadiaris. A review of human activity recognition methods. Frontiers in Robotics and AI, 2:28, 2015.
- [55] William Hollingsworth Whyte. The social life of small urban spaces. Washington, D.C. : Conservation Foundation, 1980.
- [56] Nicolai Wojke, Alex Bewley, and Dietrich Paulus. Simple online and realtime tracking with a deep association metric. In 2017 IEEE International Conference on Image Processing (ICIP), pages 3645–3649. IEEE, 2017.
- [57] Wei Yan and David A Forsyth. Learning the behavior of users in a public space through video tracking. In 2005 Seventh IEEE Workshops on Applications of Computer Vision (WACV/MOTION’05)-Volume 1, volume 1, pages 370–377. IEEE, 2005.
- [58] Allen Y Yang, Sameer Iyengar, Shankar Sastry, Ruzena Bajcsy, Philip Kuryloski, and Roozbeh Jafari. Distributed segmentation and classification of human actions using a wearable motion sensor network. In 2008 IEEE Computer Society Conference on Computer Vision and Pattern Recognition Workshops, pages 1–8. IEEE, 2008.
- [59] Shuo Yang, Ping Luo, Chen-Change Loy, and Xiaoou Tang. From facial parts responses to face detection: A deep learning approach. In Proceedings of the IEEE International Conference on Computer Vision, pages 3676–3684, 2015.
- [60] Sergey Zagoruyko and Nikos Komodakis. Wide residual networks. arXiv preprint arXiv:1605.07146, 2016.
- [61] Zhong-Qiu Zhao, Peng Zheng, Shou-tao Xu, and Xindong Wu. Object detection with deep learning: A review. IEEE Transactions on Neural Networks and Learning Systems, 2019.
- [62] Liang Zheng, Zhi Bie, Yifan Sun, Jingdong Wang, Chi Su, Shengjin Wang, and Qi Tian. Mars: A video benchmark for large-scale person re-identification. In European Conference on Computer Vision, pages 868–884. Springer, 2016.