Negative isotropic seismic moment tensors, migrating and cyclic seismicity during the 2018 summit collapse at Kīlauea caldera
Abstract
The 2018 rift zone eruption of Kīlauea volcano was accompanied by a remarkable and episodic collapse of its summit. Between May-August the eruption and collapse sequence included over 70,000 earthquakes (M0) and 54 major earthquakes (M5). We analyzed the seismicity in the Kīlauea summit region and estimated seismic full moment tensors with their uncertainties for the 54 M5 events. These events occurred at almost daily intervals and were accompanied by intense seismicity which was concentrated between 0-3 km depths beneath the Halema‘uma‘u pit crater. The hypocenters reveal partial elliptical patterns (map view) that migrated downward by 200 m. The moment tensors reveal remarkably consistent mechanisms, with negative isotropic source types and localized uncertainties, and vertical P-axis orientations. From the moment tensors we derived Poisson’s ratios which are variable ( for the first half of the collapse events and converged to from June 26 onward.
keywords:
Seismic moment tensors, non-double-couple, isotropic, seismicity, caldera collapse, Kilauea volcano.1 Introduction
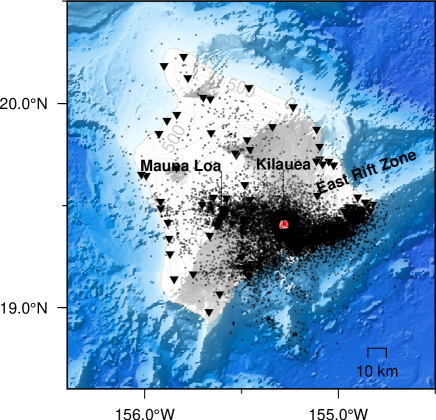
On 2018 Kīlauea volcano experienced its largest flank eruption in 200 years and a dramatic collapse of its caldera. The eruption sequence included the largest earthquake on the island in 43 years (Mw6.9; 2018-05-04), 56 other large earthquakes (Mw5) observed worldwide, and over 70,000 earthquakes (Mw0) across the island. Most of the large earthquakes (54) occurred at depths 0-3 km beneath the summit region at Halema‘uma‘u crater.
According to Neal et al. [2019], the 2018 flank eruption and caldera collapse at Kīlauea are characterized by inflationary ground deformation starting mid-March, rising lava lake levels at Pu‘u ‘Ō‘ō and Halema‘uma‘u craters through April, propagating seismicity and lava fountaning towards the Lower East Rift Zone (LERZ). On May 1 the Halema‘uma‘u summit began to deflate and lava lake levels began to drop; on May 4 the Mw6.9 earthquake occurred at about 6 km beneath Kīlauea’s south flank. Soon after the Mw6.9 earthquake, deflation of Kīlauea’s summit accelerated, and by May 10 the lava lake level had dropped by more than 300 m. Toward the end of May, the summit began to subside in episodic, almost daily patterns, and the crater floor dropping by several meters during each event. These patterns are characterized by escalating earthquake swarms of up to 700 events per day, each followed by a large earthquake (M5) and a short period of nominal seismicity levels. The last collapse event occurred on August 2, at about the same time as lava effusion stopped at the LERZ.
The 2018 activity at Kīlauea prompted major field sampling and enhanced monitoring by the USGS Hawaiian Volcano Observatory and collaborators which, along with continuously operated networks, offer unprecedented capabilities to observe and interpret sustained eruption and caldera collapse in Hawai’i. Since 1900 only six other caldera collapses have been documented in detail [Gudmundsson et al., 2016], and seismological studies of caldera collapses include: Piton de la Fournaise, Réunion Island (2007) [Michon et al., 2007], Miyakejima, Japan (2000) [Geshi et al., 2002, Minson et al., 2007, Shuler et al., 2013b], Bárdarbunga, Iceland (2014-2015) [Nettles & Ekström, 1998, Gudmundsson et al., 2016], and Fernandina, Galápagos Islands (1968) [Simkin & Howard, 1970].
In this study, we analyze the collapse events in the summit region at Halema‘uma‘u crater by estimating seismic source mechanisms for the large events (Mw5) and the intervening seismicity. We estimate the full seismic moment tensors for the large events using seismic waveform data, and use a comprehensive catalog of recently relocated hypocenters for the region. Our moment tensor results reveal consistent collapse mechanisms as the collapse unfolds, and the intervening seismicity shows migration of hypocenters.
2 Data and Methods
We estimate seismic moment tensors using waveforms from all possible broadband seismic stations within a 2,000 km radius, available from IRIS-DMC. The waveforms were downloaded and processed using ObsPy, a python-based package for seismology [Beyreuther et al., 2010, Megies et al., 2011, Krischer et al., 2015].
The processing steps for each event were: (1) obtain three-component waveforms and metadata from IRIS-DMC; (2) remove instrument response using an 4-pole Butterworth filter with corner frequencies 0.005, 0.006, 10.0, and 15.0 Hz (flat bandpass 0.006–10.0 Hz); (3) using the source-station azimuth and the sensor orientation angle, rotate horizontal components to radial and transverse directions. Additional processing steps, such as cutting time windows and additional bandpass filtering were applied during the moment tensor inversions. In our analysis, the waveforms at near stations (up to 15 km distance) show larger amplitude oscillations that may be related to near field effects, while farther stations (100 km) show waveforms with lower signal-to-noise ratio. Therefore, in order to obtain robust moment tensor estimates we used data from stations within these distances.
We estimate full seismic moment tensors and their uncertainties for each event using the methodology described in Alvizuri et al. [2018]. The method involves performing an efficient search over the full parameter space of moment tensors (lune longitude, lune latitude, strike, dip, and rake) including magnitude, and uses a geometric parameterization for moment tensors and their uncertainty quantification [for more details and applications, see e.g. Alvizuri & Tape, 2016a, Silwal & Tape, 2016, Alvizuri et al., 2018]. For each moment tensor in the parameter space, synthetic seismograms are computed using a frequency-wavenumber approach [Zhu & Rivera, 2002] with a 1D (layered) Earth model, then the seismograms are compared with observed waveforms via a misfit function. The synthetic seismograms for this study were computed using a 1D layered model for the region obtained from CRUST1.0 [Laske et al., 2013].
Our moment tensor methodology has proven useful for earthquake source characterization for a range of settings in the Earth, including Uturuncu volcano in southwest Bolivia [Alvizuri & Tape, 2016b]; tectonic events at a subduction zone in southcentral Alaska [Alvizuri et al., 2018]; events possibly related to metamorphism in the Himalaya lower crust [Alvizuri & Hetényi, 2019]; and nuclear tests and cavity collapses in western USA and in North Korea [Alvizuri et al., 2018, Alvizuri & Tape, 2018].
We complemented our moment tensor results by analyzing the temporal and spatial distribution of hypocenters at Kīlauea volcano for 2018. The hypocenters were obtained from a recent comprehensive study which relocated seismicity from 32 years (1986-2018) in the Island of Hawai’i [Matoza et al., 2020]. The relocations were done with the GrowClust algorithm which combines waveform cross-correlation, hierarchical cluster analysis and relative relocations; for details, see Matoza et al. [2013] and Matoza et al. [2020]. We focused on the seismicity beneath the summit at Halema‘uma‘u crater, between longitudes [-155.30, -155.24], latitudes [19.38, 19.44], and depths [0, 3] km. In total 54 events above magnitude Mw 5 occurred in the Kīlauea summit region over a period of three months.
3 Results
3.1 Seismicity
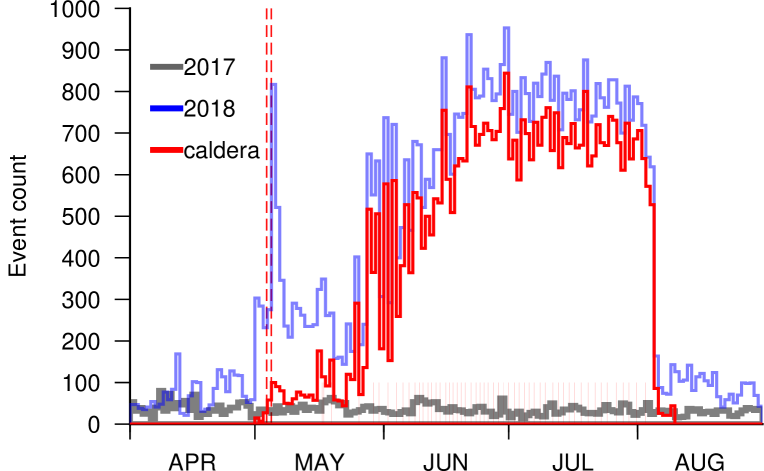
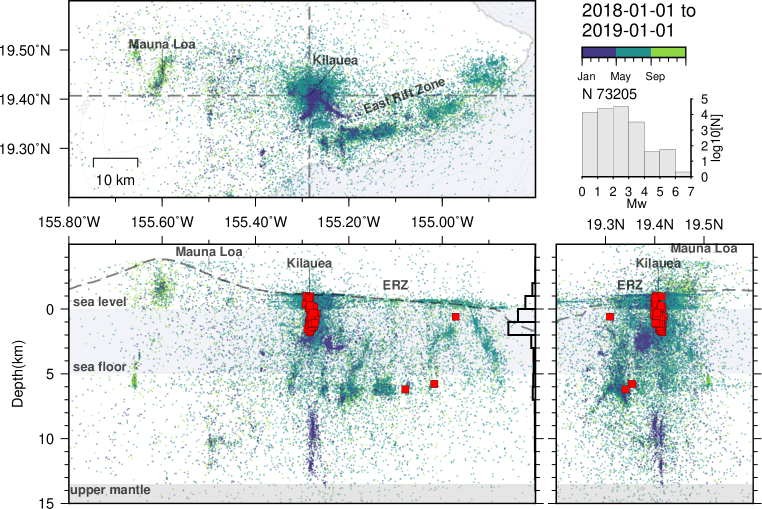
The seismicity at Kīlauea shows three main periods during 2018 (Figure 2): (1) January-April, seismic activity at background levels of about 30 events per day; (2) May-August, activity changes abruptly to 300/day and again to sustained levels up to 800/day; (3) August 4-December, activity returns to background levels. Figure 3 shows hypocenters on map and cross sections for the three periods above.
During the first period (Jan-May) the seismicity was concentrated beneath the Halema‘uma‘u summit region and was typical for the region (with approximately the same distribution from 1986-2017). The seismicity occurred rom the surface to about 3 km below sea level (bsl) and from 7-13 km bsl, and in the upper West and upper East Rift Zones from 1-3 km bsl. The gap between 3-7 km is attributed to the relatively aseismic magma storage reservoir. The next period (May-Aug) shows elevated seismicity in the same Halema‘uma‘u summit region and along ERZ (depths 3-7 km bsl). In the next period (Aug-Dec) the seismic activity decreased to background levels (though slightly more elevated than 2017 levels), and increased beneath Mauna Loa summit.
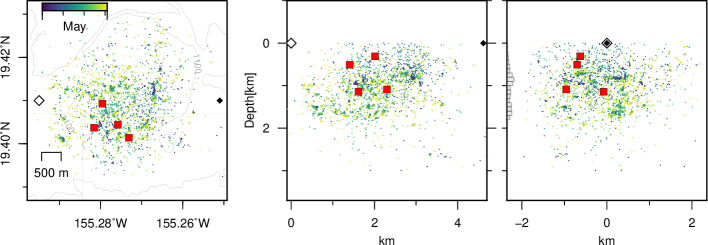
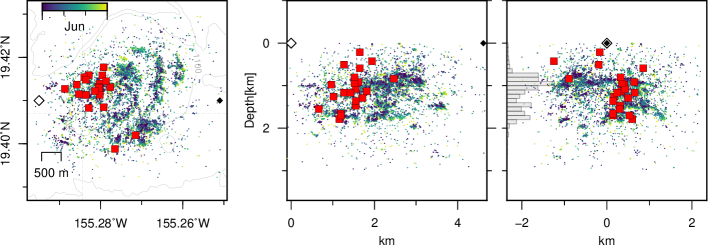
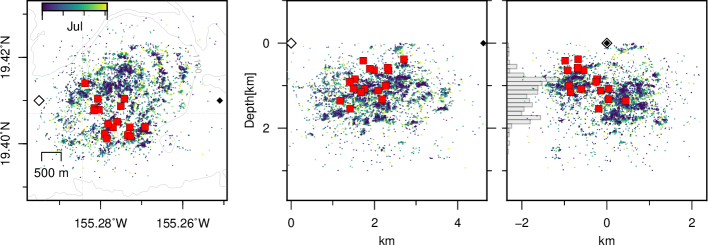
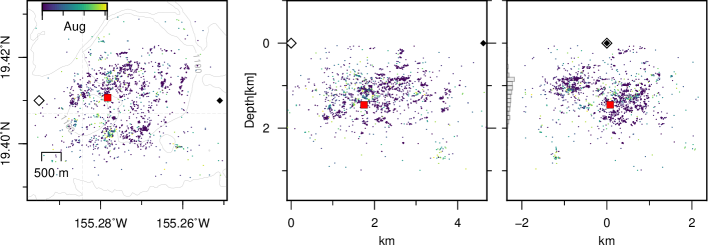
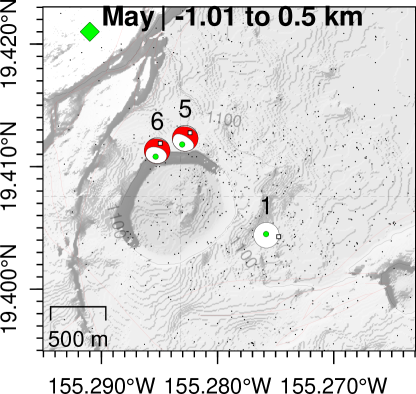
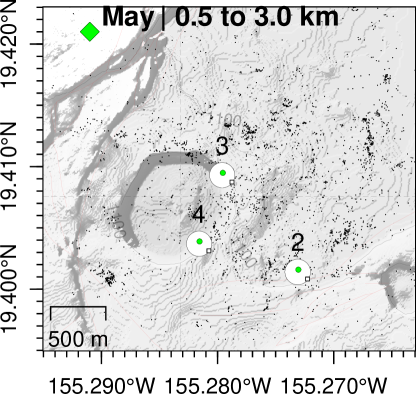
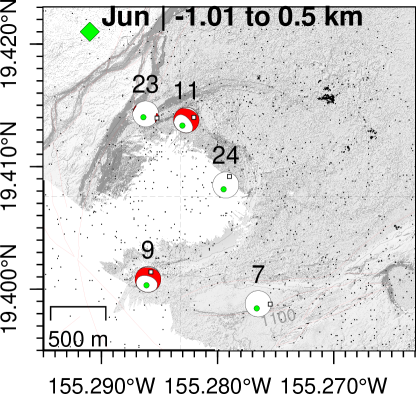
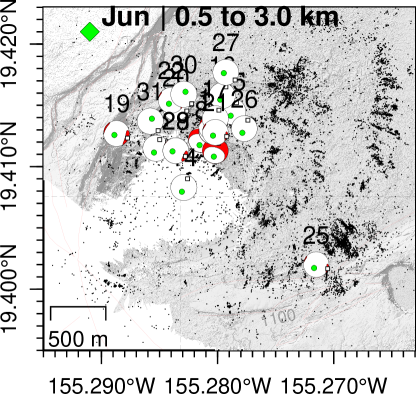
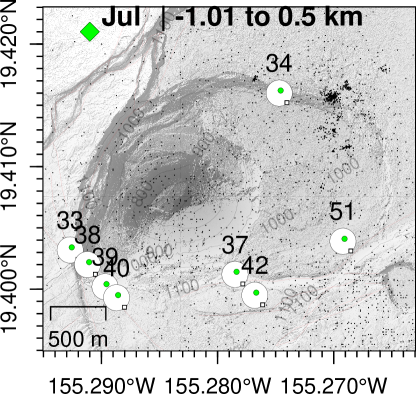
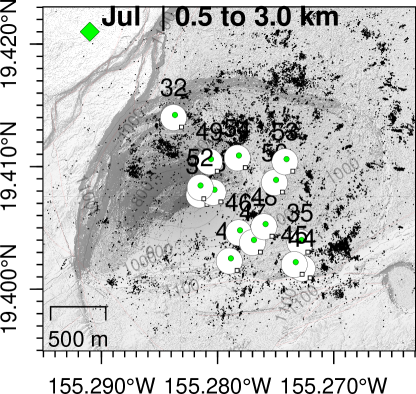
Figure 4 shows a closer view of the seismicity at Halema‘uma‘u during May-August (panels a-d). Seismic activity in May increases and is generally diffuse, then changes into distinct (partial) elliptical patterns throughout June-July, then changes back into diffuse in August until it abruptly drops to background levels on 3 August.
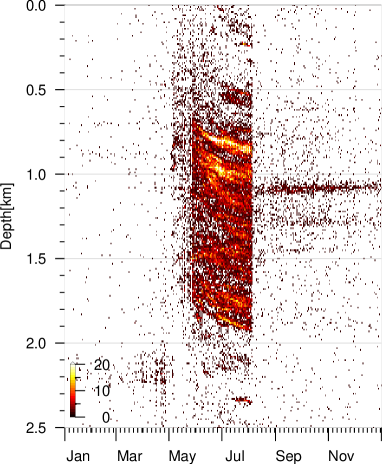
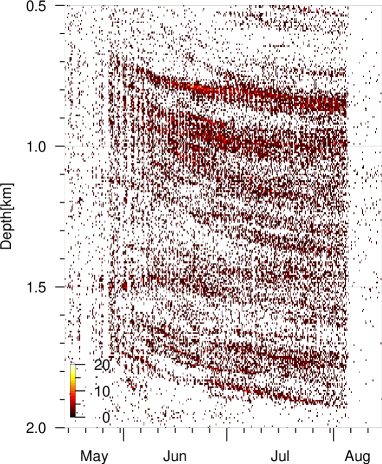
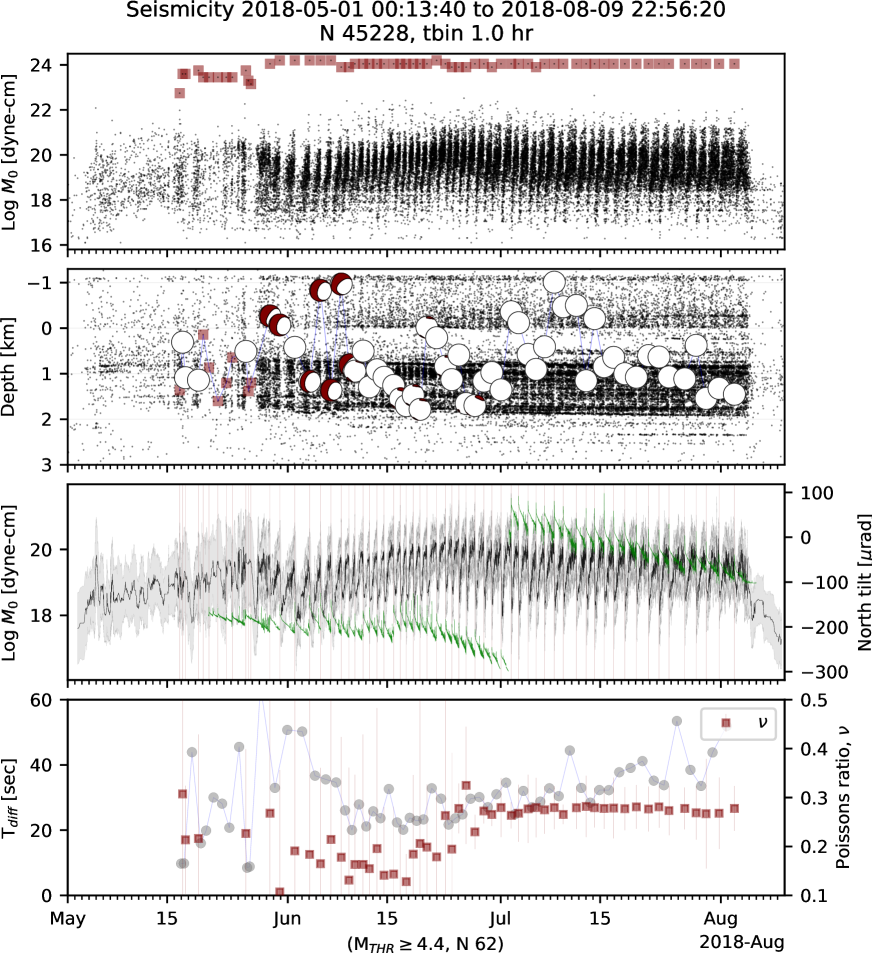
During this period the hypocenters migrated radially outward (map view) and downward (cross-section view); Figure 5 shows hypocentral depths with time beneath the Halema‘uma‘u summit region for 2018. This result shows that the peaks in seismicity are concentrated between depths 0.5-2 km beneath the summit, and throughout June-July they migrate downward by about 200 m.
3.2 Seismic moment tensors
In our results the synthetic seismograms show good agreement with observations at most seismic stations. The moment tensor uncertainty estimates for each event show best fitting mechanisms that are localized toward the negative isotropic (ISO) region on the lune (see Supplement); for details on the uncertainty analysis, see Alvizuri et al. [2018]. The supplement shows waveform fits and uncertainty estimates for the 54 events analyzed here.
The best-fitting moment tensors for the 54 events show (Table 1) consistent mechanisms with their P-axes oriented vertically and magnitudes between Mw4.9–5.6. The source durations for the first 5/54 events require source durations that decrease from 20 to 5 seconds, while the remaining 49/54 events range between 1-2 seconds (Table 1). Figure 6 shows epicenters and moment tensors at Halema‘uma‘u together with elevation models during that period.
The seismic moment tensor can also be related with a single-process source model introduced by Aki & Richards [1980] (for details and applications to other settings, see e.g. Dufumier & Rivera [1997], Tape & Tape [2013], Alvizuri & Tape [2016a], Alvizuri & Hetényi [2019]). In this model the source is represented by (possibly oblique) slip on a planar fault, and is characterized by an angle between normal and slip vectors, and Poisson’s ratio . For the Kīlauea events up to June 25 their Poisson’s ratios range between ; from June 26-on they settle on consistent values near (Figure 7d).
Figure 7 summarizes several observations and results with time: (a) seismic moment; (b) hypocentral depths; (c) median seismic moment and times of the major seismic events, tilt from station UWD (north component) near the northwest caldera rim; (d) time difference between consecutive events, Poisson’s ratios estimated from the moment tensors.
4 Discussion
Our moment tensor results for the M5 events at Kīlauea reveal consistent mechanisms with mainly vertical P-axes orientations, source types that cluster toward ISO with (Figure S3), and source durations that decrease from 20 to 5 sec and converge to 2 sec from May 30-onwards (Figures 7–6).
Similar mechanisms were also observed from the caldera collapse at Miyakejima [Shuler et al., 2013a]. In both settings the main seismic events take place after the start of volcanic eruption. The moment tensors for Miyakejima show CLVD mechanisms with mainly vertical P axes (though their analysis assumes deviatoric moment tensors) and source durations in the order of 50-60 seconds.
Seismic source studies at volcanoes may combine moment tensors with single forces to study various processes such as fluid-rock interaction [Kumagai et al., 2005, Chouet et al., 2010, Matoza et al., 2015], and caldera collapse events [e.g., Kumagai, 2001, Duputel & Rivera, 2019]. The events we analyzed for Kīlauea may also arise from combinations of similar processes, though the waveforms in our results show the moment tensor alone adequately fits the observations.
Non-double-couple moment tensors may also arise as artifacts from imperfect Earth models, anisotropy, curved faults, etc. [e.g., Kawasaki & Tanimoto, 1981, Frohlich, 1994, Julian et al., 1998]. These are known tradeoffs in full moment tensor estimation, and can also be addressed with multiple force systems, finite source studies [e.g., Fichtner & Tkalc̆ić, 2010], more accurate structure models, etc.
Seismic moment-tensor studies for nuclear explosions at the Nevada Test Site (NTS; USA) and Punggye-Ri (North Korea) reveal mechanisms with ISO parameters for the explosions, and secondary events following some explosions show ISO parameters and are presumed cavity collapses [e.g., Ford et al., 2009, Chiang et al., 2014, Cesca et al., 2017, Alvizuri et al., 2018, Alvizuri & Tape, 2018].
Field studies at NTS [e.g., Houser, 1969, Massé, 1981] and at quarry sites [e.g., Scandone, 1990], and analogue sandbox experiments [Acocella, 2007, Ruch et al., 2012] provide insight into the kinematic evolution of caldera collapses from small (cm) to intermediate scales (100s m). They show block-like collapse structures and fault systems that develop near the surface, with a range of radial and concentric cracks and chimney collapse formations at depth.
A recent study of the collapse events at Halema‘uma‘u in 2018 used GPS, tiltmeter and aerial observations, and characterized the summit collapse as a funnel-like geometry, with piston-like slumping of coherent blocks, and block areas on the order of 1.5 km2 [Anderson et al., 2019].
In our analysis the hypocenters beneath Halema‘uma‘u (including the M5 events) were concentrated between 0-3 km depths, and between May-August migrated downward by about 200 m. During this period the summit crater caved downward by up to 500 m while the crater rim expanded by about 1000 m. The epicenters in some areas form partial elliptical patterns and radial streaks (depths 0.52.0 km), and some large, shallower events (01.5 km depths) approximately follow the expanding contours of the crater (Figure 6).
During May-August the seismicity beneath the summit also shows almost daily cycles of earthquakes ramping up in count and moment release (similar patterns were also observed by Butler [2020]). Each seismicity cycle was followed by a large event (M5) and approximately 1 hr of relatively quiet periods (N10). This style in cyclic seismicity continued until Jun 28, where it changed into more sudden onsets; all cycles were still followed by a large event and a 1 hr quiet period. (The supplement shows additional views and shorter time intervals).
The seismicity cycles also coincide with tiltmeter observations from station UWD (Figure 7) to the west of the caldera rim, which shows a long period trend of tilt to the southeast, towards Halema‘uma‘u and intervening and periodic offsets that coincide with the times of the large earthquakes, and point away from Halema‘uma‘u. A recent study [Segall et al., 2019] suggests that these trends follow a primarily deflation process (revealed by subsidence at a GPS station at the Halema‘uma‘u rim) and a secondary process of ash emissions as observed by the radially outward transients (up to 89 rad at UWD). Similar tiltmeter transients were also observed on 2017 at Piton de la Fournaise (PdF), and may reflect a continuum of deformation from the roof of the magma chamber to the surface [Michon et al., 2007, 2009].
The episodic collapses at Kīlauea also appear coupled to pressure changes within the magmatic system. A recent study estimated lava effusion rates at a newly developed fissure in the LERZ using ground-based video and time-lapsed images [Patrick et al., 2019], and they observe dual cycles in lava eruption rates, one with periods of 5-10 minutes where effusion rates change from 350–1750m3s-1; another as long-term surges in effusion rates and occurring no later than 20 min after the collapse events, with effusion rates changing from 300–500m3s-1 before collapse, up to 1400m3s-1 after collapse. This suggests a hydraulic connection where the summit reservoir provides pressurized magma to the flank vents, in turn the flank vents regulate draining at the summit reservoir, and where the summit collapse events induce pressure surges within the magma conduits.
The time difference T between consecutive events at Kīlauea (with M) vary between 10-60 sec until June 9, and from June 10-on they converge on a trend that increases from about 20-40 sec. Other timings based on tiltmeter data were previously observed to range from 50-100 sec at PdF to 500-1500 sec at Miyakejima [Michon et al., 2011], and together with a piston intrusion model [Kumagai, 2001], they relate to frictional difference , piston geometry and mass, and lava effusion rates. These were variable for Kīlauea [e.g., Anderson et al., 2019, Patrick et al., 2019]. Nevertheless assuming all other variables constant, then . Our results show that T decreases from T sec. between May 15-30 and converges to 2 sec. starting June 9.
Core samples down to 1200 m beneath Halema‘uma‘u reveal mainly basalt [Zablocki et al., 1974, Keller et al., 1979], and a seismic tomography study for Kīlauea estimated Poisson’s ratios between [Dawson et al., 1999]. Lab experiments where basalt samples are subjected to cyclic loading show incremental Poisson’s ratios after each cycle, up to [e.g., Schultz, 1993], and for samples from Mt. Etna [Heap et al., 2009]. Our Poisson’s ratio estimates for Kīlauea are initially variable but converge () after June 26 and may reflect similar loading cycles.
The shallow magma reservoir beneath Halema‘uma‘u is estimated to be a complex system comprising a plexus of sills, dikes, and magma filled cracks [Fiske & Kinoshita, 1969, Dawson et al., 1999, Chouet et al., 2010]. Towards the end of May the lava lake at Halema‘uma‘u crater was no longer visible, which may also indicate partial vacating from the magma reservoir. The Poisson’s ratios in our results trend from to 0.1 between May until June 18, and may reflect staggered and deepening collapses within the plexus that became evacuated. The consistency in the moment tensor mechanisms and estimates from June 19-onwards may reflect collapses within a setting that is more consolidated and less accomodating.
5 Conclusion
The 2018 caldera collapse at Kīlauea volcano was accompanied by 54 major (Mw5) earthquakes and intervening seismicity which was concentrated at depths 0-3 km beneath the summit area at Halema‘uma‘u pit crater. The intervening seismicity migrated downward by 200 m, approximately in daily cycles. The seismicity in some locations formed partial elliptical patterns (map view), and patterns radially outward from the pit crater (view at depth). We estimated seismic full moment tensors for the 54 (Mw5) events using waveform data from broadband seismic sensors. The results reveal moment tensors with consistent negative isotropic mechanisms and vertical P-axes orientations. Poisson’s ratios estimated from the moment tensors are initially variable () and converge to from June 26-onwards. Incremental Poisson’s ratios for the collapse events may reflect loading cycles that are observed in lab experiments. The initial variability and later consistency in estimates may reflect conditions within the roof blocks and plexus that are at first accomodating and variable, and later become consolidated. The negative isotropic mechanisms may reflect collapses within the evacuated plexus that comprise the magma chamber.
 |
 |
 |
 |
 |
 |
 |
 |
 |
 |
 |
 |
| No. | Origin time | Lon | Lat | Dep | Inv | Mw | Dur. | Lune | Lune | Strike | Dip | Slip | VR |
|---|---|---|---|---|---|---|---|---|---|---|---|---|---|
| (UTC) | (km) | (km) | (sec) | Lon | Lat | ||||||||
| 1 | 2018-05-17T04:15:30.0459 | -155.2758 | 19.4044 | 0.308 | 1 | 5.00 | 20 | 24 | -43 | 58 | 61 | -56 | 56 |
| 2 | 2018-05-17T14:04:11.1334 | -155.2731 | 19.4014 | 1.088 | 1 | 5.10 | 15 | 16 | -53 | 35 | 50 | -88 | 86 |
| 3 | 2018-05-19T09:58:33.3367 | -155.2796 | 19.4093 | 1.142 | 1 | 4.90 | 10 | 20 | -43 | 62 | 63 | -69 | 77 |
| 4 | 2018-05-26T02:15:52.2337 | -155.2816 | 19.4037 | 0.510 | 1 | 5.00 | 15 | 18 | -44 | 61 | 60 | -72 | 76 |
| 5 | 2018-05-29T11:56:11.1570 | -155.2828 | 19.4123 | -0.270 | 1 | 5.40 | 5 | 12 | 5 | 216 | 7 | 8 | 84 |
| 6 | 2018-05-30T20:53:50.0830 | -155.2852 | 19.4113 | -0.070 | 1 | 5.40 | 2 | 19 | -23 | 163 | 11 | -43 | 87 |
| 7 | 2018-06-01T23:37:15.5938 | -155.2765 | 19.3988 | 0.421 | 1 | 5.40 | 2 | 18 | -15 | 201 | 19 | -22 | 88 |
| 8 | 2018-06-04T01:50:49.9187 | -155.2814 | 19.4122 | 1.168 | 1 | 5.40 | 2 | 21 | -15 | 176 | 9 | -31 | 89 |
| 9 | 2018-06-05T14:32:34.4450 | -155.2860 | 19.4008 | -0.830 | 1 | 5.50 | 2 | 21 | -35 | 183 | 23 | -46 | 87 |
| 10 | 2018-06-07T02:06:38.8952 | -155.2802 | 19.4113 | 1.362 | 1 | 5.40 | 2 | 21 | -16 | 191 | 16 | -28 | 87 |
| 11 | 2018-06-08T12:44:39.9650 | -155.2827 | 19.4138 | -0.970 | 1 | 5.30 | 1 | 25 | -32 | 137 | 9 | -73 | 87 |
| 12 | 2018-06-09T14:48:18.8490 | -155.2805 | 19.4129 | 0.804 | 1 | 5.40 | 2 | 25 | -31 | 172 | 16 | -50 | 88 |
| 13 | 2018-06-10T10:51:02.2379 | -155.2805 | 19.4132 | 0.943 | 1 | 5.40 | 2 | 25 | -31 | 172 | 16 | -50 | 88 |
| 14 | 2018-06-11T14:43:54.4867 | -155.2829 | 19.4083 | 0.503 | 1 | 5.40 | 2 | 26 | -30 | 188 | 20 | -44 | 88 |
| 15 | 2018-06-12T11:52:51.1808 | -155.2787 | 19.4145 | 1.289 | 1 | 5.50 | 2 | 25 | -42 | 199 | 30 | -51 | 88 |
| 16 | 2018-06-13T13:39:37.7992 | -155.2796 | 19.4158 | 0.915 | 1 | 5.40 | 2 | 28 | -29 | 115 | 8 | -90 | 87 |
| 17 | 2018-06-14T13:19:37.7572 | -155.2802 | 19.4139 | 1.079 | 1 | 5.50 | 2 | 24 | -33 | 167 | 16 | -57 | 87 |
| 18 | 2018-06-15T21:56:40.0360 | -155.2853 | 19.4115 | 1.258 | 1 | 5.50 | 2 | 25 | -41 | 197 | 29 | -49 | 86 |
| 19 | 2018-06-16T20:18:18.8038 | -155.2887 | 19.4127 | 1.549 | 2 | 5.50 | 2 | 29 | -30 | 151 | 17 | -67 | 87 |
| 20 | 2018-06-17T16:26:13.3561 | -155.2836 | 19.4148 | 1.701 | 2 | 5.60 | 2 | 29 | -39 | 161 | 24 | -70 | 85 |
| 21 | 2018-06-18T16:12:49.9138 | -155.2802 | 19.4128 | 1.474 | 1 | 5.40 | 2 | 25 | -39 | 207 | 33 | -45 | 86 |
| 22 | 2018-06-19T15:05:34.4552 | -155.2840 | 19.4154 | 1.784 | 2 | 5.30 | 1 | 13 | -34 | 224 | 41 | -59 | 87 |
| 23 | 2018-06-20T14:22:23.3430 | -155.2862 | 19.4143 | -0.020 | 1 | 5.40 | 2 | 26 | -40 | 245 | 58 | -60 | 85 |
| 24 | 2018-06-21T23:12:59.9939 | -155.2793 | 19.4085 | 0.210 | 1 | 5.40 | 2 | 25 | -41 | 197 | 29 | -49 | 83 |
| 25 | 2018-06-23T04:52:16.6877 | -155.2715 | 19.4020 | 0.837 | 1 | 5.20 | 1 | 24 | -34 | 227 | 43 | -48 | 82 |
| 26 | 2018-06-24T02:34:37.7015 | -155.2777 | 19.4131 | 1.131 | 1 | 5.20 | 1 | 28 | -39 | 210 | 35 | -45 | 82 |
| 27 | 2018-06-25T02:12:24.4592 | -155.2793 | 19.4177 | 0.589 | 1 | 5.50 | 2 | 16 | -58 | 229 | 40 | -88 | 85 |
| 28 | 2018-06-26T03:02:45.5098 | -155.2836 | 19.4113 | 1.655 | 2 | 5.30 | 1 | 4 | -44 | 50 | 55 | -83 | 86 |
| 29 | 2018-06-27T08:40:40.0691 | -155.2836 | 19.4113 | 1.700 | 2 | 5.60 | 2 | 18 | -50 | 51 | 55 | -87 | 87 |
| 30 | 2018-06-28T14:48:50.0711 | -155.2829 | 19.4159 | 1.162 | 1 | 5.60 | 2 | 22 | -57 | 239 | 51 | -76 | 84 |
| 31 | 2018-06-29T17:50:46.6834 | -155.2858 | 19.4137 | 0.974 | 1 | 5.60 | 2 | 22 | -57 | 239 | 51 | -76 | 84 |
| 32 | 2018-07-01T00:51:13.3348 | -155.2838 | 19.4140 | 1.355 | 1 | 5.50 | 2 | 13 | -56 | 225 | 38 | -87 | 83 |
| 33 | 2018-07-02T11:24:46.6190 | -155.2927 | 19.4032 | -0.360 | 1 | 5.60 | 2 | 21 | -56 | 47 | 53 | -89 | 81 |
| 34 | 2018-07-03T12:17:03.3810 | -155.2747 | 19.4160 | -0.120 | 1 | 5.50 | 2 | 16 | -58 | 53 | 51 | -81 | 83 |
| 35 | 2018-07-04T20:19:11.1204 | -155.2729 | 19.4038 | 0.575 | 1 | 5.50 | 2 | 16 | -52 | 70 | 60 | -71 | 81 |
| 36 | 2018-07-05T23:20:04.4998 | -155.2816 | 19.4077 | 0.905 | 1 | 5.50 | 2 | 13 | -56 | 225 | 38 | -87 | 82 |
| 37 | 2018-07-07T04:04:38.8621 | -155.2785 | 19.4012 | 0.409 | 1 | 5.60 | 2 | 16 | -58 | 53 | 51 | -81 | 83 |
| 38 | 2018-07-08T12:54:50.0330 | -155.2912 | 19.4020 | -1.010 | 1 | 5.60 | 2 | 17 | -57 | 55 | 54 | -78 | 84 |
| 39 | 2018-07-09T19:20:46.6280 | -155.2897 | 19.4002 | -0.470 | 1 | 5.70 | 2 | 22 | -57 | 239 | 51 | -76 | 84 |
| 40 | 2018-07-11T15:45:53.3220 | -155.2887 | 19.3993 | -0.500 | 1 | 5.60 | 2 | 19 | -53 | 70 | 58 | -71 | 83 |
| 41 | 2018-07-13T00:42:27.7436 | -155.2790 | 19.4023 | 1.155 | 1 | 5.50 | 2 | 15 | -53 | 58 | 60 | -75 | 81 |
| 42 | 2018-07-14T05:08:03.3680 | -155.2768 | 19.3995 | -0.210 | 1 | 5.60 | 2 | 17 | -57 | 55 | 54 | -78 | 83 |
| 43 | 2018-07-15T13:26:05.5039 | -155.2804 | 19.4079 | 0.845 | 1 | 5.60 | 2 | 16 | -55 | 56 | 53 | -86 | 82 |
| 44 | 2018-07-16T21:42:36.6299 | -155.2727 | 19.4017 | 0.641 | 1 | 5.50 | 2 | 15 | -53 | 58 | 60 | -75 | 83 |
| 45 | 2018-07-18T11:28:04.4791 | -155.2734 | 19.4020 | 1.000 | 1 | 5.60 | 2 | 17 | -57 | 55 | 54 | -78 | 84 |
| 46 | 2018-07-20T02:33:02.2956 | -155.2782 | 19.4046 | 1.077 | 1 | 5.60 | 2 | 16 | -58 | 53 | 51 | -81 | 84 |
| 47 | 2018-07-21T19:43:29.9534 | -155.2770 | 19.4038 | 0.601 | 1 | 5.60 | 2 | 16 | -58 | 53 | 51 | -81 | 81 |
| 48 | 2018-07-23T06:53:39.9521 | -155.2760 | 19.4051 | 0.633 | 1 | 5.60 | 2 | 16 | -58 | 53 | 51 | -81 | 84 |
| 49 | 2018-07-24T16:41:10.0831 | -155.2807 | 19.4104 | 1.070 | 1 | 5.60 | 2 | 19 | -53 | 70 | 58 | -71 | 83 |
| 50 | 2018-07-26T22:09:11.1978 | -155.2751 | 19.4087 | 1.114 | 1 | 5.60 | 2 | 16 | -55 | 56 | 53 | -86 | 82 |
| 51 | 2018-07-28T12:37:26.6136 | -155.2692 | 19.4039 | 0.377 | 1 | 5.60 | 2 | 16 | -58 | 53 | 51 | -81 | 78 |
| 52 | 2018-07-29T22:10:26.6263 | -155.2815 | 19.4083 | 1.543 | 2 | 5.40 | 2 | 10 | -46 | 52 | 53 | -77 | 83 |
| 53 | 2018-07-31T17:59:47.7051 | -155.2742 | 19.4104 | 1.322 | 1 | 5.50 | 2 | 16 | -52 | 70 | 60 | -71 | 83 |
| 54 | 2018-08-02T21:55:13.3274 | -155.2783 | 19.4107 | 1.451 | 1 | 5.60 | 2 | 17 | -57 | 55 | 54 | -78 | 86 |
Acknowledgements
We thank Joël Ruch for illuminating discussions about faulting and collapse styles at Kīlauea and other calderas, and Walter Tape & Carl Tape for discussion about moment tensors. R.S.M. was supported by NSF grant EAR-1446543.
References
- Acocella [2007] Acocella, V. (2007). Understanding caldera structure and development: An overview of analogue models compared to natural calderas. Earth-Sci. Rev., 85, 125–160. doi:10.1016/j.earscirev.2007.08.004.
- Aki & Richards [1980] Aki, K., & Richards, P. G. (1980). Quantitative Seismology, Theory and Methods. San Francisco, Calif., USA: W. H. Freeman.
- Alvizuri & Hetényi [2019] Alvizuri, C., & Hetényi, G. (2019). Source mechanism of a lower crust earthquake beneath the Himalayas and its possible relation to metamorphism. Tectonophysics, 769, 128153. doi:10.1016/j.tecto.2019.06.023.
- Alvizuri et al. [2018] Alvizuri, C., Silwal, V., Krischer, L., & Tape, C. (2018). Estimation of full moment tensors, including uncertainties, for nuclear explosions, volcanic events, and earthquakes. J. Geophys. Res. Solid Earth, 123, 5099–5119. doi:10.1029/2017JB015325.
- Alvizuri & Tape [2016a] Alvizuri, C., & Tape, C. (2016a). Full moment tensors for small events () at Uturuncu volcano, Bolivia. Geophys. J. Int., 206, 1761–1783. doi:10.1093/gji/ggw247.
- Alvizuri & Tape [2016b] Alvizuri, C., & Tape, C. (2016b). Full moment tensors for small events () at Uturuncu volcano, Bolivia. Geophys. J. Int., 206, 1761–1783. doi:10.1093/gji/ggw247.
- Alvizuri & Tape [2018] Alvizuri, C., & Tape, C. (2018). Full moment tensor analysis of nuclear explosions in North Korea. Seismol. Res. Lett., 89, 2139–2151. doi:10.1785/0220180158.
- Anderson et al. [2019] Anderson, K. R., Johanson, I. A., Patrick, M. R., Gu, M., Poland, P. S. M. P., Montgomery-Brown, E. K., & Miklius, A. (2019). Magma reservoir failure and the onset of caldera collapse at Kīlauea Volcano in 2018. Science, 366, eaaz1822. doi:10.1126/science.aaz1822.
- Beyreuther et al. [2010] Beyreuther, M., Barsch, R., Krischer, L., Megies, T., Behr, Y., & Wassermann, J. (2010). ObsPy: A Python toolbox for seismology. Seismol. Res. Lett., 81, 530–533. doi:10.1785/gssrl.81.3.530.
- Butler [2020] Butler, R. (2020). Volcanic earthquake foreshocks during the 2018 collapse of Kīlauea Caldera. Geophys. J. Int., 220, 71–78. doi:10.1093/gji/ggz425.
- Cesca et al. [2017] Cesca, S., Heimann, S., Kriegerowski, M., Saul, J., & Dahm, T. (2017). Moment Tensor Inversion for Nuclear Explosions: What Can We Learn from the 6 January and 9 September 2016 Nuclear Tests, North Korea? Seismol. Res. Lett., 88, 300–310. doi:10.1785/0220160139.
- Chiang et al. [2014] Chiang, A., Dreger, D. S., Ford, S. R., & Walter, W. R. (2014). Source characterization of underground explosions from combined regional moment tensor and first-motion analysis. Bull. Seismol. Soc. Am., 104, 1587–1600. doi:10.1785/0120130228.
- Chouet et al. [2010] Chouet, B. A., Dawson, P. B., James, M. R., & Lane, S. J. (2010). Seismic source mechanism of degassing bursts at Kilauea Volcano, Hawaii: Results from waveform inversion in the 10–50 s band. Journal of Geophysical Research: Solid Earth, 115, B09311. doi:10.1029/2009JB006661. 00056.
- Dawson et al. [1999] Dawson, P. B., Chouet, B. A., Okubo, P. G., Villaseñor, A., & Benz, H. M. (1999). Three-dimensional velocity structure of the Kilauea Caldera, Hawaii. Geophys. Res. Lett., 26, 2805–2808. doi:10.1029/1999GL005379.
- Dufumier & Rivera [1997] Dufumier, H., & Rivera, L. (1997). On the resolution of the isotropic component in moment tensor inversion. Geophys. J. Int., 131, 595–606.
- Duputel & Rivera [2019] Duputel, Z., & Rivera, L. (2019). The 2007 caldera collapse of Piton de la Fournaise volcano: Source process from very-long-period seismic signals. Earth Planet. Sci. Lett., 527, 115786. doi:10.1016/j.epsl.2019.115786.
- Fichtner & Tkalc̆ić [2010] Fichtner, A., & Tkalc̆ić, H. (2010). Insights into the kinematics of a volcanic caldera drop: Probabilistic finite-source inversion of the 1996 Bárdarbunga, Iceland, earthquake. Earth Planet. Sci. Lett., 297, 607–615. doi:10.1016/j.epsl.2010.07.013.
- Fiske & Kinoshita [1969] Fiske, R. S., & Kinoshita, W. T. (1969). Inflation of Kilauea volcano prior to its 1967-1968 eruption. Science, 165, 341–349.
- Ford et al. [2009] Ford, S. R., Dreger, D. S., & Walter, W. R. (2009). Identifying isotropic events using a regional moment tensor inversion. J. Geophys. Res., 114. doi:10.1029/2008JB005743.
- Frohlich [1994] Frohlich, C. (1994). Earthquakes with non-double-couple mechanisms. Science, 264, 804–809.
- Gardner & Knopoff [1974] Gardner, J. K., & Knopoff, L. (1974). Is the sequence of earthquakes in Southern California, with aftershocks removed, Poissonian? Bull. Seismol. Soc. Am., 64, 1363–1367.
- Geshi et al. [2002] Geshi, N., Shimano, T., Chiba, T., & Nakada, S. (2002). Caldera collapse during the 2000 eruption of Miyakejima Volcano, Japan. Bull. Volcanology, 64, 55–68. doi:10.1007/s00445-001-0184-z.
- Gudmundsson et al. [2016] Gudmundsson, M. T., Jónsdóttir, K., Hooper, A., Holohan, E. P., Halldórsson, S. A., Ófeigsson, B. G., Cesca, S., Vogfjörd, K. S., Sigmundsson, F., Högnadóttir, T., Einarsson, P., Sigmarsson, O., Jarosch, A. H., Jónasson, K., Magnússon, E., Hreinsdóttir, S., Bagnardi, M., Parks, M. M., Hjörleifsdóttir, V., Pálsson, F., Walter, T. R., Schöpfer, M. P. J., Heimann, S., Reynolds, H. I., Dumont, S., Bali, E., Gudfinnsson, G. H., Dahm, T., Roberts, M. J., Hensch, M., Belart, J. M. C., Spaans, K., Jakobsson, S., Gudmundsson, G. B., Fridriksdóttir, H. M., Drouin, V., Dürig, T., Aðalgeirsdóttir, G., Riishuus, M. S., Pedersen, G. B. M., van Boeckel, T., Oddsson, B., Pfeffer, M. A., Barsotti, S., Bergsson, B., Donovan, A., Burton, M. R., & Aiuppa, A. (2016). Gradual caldera collapse at Bárdarbunga volcano, Iceland, regulated by lateral magma outflow. Science, 353, aaf8988. doi:10.1126/science.aaf8988.
- Heap et al. [2009] Heap, M. J., Vinciguerra, S., & Meredith, P. G. (2009). The evolution of elastic moduli with increasing crack damage during cyclic stressing of a basalt from Mt. Etna volcano. Tectonophysics, 471, 153–160. doi:10.1016/j.tecto.2008.10.004.
- Houser [1969] Houser, F. (1969). Subsidence related to underground nuclear explosions, Nevada Test Site. Bull. Seismol. Soc. Am., 59, 2231–2251.
- Julian et al. [1998] Julian, B. R., Miller, A. D., & Foulger, G. R. (1998). Non-double-couple earthquakes: 1. Theory. Rev. Geophys., 36, 525–549. doi:10.1029/98RG00716.
- Kawasaki & Tanimoto [1981] Kawasaki, I., & Tanimoto, T. (1981). Radiation patterns of body waves due to the seismic dislocation occurring in an anisotropic source medium. Bull. Seismol. Soc. Am., 71, 37–50.
- Keller et al. [1979] Keller, G. V., Grose, L. T., Murray, J. C., & Skokan, C. K. (1979). Results of an experimental drill hole at the summit of kilauea volcano, Hawaii. J. Volcan. Geothermal Res., 5, 345 – 385. doi:10.1016/0377-0273(79)90024-6.
- Krischer et al. [2015] Krischer, L., Mengies, T., Barsch, R., Beyreuther, M., Lecocq, T., Caudron, C., & Wassermann, J. (2015). ObsPy: a bridge for seismology into the scientific Python ecosystem. Computational Science & Discovery, 8. doi:10.1088/1749-4699/8/1/014003.
- Kumagai [2001] Kumagai, H. (2001). Very-Long-Period Seismic Signals and Caldera Formation at Miyake Island, Japan. Science, 293, 687–690. doi:10.1126/science.1062136.
- Kumagai et al. [2005] Kumagai, H., Chouet, B., & Dawson, P. B. (2005). Source process of a long-period event at Kilauea volcano, Hawaii. Geophys. J. Int., 161, 243–254. doi:10.1111/j.1365-246X.2005.02502.x.
- Laske et al. [2013] Laske, G., Masters, G., Ma, Z., & Pasyanos, M. E. (2013). Update on CRUST1.0: A 1-degree global model of Earth’s crust. In Geophys. Res. Abstracts. volume 15. Abstract EGU2013-2658.
- Massé [1981] Massé, R. P. (1981). Review of seismic source models for underground nuclear explosions. Bull. Seismol. Soc. Am., 71, 1249–1268.
- Matoza et al. [2015] Matoza, R. S., Chouet, B. A., Dawson, P. B., Shearer, P. M., Haney, M. M., Waite, G. P., Moran, S. C., & Mikesell, T. D. (2015). Source mechanism of small long-period events at Mount St. Helens in July 2005 using template matching, phase-weighted stacking, and full-waveform inversion. J. Geophys. Res. Solid Earth, 120, 6351–6364. doi:10.1002/2015JB012279.
- Matoza et al. [2020] Matoza, R. S., Okubo, P. G., & Shearer, P. M. (2020). Comprehensive high-precision relocation of seismicity on the Island of Hawai’i 1986-2018. Earth and Space Sci.(in review), .
- Matoza et al. [2013] Matoza, R. S., Shearer, P. M., Lin, G., Wolfe, C. J., & Okubo, P. G. (2013). Systematic relocation of seismicity on Hawaii Island from 1992 to 2009 using waveform cross correlation and cluster analysis. J. Geophys. Res., 118, 2275–2288. doi:10.1002/jgrb.50189.
- Megies et al. [2011] Megies, T., Beyreuther, M., Barsch, R., Krischer, L., & Wassermann, J. (2011). ObsPy–What can it do for data centers and observatories? Annals. Geophy., 54, 47–58.
- Michon et al. [2011] Michon, L., Massin, F., Famin, V., Ferrazzini, V., & Roult, G. (2011). Basaltic calderas: Collapse dynamics, edifice deformation, and variations of magma withdrawal. Journal of Geophysical Research, 116, B03209. doi:10.1029/2010JB007636.
- Michon et al. [2007] Michon, L., Staudacher, T., Ferrazzini, V., Bachèlery, P., & Marti, J. (2007). April 2007 collapse of Piton de la Fournaise: A new example of caldera formation. Geophysical Research Letters, 34, L21301. doi:10.1029/2007GL031248.
- Michon et al. [2009] Michon, L., Villeneuve, N., Catry, T., & Merle, O. (2009). How summit calderas collapse on basaltic volcanoes: New insights from the April 2007 caldera collapse of Piton de la Fournaise volcano. Journal of Volcanology and Geothermal Research, 184, 138–151. doi:10.1016/j.jvolgeores.2008.11.003.
- Minson et al. [2007] Minson, S. E., Dreger, D. S., Bürgmann, R., Kanamori, H., & Larson, K. M. (2007). Seismically and geodetically determined nondouble-couple source mechanisms from the 2000 Miyakejima volcanic earthquake swarm. J. Geophys. Res., 112. doi:10.1029/2006JB004847.
- Neal et al. [2019] Neal, C. A., Brantley, S. R., Antolik, L., Babb, J. L., Burgess, M., Calles, K., Cappos, M., Chang, J. C., Conway, S., Desmither, L., Dotray, P., Elias, T., Fukunaga, P., Fuke, S., Johanson, I. A., Kamibayashi, K., Kauahikaua, J., Lee, R. L., Pekalib, S., Miklius, A., Million, W., Moniz, C. J., Nadeau, P. A., Okubo, P. G., Parcheta, C., Patrick, M. R., Shiro, B., Swanson, D. A., Tollett, W., Trusdell, F., Younger, E. F., Zoeller, M. H., Montgomery-Brown, E. K., Anderson, K. R., Pol, M. P., Ball, J. L., Bard, J., Coombs, M., Dietterich, H. R., Kern, C., Thelen, W. A., Cervelli, P. F., Orr, T., Houghton, B. F., Gansecki, C., Hazlett, R., Lundgren, P., Diefenbach, A. K., Lerner, A. H., Waite, G., Kelly, P., Clor, L., Werner, C., Mulliken, K., Fisher, G., & Damby, D. (2019). The 2018 rift eruption and summit collapse of Kīlauea Volcano. Science, 363, 367–374. doi:10.1126/science.aav7046.
- Nettles & Ekström [1998] Nettles, M., & Ekström, G. (1998). Faulting mechanism of anomalous earthquakes near Bárdarbunga Volcano, Iceland. J. Geophys. Res. Solid Earth, 103, 17973–17983. doi:10.1029/98JB01392.
- Patrick et al. [2019] Patrick, M. R., Dietterich, H. R., Lyons, J. J., Diefenbach, A. K., Parcheta, C., Anderson, K. R., Namiki, A., Sumita, I., Shiro, B., & Kauahikaua, J. P. (2019). Cyclic lava effusion during the 2018 eruption of Kīlauea Volcano. Science, 366, eaay9070. doi:10.1126/science.aay9070.
- Ruch et al. [2012] Ruch, J., Acocella, V., Geshi, N., Nobile, A., & Corbi, F. (2012). Kinematic analysis of vertical collapse on volcanoes using experimental models time series. J. Geophys. Res. Solid Earth, 117, B07301. doi:10.1029/2012JB009229.
- Scandone [1990] Scandone, R. (1990). Chaotic collapse of calderas. Journal of Volcanology and Geothermal Research, 42, 285–302. doi:10.1016/0377-0273(90)90005-Z.
- Schultz [1993] Schultz, R. A. (1993). Brittle strength of basaltic rock masses with applications to Venus. J. Geophys. Res. Planets, 98, 10883–10895. doi:10.1029/93JE00691.
- Segall et al. [2019] Segall, P., Anderson, K. R., Johanson, I., & Miklius, A. (2019). Mechanics of Inflationary Deformation During Caldera Collapse: Evidence From the 2018 Kīlauea Eruption. Geophys. Res. Lett., 46, 11782–11789. doi:10.1029/2019GL084689.
- Shuler et al. [2013a] Shuler, A., Ekström, G., & Nettles, M. (2013a). Physical mechanisms for vertical-CLVD earthquakes at active volcanoes. J. Geophys. Res., 118, 1569–1586. doi:10.1002/jgrb.50131.
- Shuler et al. [2013b] Shuler, A., Nettles, M., & Ekström, G. (2013b). Global observation of vertical-CLVD earthquakes at active volcanoes. J. Geophys. Res., 118, 1–27. doi:10.1029/2012JB009721.
- Silwal & Tape [2016] Silwal, V., & Tape, C. (2016). Seismic moment tensors and estimated uncertainties in southern Alaska. J. Geophys. Res. Solid Earth, 121, 2772–2797. doi:10.1002/2015JB012588.
- Simkin & Howard [1970] Simkin, T., & Howard, K. A. (1970). Caldera Collapse in the Galápagos Islands, 1968. Science, 169, 429–437. doi:10.1126/science.169.3944.429.
- Tape & Tape [2013] Tape, W., & Tape, C. (2013). The classical model for moment tensors. Geophys. J. Int., 195, 1701–1720. doi:10.1093/gji/ggt302.
- Zablocki et al. [1974] Zablocki, C. J., Tilling, R. I., Peterson, D. W., Christiansen, R. L., Keller, G. V., & Murray, J. C. (1974). A deep research drill hole at the summit of an active volcano, Kilauea, Hawaii. Geophys. Res. Lett., 1, 323–326. doi:10.1029/GL001i007p00323.
- Zhu & Rivera [2002] Zhu, L., & Rivera, L. A. (2002). A note on the dynamic and static displacements from a point source in multilayered media. Geophys. J. Int., 148, 619–627. doi:10.1046/j.1365-246X.2002.01610.x.