NuSTAR Non-detection of a Faint Active Galactic Nucleus in an Ultraluminous IR Galaxy with Kpc-scale Fast Wind
Abstract
Large-scale outflows are generally considered as a possible evidence that active galactic nuclei (AGNs) can severely affect their host galaxies. Recently an ultraluminous IR galaxy (ULIRG) at = 0.49, AKARI J0916248+073034, was found to have a galaxy-scale [Oiii] 5007 outflow with one of the highest energy-ejection rates at 1.6. However, the central AGN activity estimated from its torus mid-IR (MIR) radiation is weak relative to the luminous [Oiii] emission. In this work we report the first NuSTAR hard X-ray follow-up of this ULIRG to constrain its current AGN luminosity. The intrinsic 2–10 keV luminosity shows a 90% upper-limit of erg s-1 assuming Compton-thick obscuration ( = cm-2), which is only 3.6% of the luminosity expected from the extinction corrected [Oiii] luminosity. With the NuSTAR observation, we succeed to identify that this ULIRG has a most extreme case of X-ray deficit among local ULIRGs. A possible scenario to explain the drastic declining in both of the corona (X-ray) and torus (MIR) is that the primary radiation from the AGN accretion disk is currently in a fading status, as a consequence of a powerful nuclear wind suggested by its powerful ionized outflow in the galaxy scale.
1 Introduction
Ultraluminous IR galaxies ( , ULIRGs) are a population of galaxies emitting nearly entire energy in IR band (Sanders & Mirabel, 1996). The high originates from dust heated by UV / optical radiation of vigorous starbursts and/or active galactic nuclei (AGNs). ULIRGs are thought to represent a rapidly growing phase of massive galaxies in the transition from disk to elliptical galaxies, as gas and dust are swept out by starburst- and / or AGN-induced outflows (e.g., Hopkins et al., 2008).
Chen et al. (2020) reported a new follow-up program for sources in the AKARI Far-Infrared Surveyor (FIS) Bright Source Catalogue111https://www.ir.isas.jaxa.jp/AKARI/Observation/update/
20160425_preliminary_release.html (ver.2)
to construct a statistical flux-limited sample of ULIRGs at intermediate redshifts ( = 0.5 – 1).
Among the sources, AKARI J0916248+073034 (hereafter J0916a) at = 0.49, indicates signatures of an extremely strong ionized-gas outflow in the Subaru / FOCAS long-slit spectroscopic image (with slit width of 0.5″, Chen et al., 2019).
The [Oiii] 5007 emission line has a FWHM of 1830 km s-1 and a shift of km s-1 relative to stellar absorption lines.
The long-slit spectroscopic image shows that the outflow extends to a radius of 4 kpc.
The mass-loss and energy-ejection () rates are estimated to be 500 yr-1 and erg s-1, respectively,
implying that J0916a has one of the highest ionized outflows among ULIRGs / AGNs at 1.6 and it is comparable to the most powerful outflows in quasars at 2 (e.g., Harrison et al., 2012; Zakamska et al., 2016). Emission line ratios indicate that the outflow is driven by AGN.
The strong [Oiii] emission line ( erg s-1 after extinction correction222 The extinction is estimated to be = using Balmer decrement, which is close to the typical amount of dust attenuation in local ULIRGs (e.g., García-Marín et al., 2009).) implies that the AGN is luminous with bolometric luminosity333Throughout the paper we use to denote the luminosity in a given band or wavelength range estimated from the employed indicator. () of erg s-1 using the empirical relationships (Ueda et al., 2015; Ricci et al., 2017). However, the mid-IR (MIR) radiation originating from dusty torus in the vicinity ( 10 pc) of the SMBH is weak. The 5–38 µm MIR luminosity () of J0916a is erg s-1, which is integrated using the best-fit SED of AGN component reported in Chen et al. (2019)444There is a mistake in Table 3 of Chen et al. (2019). The reported value of was not the bolometric luminosity of AGN, but the total integrated luminosity of the best-fit AGN SED including the torus thermal and scattering radiation and the transmitted primary emission.. The corresponding bolometric luminosity with the empirical function (Ichikawa et al., 2019b) is = erg s-1, which is only 32% of and would indicate that the central engine of the AGN in J0916a is declining, i.e., the AGN is currently less active than its past epoch, while the observed strong [Oiii] emission with extreme outflow reflect a historical effect of the AGN during its preceding active phase, due to the time-lag between AGN activity in the nuclear region and outflow in the galaxy scale (e.g., Harrison, 2017).
Recent works reported the luminosity declining of AGN within a timescale of – years in a population called “fading AGN” or “dying AGN” (e.g., Schawinski et al., 2010). This population shows AGN signatures in large spatial scales, e.g., radio jets and / or bright [Oiii] line in the kpc-scale narrow line region (NLR), but lack the features in small scales, e.g., weak or lack of X-ray (corona) and / or MIR (torus) emission. The faintness in small scales of those objects implies a transient stage that the central engine was active in the past, but currently seems quenched (Kawamuro et al., 2017; Ichikawa et al., 2019a, c; Cooke et al., 2020). The “changing-look AGN” is another population of AGNs which shows drastically declining by an order of magnitude in 1–10 years (e.g., LaMassa et al., 2015; MacLeod et al., 2016) as their accretion states change from bright (standard disk) phase to faint (radiatively inefficient accretion flow) phase (e.g., Noda & Done, 2018; Ruan et al., 2019). Recent X-ray studies of ULIRGs presented that the coronae in ULIRGs could be intrinsically weak compared to normal AGNs (e.g., Teng et al., 2015).
In order to constrain the current activity of the AGN in J0916a, hard X-ray observation over 10 keV is required with its power to penetrate the heavy obscuration in the nuclear region (e.g., Ricci et al., 2015). There is no previous X-ray observation for J0916a and it is not detected in the Swift/BAT 14-195 keV survey due to its faintness at a relatively high redshift. In this letter we report the first hard X-ray follow-up of J0916a with NuSTAR (Harrison et al., 2013). Thanks to a wide energy range over 10 keV with great sensitivity, NuSTAR makes it capable to directly constrain the intrinsic AGN luminosity in J0916a even in the case with Compton-thick absorption, e.g., gas column density () of at least cm-2. Throughout the paper we adopt the cosmological parameters, 70 km s-1 Mpc-1, and .
2 NuSTAR Constraint on the Intrinsic X-ray luminosity of J0916a
J0916a was observed by NuSTAR on 2020 June 16 and 17 with a total on-source exposure of 105.6 ksec (NuSTAR GO cycle-6 program 06108, PI:X.Chen). The data was reduced using the NuSTAR data analysis pipeline (nupipeline, ver.1.9.2) with the latest HEASARC’s calibration database (CALDB, ver.20200720). The South Atlantic Anomaly (SAA) filtering is adopted to reduce the observation time intervals affected by the enhancement of background event rates from passage through the SAA and the so-called “tentacle” region with the nupipeline configuration of saacalc=1 saamode=optimized tentacle=yes. The calculation algorithm “1” is chosen since it provides the best noise removal as shown in the background filtering reports for both of the two observation epochs555 The default setting saacalc=3 eliminatesource=yes evaluates count rates after the exclusion of the contribution of the brightest sources in the field of view, which could results in noise remnants for this dataset, because the object is very weak and the brightest sources can be dominated by noise.. We use the “optimized” mode since it provides comparable noise removal result with the “strict” mode but does not lose large amount of exposure as the later one (). After removal of bad time intervals, the final exposure is 37.3 ksec (96.6%) and 67.0 ksec (99.8%) on source for the first and second observation epochs, respectively. Totally four cleaned events are created from the data obtained by the two focal plane modules (FPMA and FPMB) during the two epochs.
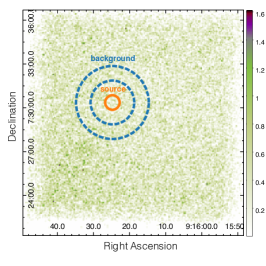
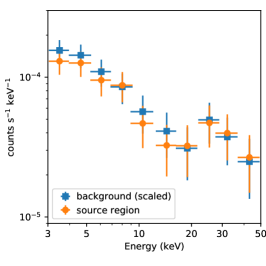
The images from the four cleaned events are merged using the FTOOLS package fimage and the co-added 6–24 keV image is shown in the left panel of Figure 1. No serendipitous sources are detected in the fields of view of the NuSTAR observations. A circular region with a radius of 30″ centered at the optical position of J0916a is employed as the source region, following the suggestion for faint objects in Section 4.3 of the NuSTAR Data Analysis Software Guide666 We also checked the spectrum extracted using a larger radius of 60″ with EEF of 90%. The net spectrum shows -39.6 counts () in 6–24 keV. The difference of estimated fluxes is about 5%, thus having little impact on our conclusion.. A radius of 30″ corresponds to a fraction of encircled energy (EEF) of 65%, which is taken into account in the later analysis. A surrounding annular region with radii of 90″ and 150″ is used to estimate the background level. For each of the four cleaned events the spectra are extracted from the source and background regions. The co-added source and background (scaled to the source region) spectra obtained with the FTOOLS package addspec are shown in the middle panel of Figure 1. There is no significant difference between the source and background spectra. The net spectrum (i.e., source background) shows counts in 3–6 keV, counts in 6–24 keV, and counts in 24–50 keV, which correspond to , , and , respectively, where is estimated from the poisson noise within the source region in each energy range. Therefore we conclude that the object is not detected.
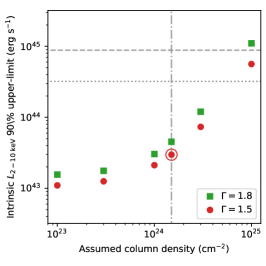
Spectral analysis is not feasible as the spectrum is dominated by background. In order to estimate the upper-bound of the X-ray luminosity, we employed a fixed, putative torus model of Ikeda et al. (2009) following Ichikawa et al. (2019c), which takes account of an torus-absorbed and Compton scattered power-law component, a reflected continuum and an accompanying fluorescent iron K line. Only the normalization of the power-law component is set as a free parameter. The cut-off energy of the power-law component is fixed to 360 keV. The opening angle of the torus is fixed to 60°, which reflects a typical covering factor for X-ray selected AGNs (e.g., Stalevski et al., 2016; Ichikawa et al., 2019b). An inclination angle of 80° is selected since J0916a is identified as a Seyfert 2 galaxy from its optical spectrum777 We have confirmed that the choice of the opening angle (45°–70°) and inclination angle (70°–89°) does not significantly affect our conclusion.. We consider two values of photon index (), i.e., 1.8, which is a typical value of normal Seyfert galaxies (e.g., Ricci et al., 2017), and 1.5, as shown in the harder spectra found in several ULIRGs (Teng et al., 2014, 2015; Oda et al., 2017). Galactic absorption of = cm-2, which is given by the FTOOLS package nh, and intrinsic obscuration with from to cm-2 are employed in the estimation. We estimate the upper-limit of the intrinsic 2–10 keV luminosity () by simulating artificial spectra with the above assumed models to achieve net counts of 3 in 6–24 keV range. The estimated 3 upper-limits with different assumptions of and are then converted to 90% upper-limits considering that the 90% confidence level corresponds to 1.645 for a normal distribution, and the results are shown in the right panel of Figure 1.
In the later discussion, we consider the estimated 90% upper-limit, erg s-1with = and = cm-2, as a fiducial value unless otherwise stated888We also estimate the upper-limit using Xspec fit with C-statistic. The upper-limits from the two methods are consistent within a factor of 1.1.. The X-ray studies of ULIRGs (Teng et al., 2014, 2015; Iwasawa et al., 2017, 2018; Oda et al., 2017; Tombesi et al., 2017; Xu et al., 2017; Toba et al., 2020) show that varies in a range from cm-2 (e.g., IRAS F05189–2524) to cm-2 (e.g., IRAS F13120–5453), hence = cm-2 is a reasonable assumption to account for Compton-thick obscuration.
Using the empirical relation of Lehmer et al. (2010), the estimated contributed by high-mass X-ray binaries (HMXBs) in the host galaxy is 2 erg s-1 with stellar mass of and star formation rate of 1000 yr-1, which is much lower than the 90% upper-limit . Therefore hereafter we ignore the contribution of HMXBs and consider the 90% upper-limit as the upper-bound of AGN X-ray luminosity.
3 Discussions
3.1 X-ray faintness relative to NLR emission
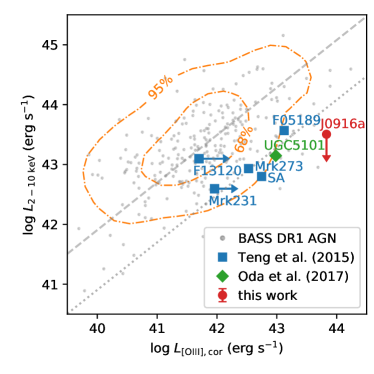
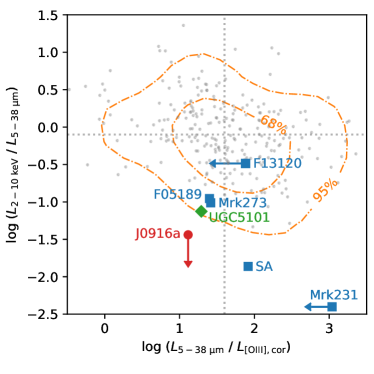
Figure 2 (left panel) shows the intrinsic and extinction corrected of J0916a compared to six well-studied nearby () ULIRGs from Teng et al. (2014, 2015) and Oda et al. (2017). Four of the referred ULIRGs show Compton-thin obscuration, i.e., IRAS F05189–2524 (hereafter F05189), Mrk 231999We employ the intrinsic from MYTorus model fitting in Teng et al. (2014)., Mrk 273, and Superantennae101010Since the reported of SA in Teng et al. (2015) was estimated without intrinsic obscuration, we replace with the result of Brightman & Nandra (2011) for SA. (IRAS F19254–7245, hereafter SA); the rest two ULIRGs host a Compton-thick level absorber, i.e., IRAS F13120–5453 (hereafter F13120) and UGC 5101111111We employ the intrinsic from “Model II” fitting in Oda et al. (2017).. The corrected of the referred ULIRGs are collected from Veilleux et al. (1999, F05189 and Mrk 273), Buchanan et al. (2006, SA), Moustakas & Kennicutt (2006, UGC 5101), and Singh et al. (2011, Mrk 231)121212Since the Balmer decrement is not available, the of Mrk 231 is not corrected and shown as lower-limit in Figure 2.. The [Oiii] detection is not available for F13120 and we employ the converted from with the typical ratio of Seyfert 2 galaxies131313 Note that the converted of F13120 could be underestimated, since the average ratio of the four ULIRGs (F05189, Mrk 273, SA, UGC 5101), 1.0 dex, seems higher than the ratio of Seyfert galaxies (0.59 dex, LaMassa et al., 2010). (LaMassa et al., 2010). The contribution to from star formation in the ULIRGs is estimated using the empirical relation of starbursts (Gürkan et al., 2015), which is only 0.5%–2% of the total and thus, we ignore the star formation contamination and consider that the fully accounts for AGN activity.
In order to compare J0916a and other ULIRGs to normal AGNs, we also include the catalog of the Swift-BAT AGN Spectroscopic Survey (BASS DR1, Koss et al., 2017). In total, 243 AGNs are selected with S / N 3 for H, H, and [Oiii] emission lines, which consists of 135 Seyfert 1 galaxies (including Seyfert 1.2 to 1.9) and 108 Seyfert 2 galaxies. The corrected and , which are converted from the Swift 14–195 keV luminosity and empirical ratio of Ricci et al. (2017), are shown in the left panel of Figure 2 with 68% () and 95% () distribution contours.
The ratio, , can be considered as an indicator of the current X-ray faintness in the nuclear region relative to the past AGN activity. All of the ULIRGs (except for F13120) in Figure 2 (left panel) show lower compared to the normal AGNs. If we adopt a modified faintness ratio, = , where is the 2–10 keV luminosity converted from using the empirical relation of normal AGNs (Ueda et al., 2015), then the referred ULIRGs (except for F13120) possess an average of 10%, implying a general trend of X-ray deficit in the ULIRGs. J0916a shows 3.6% assuming = cm-2, which is even lower than the lowest 5.2% of SA in the referred ULIRGs. The of J0916a can be much lower () if we consider Compton-thin obscuration ( = cm-2). The extremely low of J0916a suggests a most extreme case of X-ray declining among the ULIRGs, which is possibly related to a strong nuclear wind implied by its highest ionized outflow in the galaxy scale (see Section 3.3 for a detailed discussion).
3.2 Fading AGN central engine indicated by both faint corona and torus radiation
The MIR emission from the dusty torus can be used as an intermediate indicator of AGN activity with its spatial scale ( 10 pc) between X-ray emitting corona ( 0.1 pc, Dai et al., 2010) and NLR (1–10 kpc), and it traces AGN activity in the last several 10 years (e.g., Ichikawa & Tazaki, 2017). In order to make a fair comparison to J0916a, we collect the optical-IR photometries from the Sloan Digital Sky Survey (SDSS), the Two Micron All Sky Survey (2MASS), the Wide-field Infrared Survey Explorer (WISE), the Spitzer Space Telescope, the Infrared Astronomical Satellite (IRAS), and AKARI for the six referred ULIRGs, and then perform SED fitting with CIGALE (Boquien et al., 2019) following the configuration of Chen et al. (2019). The of the referred ULIRGs are integrated with the best-fit AGN SEDs including the torus thermal and scattering radiation as well as the transmitted primary emission. The of the BASS AGN sample are adopted from Ichikawa et al. (2019b).
The right panel of Figure 2 shows the values of two ratios, i.e., / and /. A low / relative to normal AGNs suggests AGN fading in the core region (0.1 pc compared to 10 pc), while a low / denotes AGN fading in the circumnuclear region (10 pc compared to several kpc). With this diagram the ULIRGs can be separated into three groups: 1) F13120 shows the properties similar to normal AGNs; 2) SA and Mrk 231 possess decayed coronae but their tori are still luminous; 3) the other four ULIRGs including J0916a show both faint corona and torus radiation. However, the fading ratios of F05189, Mrk 273, and UGC 5101 are moderate and within the 95% () distribution range of the BASS AGN sample. J0916a locates at a unique position out of the 95% range of the BASS sample, which indicates that both of its core (corona) and circumnuclear (torus) AGN emission are drastic declining.
3.3 Powerful outflow with fading central engine: the cumulative effect of AGN feedback can be limited
A possible scenario to explain both of the faintness in corona (X-ray) and torus (MIR) in J0916a is that the primary radiation from the AGN accretion disk is currently in a fading status. Suggested by the connection between the multi-phase outflows observed in nearby ULIRGs such as Mrk 231 (Feruglio et al., 2015) and F05189 (Smith et al., 2019), the powerful galaxy-scale ionized outflow in J0916a could imply an ultrafast nuclear wind when the [Oiii] outflow was launched with a super-Eddington accretion. The Eddington ratio () is estimated to be 5.7, with the bolometric luminosity converted from and the mass of SMBH ( ) estimated using the stellar mass of the host galaxy141414To be compared, the estimated from and are 1.4 and , respectively.. The nuclear wind could blow out the surrounding gas and dust, weaken the development of corona and torus, and suppress the fueling to the SMBH.
With the extent of the [Oiii] outflow (4 kpc) and the maximum outflow velocity ( 2000 km s-1), the fading process could happen in an outflow-traveling timescale of 2 Myr, or a light-traveling timescale of years. Namely, the fading timescales are much shorter than the duration of starburst in ULIRGs, i.e., 100 Myr (e.g., Hopkins et al., 2008), implying that although the AGN can drive an powerful, fast wind in the galaxy, e.g., the outflow velocity of J0916a even exceeds the escape velocity of the host halo (Chen et al., 2020), it can be decayed in a relatively short period, and the cumulative effect of AGN feedback on the stellar build-up in the galaxy can be limited as indicated by the high star formation rate of 1000 yr-1.
3.4 Other possibilities and future work
In the above discussion a Compton-thick level absorber, = cm-2, is assumed, which accounts for the heavy obscuration in ULIRGs (e.g., Teng et al., 2015). However, it is hard to rule out the possibility of a very Compton-thick absorber, e.g., cm-2, locating on the line of sight and shielding the X-ray emitting corona. Significant constraint on the nuclear gas column density in J0916a is over the capability of the current X-ray instruments due to its faintness at a relatively high redshift. Sub-millimeter (submm) observations of dust emission with a high spatial resolution, e.g., ALMA, provide an alternative method to study such heavily obscured environment in galaxies (e.g., Scoville et al., 2015). Note that although a very Compton-thick absorber may explain the observed X-ray faintness in J0916a, we still need other scenarios for the explanation on the MIR faintness of the torus.
Recent studies showed that the weakness of X-ray emission is associated to high (e.g., Toba et al., 2019) and fast disk winds (e.g., Zappacosta et al., 2020), in which the X-ray deficit does not suggest the fading of the primary accretion disk radiation, but could be explained with the weakening of corona when the disk inner-edge moves inwards, or the cooling of corona due to the dense, so-called “failed wind”. Within those scenarios, the high = 5.7 of J0916a from its extended [Oiii] emission could reflect not only the past, but also the current AGN activity, i.e., the AGN is still active. However, the expected in this active scenario could be over three times brighter than the observed value, considering that the covering factor of torus keeps nearly constant with 0.03 (Ricci et al., 2017). With the observed low /, we tend to adopt the fading scenario as discussed in Section 3.3, although it is difficult to rule out the active scenario due to the uncertainty in the estimation of NLR radiation. In this work the [Oiii] 5007 line is used as the indicator of AGN NLR radiation. Compared to the IR [Oiv] 25.9 µm emission line, [Oiii] emission is more likely contaminated by the ionized gas surrounding young O / B type stars, and is more sensitive to the dust extinction. We estimate the amount of star formation contamination in the total , which is only 0.6% and can be ignored. However, the uncertainty in the extinction estimation due to the weakness of H line can results in a variation of 0.5 dex in the corrected . High quality optical spectrum is required to reduce the uncertainty of extinction correction, which will be achieved with the awarded Gemini/GMOS IFU follow-up for J0916a. The IFU observation can also help us to better constrain the extent the size of the outflowing region.
In addition to the fading AGN scenario where the central AGN activity indicated by X-ray and MIR radiation is finally quenched, there is another possibility that the AGN in J0916a may brighten up again as shown in the “changing-look AGNs” (CLAGNs), which have strong variability by an order of magnitude and can rebrighten when their accretion states change from faint phase to bright phase in a timescale of 1–10 years (e.g., Ricci et al., 2020). If J0916a has a CLAGN and its X-ray emitting corona would recover of erg s-1 as expected from the corrected , then the AGN can be significantly detected by NuSTAR, e.g., S / N 7 in 3–20 keV with an exposure of 100 ksec in a Compton-thick case ( cm-2). Therefore the future NuSTAR follow-up in a few years is necessary to test the CLAGN scenario. The submm observation with a high spatial resolution, e.g., ALMA, can be also helpful to constrain the CLAGN scenario. Considering the spectral coverage of ALMA at = 0.49, CO J=4-3 line can be employed as a tracer of molecular gas in J0916a. The spatial resolution of ALMA can reach 0.01″ (80 pc) at Band 7 with the maximum baselines of 16.2 km, which provides the capability to determine the molecular gas reservoir in the circumnuclear region (100–200 pc) of the AGN. If the ALMA observation reveals that the cold molecular gas has been cleaned up in the circumnuclear region, the possibility of AGN rebrightening could be reduced without fueling to the SMBH.
References
- Boquien et al. (2019) Boquien, M., Burgarella, D., Roehlly, Y., et al. 2019, A&A, 622, A103, doi: 10.1051/0004-6361/201834156
- Brightman & Nandra (2011) Brightman, M., & Nandra, K. 2011, MNRAS, 413, 1206, doi: 10.1111/j.1365-2966.2011.18207.x
- Buchanan et al. (2006) Buchanan, C. L., McGregor, P. J., Bicknell, G. V., & Dopita, M. A. 2006, AJ, 132, 27, doi: 10.1086/504409
- Chen et al. (2019) Chen, X., Akiyama, M., Noda, H., et al. 2019, PASJ, 71, 29, doi: 10.1093/pasj/psz002
- Chen et al. (2020) Chen, X., Akiyama, M., Ichikawa, K., et al. 2020, ApJ, 900, 51, doi: 10.3847/1538-4357/aba599
- Cooke et al. (2020) Cooke, K. C., Kirkpatrick, A., Estrada, M., et al. 2020, arXiv e-prints, arXiv:2009.08465. https://arxiv.org/abs/2009.08465
- Dai et al. (2010) Dai, X., Kochanek, C. S., Chartas, G., et al. 2010, ApJ, 709, 278, doi: 10.1088/0004-637X/709/1/278
- Feruglio et al. (2015) Feruglio, C., Fiore, F., Carniani, S., et al. 2015, A&A, 583, A99, doi: 10.1051/0004-6361/201526020
- García-Marín et al. (2009) García-Marín, M., Colina, L., & Arribas, S. 2009, A&A, 505, 1017, doi: 10.1051/0004-6361/200912537
- Gürkan et al. (2015) Gürkan, G., Hardcastle, M. J., Jarvis, M. J., et al. 2015, MNRAS, 452, 3776, doi: 10.1093/mnras/stv1502
- Harrison (2017) Harrison, C. M. 2017, Nature Astronomy, 1, 0165, doi: 10.1038/s41550-017-0165
- Harrison et al. (2012) Harrison, C. M., Alexander, D. M., Swinbank, A. M., et al. 2012, MNRAS, 426, 1073, doi: 10.1111/j.1365-2966.2012.21723.x
- Harrison et al. (2013) Harrison, F. A., Craig, W. W., Christensen, F. E., et al. 2013, ApJ, 770, 103, doi: 10.1088/0004-637X/770/2/103
- Hopkins et al. (2008) Hopkins, P. F., Hernquist, L., Cox, T. J., & Kereš, D. 2008, ApJS, 175, 356, doi: 10.1086/524362
- Ichikawa & Tazaki (2017) Ichikawa, K., & Tazaki, R. 2017, ApJ, 844, 21, doi: 10.3847/1538-4357/aa7891
- Ichikawa et al. (2019a) Ichikawa, K., Ueda, J., Bae, H.-J., et al. 2019a, ApJ, 870, 65, doi: 10.3847/1538-4357/aaf233
- Ichikawa et al. (2019b) Ichikawa, K., Ricci, C., Ueda, Y., et al. 2019b, ApJ, 870, 31, doi: 10.3847/1538-4357/aaef8f
- Ichikawa et al. (2019c) Ichikawa, K., Kawamuro, T., Shidatsu, M., et al. 2019c, ApJ, 883, L13, doi: 10.3847/2041-8213/ab3ebf
- Ikeda et al. (2009) Ikeda, S., Awaki, H., & Terashima, Y. 2009, ApJ, 692, 608, doi: 10.1088/0004-637X/692/1/608
- Iwasawa et al. (2018) Iwasawa, K., U, V., Mazzarella, J. M., et al. 2018, A&A, 611, A71, doi: 10.1051/0004-6361/201731662
- Iwasawa et al. (2017) Iwasawa, K., Spoon, H. W. W., Comastri, A., et al. 2017, A&A, 606, A117, doi: 10.1051/0004-6361/201730950
- Kawamuro et al. (2017) Kawamuro, T., Schirmer, M., Turner, J. E. H., Davies, R. L., & Ichikawa, K. 2017, ApJ, 848, 42, doi: 10.3847/1538-4357/aa8e46
- Koss et al. (2017) Koss, M., Trakhtenbrot, B., Ricci, C., et al. 2017, ApJ, 850, 74, doi: 10.3847/1538-4357/aa8ec9
- LaMassa et al. (2010) LaMassa, S. M., Heckman, T. M., Ptak, A., et al. 2010, ApJ, 720, 786, doi: 10.1088/0004-637X/720/1/786
- LaMassa et al. (2015) LaMassa, S. M., Cales, S., Moran, E. C., et al. 2015, ApJ, 800, 144, doi: 10.1088/0004-637X/800/2/144
- Lehmer et al. (2010) Lehmer, B. D., Alexander, D. M., Bauer, F. E., et al. 2010, ApJ, 724, 559, doi: 10.1088/0004-637X/724/1/559
- MacLeod et al. (2016) MacLeod, C. L., Ross, N. P., Lawrence, A., et al. 2016, MNRAS, 457, 389, doi: 10.1093/mnras/stv2997
- Moustakas & Kennicutt (2006) Moustakas, J., & Kennicutt, Robert C., J. 2006, ApJS, 164, 81, doi: 10.1086/500971
- Noda & Done (2018) Noda, H., & Done, C. 2018, MNRAS, 480, 3898, doi: 10.1093/mnras/sty2032
- Oda et al. (2017) Oda, S., Tanimoto, A., Ueda, Y., et al. 2017, ApJ, 835, 179, doi: 10.3847/1538-4357/835/2/179
- Ricci et al. (2015) Ricci, C., Ueda, Y., Koss, M. J., et al. 2015, ApJ, 815, L13, doi: 10.1088/2041-8205/815/1/L13
- Ricci et al. (2017) Ricci, C., Trakhtenbrot, B., Koss, M. J., et al. 2017, Nature, 549, 488, doi: 10.1038/nature23906
- Ricci et al. (2020) Ricci, C., Kara, E., Loewenstein, M., et al. 2020, ApJ, 898, L1, doi: 10.3847/2041-8213/ab91a1
- Ruan et al. (2019) Ruan, J. J., Anderson, S. F., Eracleous, M., et al. 2019, ApJ, 883, 76, doi: 10.3847/1538-4357/ab3c1a
- Sanders & Mirabel (1996) Sanders, D. B., & Mirabel, I. F. 1996, ARA&A, 34, 749, doi: 10.1146/annurev.astro.34.1.749
- Schawinski et al. (2010) Schawinski, K., Evans, D. A., Virani, S., et al. 2010, ApJ, 724, L30, doi: 10.1088/2041-8205/724/1/L30
- Scoville et al. (2015) Scoville, N., Sheth, K., Walter, F., et al. 2015, ApJ, 800, 70, doi: 10.1088/0004-637X/800/1/70
- Singh et al. (2011) Singh, V., Shastri, P., & Risaliti, G. 2011, A&A, 533, A128, doi: 10.1051/0004-6361/201117422
- Smith et al. (2019) Smith, R. N., Tombesi, F., Veilleux, S., Lohfink, A. M., & Luminari, A. 2019, ApJ, 887, 69, doi: 10.3847/1538-4357/ab4ef8
- Stalevski et al. (2016) Stalevski, M., Ricci, C., Ueda, Y., et al. 2016, MNRAS, 458, 2288, doi: 10.1093/mnras/stw444
- Teng et al. (2014) Teng, S. H., Brandt, W. N., Harrison, F. A., et al. 2014, ApJ, 785, 19, doi: 10.1088/0004-637X/785/1/19
- Teng et al. (2015) Teng, S. H., Rigby, J. R., Stern, D., et al. 2015, ApJ, 814, 56, doi: 10.1088/0004-637X/814/1/56
- Toba et al. (2019) Toba, Y., Ueda, Y., Matsuoka, K., et al. 2019, MNRAS, 484, 196, doi: 10.1093/mnras/sty3523
- Toba et al. (2020) Toba, Y., Yamada, S., Ueda, Y., et al. 2020, ApJ, 888, 8, doi: 10.3847/1538-4357/ab5718
- Tombesi et al. (2017) Tombesi, F., Veilleux, S., Meléndez, M., et al. 2017, ApJ, 850, 151, doi: 10.3847/1538-4357/aa9579
- Ueda et al. (2015) Ueda, Y., Hashimoto, Y., Ichikawa, K., et al. 2015, ApJ, 815, 1, doi: 10.1088/0004-637X/815/1/1
- Veilleux et al. (1999) Veilleux, S., Kim, D. C., & Sanders, D. B. 1999, ApJ, 522, 113, doi: 10.1086/307634
- Xu et al. (2017) Xu, Y., Baloković, M., Walton, D. J., et al. 2017, ApJ, 837, 21, doi: 10.3847/1538-4357/aa5df4
- Zakamska et al. (2016) Zakamska, N. L., Hamann, F., Pâris, I., et al. 2016, MNRAS, 459, 3144, doi: 10.1093/mnras/stw718
- Zappacosta et al. (2020) Zappacosta, L., Piconcelli, E., Giustini, M., et al. 2020, A&A, 635, L5, doi: 10.1051/0004-6361/201937292