Tackling the phase problem of diffraction for retrieval of photonic structures formed in nanocomposite materials
Abstract
We experimentally demonstrate how to solve the phase problem of diffraction using multi-wave interference with standard diffraction experimental setups without the need for taking any auxiliary data. In particular, we show that the phases of the Fourier components of a periodic structure can be fully recovered by deliberately choosing a probe wavelength of the diffracting radiation much smaller than the lattice constant. In the course of the demonstration, we accurately determine the refractive index profile of nanocomposite phase gratings by light and neutron diffraction measurements.
Diffraction experiments are usually a method of choice to determine the internal structure of bulk materials. Instead of a crystal, let us consider here the simple case of a planar one-dimensional phase grating, which is characterized by the spatial profile of the refractive index
| (1) |
Here, is the spatial frequency, the amplitude and the relative phase of the Fourier component at the index . In the case of phase gratings () the Fourier-series of the real-valued refractive index reads . By determining the Fourier components, i.e. amplitudes and phases of the Fourier components, the structure is fully retrieved. However, by measuring the intensities of diffracted signals – as it is usually done in standard diffraction experiments – only the magnitude of the -th Fourier component that corresponds to the -th diffraction order, can be obtained, whereas the phases are lost. The latter is called the phase problem of crystallography or diffraction (see, for instance, Hauptman (1991)). In principle, the phase problem can be overcome by measuring the phase differences between the wave incident to a sample of interest and each diffracted wave interferometrically, which, however, is found to be utterly difficult in many relevant cases.
Sophisticated techniques have been developed to solve the phase problem and recover the phase information Hauptman (1991); Woolfson and Fan (1995) either by so-called non-physical methods (direct methods, isomorphous replacement and anomalous scattering) or by introducing – sometimes demanding – experimental procedures to provide a physical solution Chapman et al. (1981); Chang (1982); Shen (1998); Wolf (2009). Discussions on available techniques and their development are ongoing (see, for instance, Kleywegt (2000); Cowtan (2003); Millane (2017); Fally et al. (2019); Donatelli and Spence (2020); Heacock et al. (2020)). Surprisingly, sticking to traditional diffraction experiments alone can indeed provide all necessary information in many cases if experimental settings are chosen carefully, as we will show here. In particular, we demonstrate by means of simple examples – one-dimensional, non-sinusoidal phase gratings – how such a physical solution to the phase problem of diffraction can be obtained with not more than the usual experimental effort in light and neutron diffraction experiments. The technique is applicable to samples generating diffraction patterns for any type of radiation useful for structure determination (X-rays, electrons, laser light, and neutrons, for instance). We apply our approach to the problem of determining deviations of the periodic refractive index profiles of holographic nanoparticle-polymer composite (NPC) gratings Tomita et al. (2016) from their ideal sinusoidal form. The information obtained is useful for our understanding of holographic formation processes Tomita et al. (2005a); Chikama et al. (2008) and development of versatile holographic applications such as diffractive optical elements, holographic data storage and display technology Ohe et al. (1999); Coufal et al. (2000); Crawford (2003); An et al. (2006).
Holographic gratings were prepared from a photopolymerizable NPC material. As reported in the past Suzuki and Tomita (2004), \ceSiO2 nanoparticles (with the average diameter of 13 nm and the bulk refractive index of 1.46) dispersed in a solution of methyl isobutyl ketone are mixed with methacrylate monomers, 2-methyl-acrylic acid 2-4-[2-(2-methyl-acryloyloxy)-ethylsulfanylmethyl]-benzylsulfanyl-ethyl ester (the formed polymer refractive index is 1.59 at 589 nm). The doping concentration of \ceSiO2 nanoparticles was 34 vol.%. Photoinitiator titanocene (Irgacure 784, Ciba) is also mixed in 1 wt.% with respect to the monomer to provide photosensitivity in the green. The above chemical mixture is cast on a glass plate. It is dried in an oven and finally covered with another glass plate, separated from the first one by spacers of known thickness. We employ a two-beam interference setup to write an unslanted transmission NPC grating by superposition of two mutually coherent s-polarized beams of equal light intensities from a laser diode-pumped frequency-doubled Nd:\ceYVO4 laser operating at 532 nm. Two NPC gratings were prepared: G1 at grating spacing of m (with , see Eq. 1) and with the thickness of about m, and G2 at spacing of m and with m. In the bright regions of the interference pattern irradiating the sample, the photoinitiator triggers photopolymerization. Monomer is consumed there by the formation of polymer. Due to the resulting chemical potential gradient, a mutual diffusion process of unreacted monomer and nanoparticles sets in, leaving the dark regions enriched with nanoparticles Tomita et al. (2016). It is important to note that, while the interference pattern is sinusoidal, the phase grating will be non-sinusoidal with nonzero higher Fourier components ( in Eq. 1) due to the interplay of nonlinear processes governed by the photopolymerization-driven mutual diffusion process for the formation of spatial density modulations of the formed polymer and nanoparticles. (Such characteristic features of the nanoparticle density profile can also be assessed by various theoretical models Karpov et al. (2000); Tomita et al. (2005a).) Thus, however elaborate the described production process might be, it is subject to continuing optimization and fine-tuning of experimental parameters (such as chemical compositions, nanoparticle concentration, and recording intensity and time) for the particular application one has in mind for the produced grating. Therefore, information as accurate as possible about the process outcome is desired, i.e. information about the redistribution of the nanoparticles dispersed in monomer under holographic exposure, which would eventually determine the exact form of the periodic refractive index profile given by Eq. 1. It is the latter we investigate by our proposed method here.
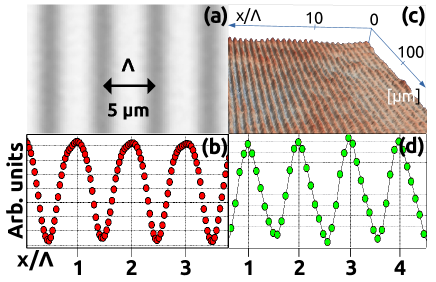
Figure 1 (a) shows an optical micrograph of G1 taken close to the maximum contrast position of the Talbot carpet Goodman (2017); Zhou and Burge (2010); Wen et al. (2013), which can be observed for pure phase gratings using an optical microscope. It can be seen that \ceSiO2 nanoparticles (narrow, dark fringes, corresponding to lower refractive index regions) and the formed polymer (wide, bright fringes, corresponding to higher refractive index regions) are periodically arranged as a result of holographic assembly of nanoparticles Tomita et al. (2005b). Their distribution, shown in Fig. 1 (b), is not perfectly sinusoidal. In Fig. 1 (c), a section of a phase map of a sibling of G1 (also at m) measured by digital holographic microscopy (DHM-R2100 by Lyncée Tec) is shown. The measurements were made with a 20X objective at a wavelength of nm. Also in this case, it is clearly seen from the sum of about 100 lines taken along the grooves of the phase map that the pattern is not purely sinusoidal, as shown in Fig. 1 (d). Thus, the Fourier series describing both distribution patterns and, therefore, the refractive-index profiles must certainly include higher order Fourier terms, at .
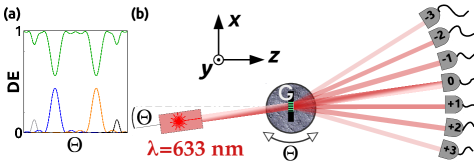
In many diffraction experiments aiming at structure determination, diffraction by a sample occurs in Bragg regime Moharam et al. (1980): At most two waves propagate and interfere simultaneously within the sample at all angles of incidence. One typically measures the dependence of the diffracted intensities upon the sample’s rotation through angles of incidence on a screen or a detector. In Bragg regime, peaks of the diffraction efficiency (DE, ) plotted versus are relatively sharp and do not overlap as can be seen in Fig. 2 (a). Interference of the two waves propagating within the sample’s periodic structure (the refractive index modulation given by Eq. 1) results in energy exchange between diffraction order pairs (the zero order beam and only one of the orders) as a function of . The first Born approximation does not hold in such a case, but theories such as dynamical diffraction theory or Kogelnik’s theory (see, for instance, Batterman and Cole (1964); Kogelnik (1969)) can be deployed for modelling data taken in Bragg regime. However, the relative phases of Fourier components cannot be retrieved since multi-wave interference of the corresponding waves does not occur at any . Now, in order to achieve such multi-wave interference (also referred to as multi-wave coupling) in diffraction and, thereby, to determine the relative phases of G1’s structure, we apply visible light of wavelength as a probe in our diffraction experiment, such that is about an order of magnitude longer than the wavelength of the probe beam. By intentionally choosing much shorter than it would seem appropriate, we can leave the Bragg regime behind and allow for multi-wave interference to occur within the periodic structure of the sample. From the Bragg equation ( is the Bragg angle for the Fourier component at the index ) it is clear that the diffraction angle decreases with a decrease in , so that diffraction peaks of a given width overlap and the experiment can no longer be described in the Bragg regime. Clearly, more than just two waves propagate and interfere inside the sample at angles for which observed peaks overlap considerably [see Fig. 2 (b)].
The angular dependence data obtained by multi-wave interference diffraction can only be modelled by multiwave analysis theories such as the rigorous coupled-wave analysis (RCWA) Moharam et al. (1995). Here, the strategy is to solve Maxwell’s equations in each of three regions (input, grating, output) such that the tangential components of the solutions of neighbouring regions match at these interfaces. Phase information of the Fourier components of the refractive index profile given by Eq. 1 is inherently included in the RCWA. A set of coupled-wave equations is solved by calculating eigenvalues and eigenvectors of a matrix directly related to those Fourier components. The amplitudes at arbitrary diffraction orders are found by employing the boundary conditions. In our work RCWA was used to fit the experimental DE defined as , with the diffracted intensity at the diffraction order and the sum of all diffracted intensities behind the sample , and yield the amplitudes and phases of the corresponding Fourier components at the index required to fully reconstruct .
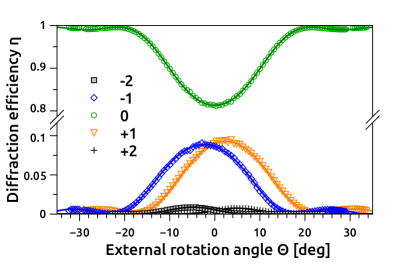
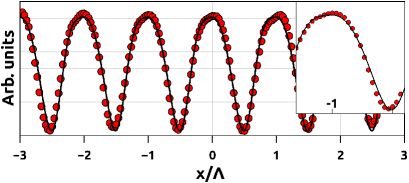
To measure the angular dependence data, an s-polarized beam of a He-Ne laser ( nm) was used to observe diffraction signals from G1 being rotated about the -axis (perpendicular to the plane of incidence) at angles (), as is shown in Fig. 2 (b). Angular dependences of the diffracted intensities at were recorded by Si-photodiodes placed at the locations of the diffraction spots observed on a screen. The results are shown in Fig. 3. Due to the small ratio in our experiment, the Bragg angles at , respectively, are small, too. All seven observable diffraction orders overlapped within and exhibited sufficiently large DE to be readily detected. Solid curves in Fig. 3 are least-squares fits to the RCWA. Fitting was performed including all data points. The RCWA is in excellent agreement with the experimental data, by which we can achieve accurate structure determination as is shown below: Estimations for the amplitudes and of the Fourier components as well as their phases and as obtained by the RCWA fit are given in the second column of Table 1. The values of and were – without loss of generality – obtained with respect to set to zero. The spatial refractive index profile as calculated from fit parameter estimations is shown in Fig. 4 (solid, black curve). Since the refractive index modulation amplitude of a recorded NPC grating is proportional to Suzuki et al. (2002), the \ceSiO2 rich regions correspond to the low refractive index regions. Comparison with the data of Fig. 1 (b) (filled, red circles in Fig. 4) makes the qualitative agreement obvious, thereby demonstrating the validity of our approach. Even the slight asymmetry in the profile (slight flattening on the left side of each peak), which may be caused by spatially nonuniform lateral shrinkage during holographic exposure, is captured by the RCWA analysis of the diffraction data as can be seen from the inset in Fig. 4.
| grating | G1 (light, nm) | G2 (neutrons, nm) |
|---|---|---|
| n. a. | ||
| n. a. |
Next, the refractive index profile of G2 (, m) is to be retrieved. Accurately resolving such structures by an optical microscope is possible but not straightforward, which underlines the potential impact of our solution to the phase problem, especially for refractive-index profiles, which have structural dimensions of the order of light wavelengths. In the case of G2, Kogelnik’s theory Kogelnik (1969) allows to roughly estimate the expected peak width (the angular distance between the minima adjacent to the Bragg angle at in an angular dependence plot of DE) as while one obtains at nm and at a UV wavelength of nm, say. Thus, it is difficult to produce peak overlap to transfer the diffraction process from the Bragg regime to the multi-wave interference regime for the determination of the refractive index profile of G2, by use of table-top laser light sources. However, a key point of our approach is that depending on the particular material class investigated, there might be other kinds of radiation available for diffraction experiments to obtain data similar to the ones shown in Fig. 3. For instance, since the refractive index profile is produced by the density modulation of one of the involved material components (nanoparticles, in our case), it is known that small angle neutron scattering (SANS; see, for instance, Willis and Carlile (2009)) provide well-established tools Fally et al. (2010): For a typical de Broglie wavelength of neutrons in a SANS experiment of 1 nm, say, one may expect Bragg angles of the order of , which can be detected with state-of-the-art SANS instruments, thanks to long sample-detector distances (up to 20 m) and sufficient spatial resolution of detectors. Thus, considerable peak-overlap for G2 and, therefore, multi-wave interference is achievable with neutrons.
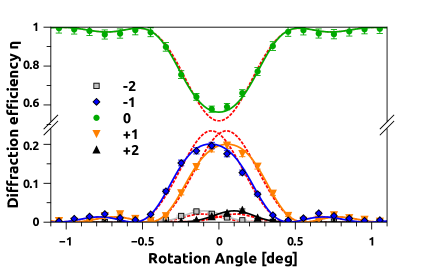
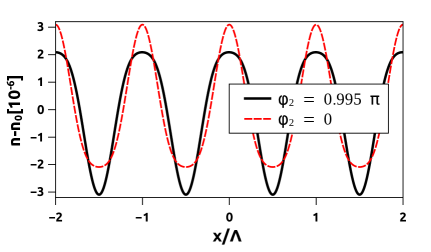
The neutron experiment was performed by use of the instrument SANS-I of the SINQ neutron source of Paul-Scherrer Institute in Villigen, Switzerland. Cold neutrons at a mean wavelength of nm (width of wavelength distribution ) were diffracted from G2. The beam divergence was limited to about 1 mrad, using collimation slits. The diffracted intensities were measured using a two-dimensional detector of mm2 pixel size. To adjust the peak width (estimated by , see our above discussion) and the peak height for our purpose, G2 was tilted around its grating vector by which increases the effective thickness to , i. e. by a factor of two Somenkov et al. (1978); Fally et al. (2010). The results are shown in Fig. 5. Similarly to the DE of G1 shown in Fig. 3, the observed diffraction took place in the multiple-wave interference regime, that is, many (five, in this case) diffraction orders are observable within the angular range of . Applying the RCWA fit, we were, again, able to extract the full information (amplitudes and phases) of the grating’s Fourier components up to the 2nd-order. They are given in Table 1 (third column). Simulations of the DE assuming instead of the experimentally obtained value are also plotted (red, dashed curves) in Fig. 5. The disagreement of simulation at and data is easily resolved in a standard SANS experiment. The neutron-refractive index profile of G2 – corresponding to the spatial density distribution of formed polymer and nanoparticles – as calculated from the RCWA parameter estimation is shown in Fig. 6 together with its counterpart, assuming , for comparison. Note that the refractive index modulation amplitude for neutrons is proportional to , where () and () are the mean bound coherent scattering length Willis and Carlile (2009) and the atomic density of nanoparticles (the formed polymer), respectively. Since is larger than for \ceSiO2 nanoparticles Fally et al. (2010), the \ceSiO2 rich regions correspond to lower refractive index regions in Fig. 6, as similar to Fig. 4. No third order component was measurable for G2 and therefore the profile in Fig. 6 is symmetric, in contrast to the profile of G1. We attribute this difference to the mutual diffusion process, which is much more significant in G2 due to the smaller grating spacing.
Of course, it is – in many cases – more convenient to apply optical microscopy for the estimation of the refractive-index profile, but resolution limits of this method are laborious to overcome in the range of typical structure constants of several hundred nanometers. Furthermore, electron microscopy and physico-chemical analyses often depend on sample preparation techniques – producing thin slices or breaking samples to look at surfaces – that are cumbersome or even unreliable in the sense that they could, in the worst case, mechanically alter the structure to be investigated. Our technique, however, can provide sufficient resolution in bulk so long as a suitable state-of-the-art instrument, meeting the wavelength requirements to work in multi-wave interference regime for a structure of interest, can be accessed at one of the many facilities worldwide. Resolution is limited by the –usually excellent – detector sensitivity and background suppression necessary for reliable observation of weak higher-order diffraction signals. The RCWA analysis (programmed in the Python programming language) carried out here on an off-the-shelf PC can be applied to more complicated structures by using more powerful computation infrastructure, nowadays available at many institutions.
Finally, we note that the technique presented here is closely related to previous proposals to employ multi-wave interference (see, for instance, Chapman et al. (1981); Chang (1982); Woolfson and Fan (1995); Shen (1998)). The fundamental difference between those and our approach is, however, that apart from a careful choice of wavelengths, only standard diffraction procedures are applied here. No extra data needs to be taken. Our approach can be seen as generalization of what is discussed in the recent Ref. Heacock et al. (2020).
In summary, we have demonstrated the determination of refractive-index profiles by diffraction from one-dimensional holographic phase gratings recorded in \ceSiO2 nanoparticle-dispersed NPC films. We have shown that full phase retrieval can be made without the need for extra data collection schemes. In particular, by choosing the probe wavelength some orders of magnitude shorter than the structural dimensions being investigated, Bragg regime diffraction can be turned into diffraction in the regime of multi-wave interference for a given sample. Fitting of a multi-wave coupling model such as the well-known RCWA to the resulting angular dependence data allows for the accurate determination not only of amplitudes but also of phases of the Fourier components of generic profiles of refractive index modulation. When dealing with photonic structures (like gratings) it is a common practice to avoid multi-wave interference for ease of the analysis, in particular when it comes to the evaluation of the underlying parameters. Here, we have shown that getting rid of this habit and embracing the usually shunned multi-wave interference regime can pay off at the prize of a relatively low increase in experimental and analytical complication. Our technique is a purely physical solution to the phase problem of diffraction.
We would like to thank G. Heuberger for preliminary experimental work. J. G. and Y. T. would like to acknowledge the financial supports by Ministry of Education, Culture, Sports, Science, and Technology of Japan under grant No. 25-03052 and No. 15H03576.
References
- Hauptman (1991) H. A. Hauptman, Rep. Prog. Phys. 54, 1427 (1991).
- Woolfson and Fan (1995) M. Woolfson and H.-f. Fan, Physical and non-physical methods of solving crystal structures (Cambridge University Press, Cambridge, UK, 1995).
- Chapman et al. (1981) L. D. Chapman, D. R. Yoder, and R. Colella, Phys. Rev. Lett. 46, 1578 (1981).
- Chang (1982) S.-L. Chang, Phys. Rev. Lett. 48, 163 (1982).
- Shen (1998) Q. Shen, Phys. Rev. Lett. 80, 3268 (1998).
- Wolf (2009) E. Wolf, Phys. Rev. Lett. 103, 075501 (2009).
- Kleywegt (2000) G. J. Kleywegt, Acta Crystallogr. D 56, 249 (2000).
- Cowtan (2003) K. Cowtan, “Phase problem in x-ray crystallography, and its solution,” in eLS (American Cancer Society, 2003).
- Millane (2017) R. P. Millane, Acta Crystallogr. A 73, 140 (2017).
- Fally et al. (2019) M. Fally, J. Klepp, M. A. Ellabban, H. Eckerlebe, P. K. Pranzas, J. Guo, and Y. Tomita, Proc. SPIE 11030, 110300I (2019).
- Donatelli and Spence (2020) J. J. Donatelli and J. C. H. Spence, Phys. Rev. Lett. 125, 065502 (2020).
- Heacock et al. (2020) B. Heacock, D. Sarenac, D. G. Cory, M. G. Huber, J. P. W. MacLean, H. Miao, H. Wen, and D. A. Pushin, IUCrJ 7, 893 (2020).
- Tomita et al. (2016) Y. Tomita, E. Hata, K. Momose, S. Takayama, X. Liu, K. Chikama, J. Klepp, C. Pruner, and M. Fally, J. Mod. Opt. 63, S1 (2016).
- Tomita et al. (2005a) Y. Tomita, N. Suzuki, K. Furushima, and Y. Endoh, Proc. SPIE 5939, 593909 (2005a).
- Chikama et al. (2008) K. Chikama, K. Mastubara, S. Oyama, and Y. Tomita, J. Appl. Phys. 103, 113108 (2008).
- Ohe et al. (1999) Y. Ohe, M. Kume, Y. Demachi, T. Taguchi, and K. Ichimura, Polym. Adv. Technol. 10, 544 (1999).
- Coufal et al. (2000) H. J. Coufal, D. Psaltis, and G. T. Sincerbox, eds., in Holographic Data Storage (Springer-Verlag Berlin Heidelberg New York, 2000).
- Crawford (2003) G. P. Crawford, Opt. Photon. News 14, 54 (2003).
- An et al. (2006) J. W. An, D. D. Do, N. Kim, and K. Y. Lee, IEEE Photon. Technol. Lett. 18, 788 (2006).
- Suzuki and Tomita (2004) N. Suzuki and Y. Tomita, Appl. Opt. 43, 2125 (2004).
- Karpov et al. (2000) G. Karpov, V. Obukhovsky, T. Smirnova, and V. Lemeshko, Opt. Commun. 174, 391 (2000).
- Goodman (2017) J. W. Goodman, Introduction to Fourier Optics (W. H. Freeman and Company, New York, USA, 2017).
- Zhou and Burge (2010) P. Zhou and J. H. Burge, Appl. Opt. 49, 5351 (2010).
- Wen et al. (2013) J. Wen, Y. Zhang, and M. Xiao, Adv. Opt. Photon. 5, 83 (2013).
- Tomita et al. (2005b) Y. Tomita, N. Suzuki, and K. Chikama, Opt. Lett. 30, 839 (2005b).
- Moharam et al. (1980) M. Moharam, T. Gaylord, and R. Magnusson, Optics Communications 32, 14 (1980).
- Batterman and Cole (1964) B. W. Batterman and H. Cole, Rev. Mod. Phys. 36, 681 (1964).
- Kogelnik (1969) H. Kogelnik, Bell Syst. Tech. J. 48, 2909 (1969).
- Moharam et al. (1995) M. G. Moharam, D. A. Pommet, E. B. Grann, and T. K. Gaylord, J. Opt. Soc. Am. A 12, 1077 (1995).
- Suzuki et al. (2002) N. Suzuki, Y. Tomita, and T. Kojima, Appl. Phys. Lett. 81, 4121 (2002).
- Willis and Carlile (2009) B. T. M. Willis and C. J. Carlile, Experimental Neutron Scattering (Oxford University Press, Oxford, UK, 2009).
- Fally et al. (2010) M. Fally, J. Klepp, Y. Tomita, T. Nakamura, C. Pruner, M. A. Ellabban, R. A. Rupp, M. Bichler, I. Drevenšek-Olenik, J. Kohlbrecher, H. Eckerlebe, H. Lemmel, and H. Rauch, Phys. Rev. Lett. 105, 123904 (2010).
- Somenkov et al. (1978) V. A. Somenkov, S. S. Shilstein, N. E. Belova, and K. Utemisov, Solid State Commun. 25, 593 (1978).