Non-symmetric spin-pumping in a multiferroic heterostructure
Abstract
We present spin pumping experiments in Co/Pt bilayers grown on Al2O3(0001) and on ferroelectric Y-cut LiNbO3 substrates. Spin pumping is triggered by resonant ferromagnetic resonance induced by surface acoustic waves. We observe that spin pumping efficiency varies when both the magnetization vector and the acoustic wave vector are reversed in Pt/Co/LiNbO3. This phenomenon is not observed in Pt/Co/Al2O3. We propose that the in-plane electric polarization of LiNbO3 is at the origin of the observed phenomenon. These observations open up the perspective of an electric field control of spin pumping efficiency.
I Introduction
The first major success in spintronics research was the development of the giant magneto-resistance spin valve, demonstrating the ability to control a spin-polarized current by taking advantage of the spontaneous imbalance of spin-up and spin-down electrons in the conduction band of ferromagnetic materials Baibich et al. (1988); Binasch et al. (1989); George et al. (1994). More recently, pure spin currents, i.e. a spin flux without a corresponding charge flux, are of great interest to the scientific community since they do not give rise to an Oersted field and more importantly, they do not produce Joule heating. Pure-spin current devices are therefore a route to reducing the power consumption of spintronic devices such as, for example, in STT-MRAMMaekawa et al. (2017); Berger (1996); Makarov et al. (2013).
The development of low-power spintronic devices based on manipulation of pure spin currents requires an increase in the generation and detection efficiencies via a full understanding of the complex physics behind pure spin currents. Spin current can be detected by the inverse spin Hall effect (ISHE) which corresponds to the conversion of a spin current into a detectable charge current by measuring the voltage on a normal metal (NM) presenting a strong spin-orbit interaction (e.g. Pt). Concerning the generation of pure spin currents different techniques have been proposed in the literature. Emission can be obtained by temperature gradients through the spin Seebeck effectUchida et al. (2008, 2010); Matsuo et al. (2018), by charge currents (spin Hall effect Kimura et al. (2007)) and by magnetization dynamics (spin pumping Matsuo et al. (2018); Weiler et al. (2012); Ando et al. (2011)). This last mechanism permits the generation of a pure spin current via ferromagnetic resonance (FMR) in a ferromagnetic material (FM), leading to spin accumulation in an adjacent non magnetic material.
Generally, FMR is obtained by radio-frequency (RF) electromagnetic means or by RF currents Okada et al. (2019). Interestingly, FMR and spin pumping has also been triggered by acoustic means taking advantage of resonant magnetoelastic coupling in a Co/Pt bilayerWeiler et al. (2012). Here, mature surface acoustic wave (SAW) technology is used to drive the dynamics of magnetization of a thin Co film, in the GHz regime and by a remote, non inductive and dissipationless method. This so-called SAW-FMR is now well established Weiler et al. (2011); Thevenard et al. (2016); Duquesne et al. (2019). The precession pumps a spin current into the NM layer Adachi and Maekawa (2014). In turn, this spin current generates an electric field () in the NM layer through the ISHE: where is the spin-current density and correspond to the spin polarization vector. This electric field is converted into a measurable voltage between both ends of the Pt strip. What makes SAW assisted experiments extremely interesting is that they are free from spurious non-symmetric signal arising from the anomalous Hall effect (AHE) which affects the standard FMR technique Saitoh et al. (2006).
The main purpose of this letter is to compare the spin pumping excitation/detection efficiency when both directions of the magnetization M and acoustic wave-vector kSAW are reversed. We investigated SAW-FMR assisted spin pumping in a multiferroic system where a FM/NM (Co/Pt) bilayer is in contact with a ferroelectric (FE) LiNbO3 substrate. We put forward the hypothesis that the remanent electrical polarization vector affects the ISHE voltage.
II Samples characteristics and experimental setup
Figure 1(a) is a sketch of the samples and setup. We used two different substrates: Y-cut LiNbO3 and (0001)-cut Al2O3. Moreover, LiNbO3 is not centrosymmetric (space group is ). It is ferroelectric and therefore piezoelectric. We verified that our LiNbO3 substrate is a single-domain ferroelectric using polarized light microscopy and piezoelectric force microscopy (PFM) measurements (see appendix A, Fig. 4 and 5). No domain wall was observed from large scale (2.86 mm 2.11 mm) to low scale (1 m 1 m) that is expected in a single-domain ferroelectric material. Al2O3 is centrosymmetric (space group is ). It is neither piezoelectric nor ferroelectric. The orientations of both substrates have been verified by XRD. Both samples do not present a 2-fold rotational symmetry about the surface normal. On both substrates, a bi-layer of Co () and Pt () is deposited by electron beam evaporation at the center. SAW bursts are emitted and detected electrically by means of two nominally identical IDTs defined by electron beam lithography and placed symmetrically on either side of the central Co/Pt strip. In the case of the Pt/Co/LiNbO3 sample, IDTs are deposited directly onto the piezoelectric substrate. However, in case of the Pt/Co/Al2O3 sample, a thin ZnO piezoelectric layer of 490 nm is deposited on the surface by sputtering at 300∘C only under the IDTs areas so as to emit SAWs. ZnO is a textured polycrystal with c-axis normal to the substrate. 200ns SAW bursts, with a repetition rate of 5 kHz, are emitted at 1.5 and 1.3 GHz for LiNbO3 and Al2O3 respectively. The electrical power applied during the SAW bursts was 19 dBm (79 mW), except for power study in Fig 2. After propagation in the Co/Pt layers the SAW is detected by the opposite IDT and the acoustic signal is acquired with a digital oscilloscope. Simultaneously, the output voltage (between the both ends of the Co/Pt bi-layer) is measured with a DC-amplifier (bandwidth = 0-20 MHz, gain = 25 dB, input and output impedance = 50 ) and recorded with the same oscilloscope. To improve the signal-to-noise ratio, a sequence of 64000 signals is averaged.
On the Y-cut LiNbO3 substrate, the SAW wave-vector kSAW is along the Z-axis ( direction), i.e. the spontaneous direction of the electrical polarization vector Nassau et al. (1966a, b). On the Al2O3 substrate, kSAW is along the Y-axis ( direction). On both substrates we define parallel to kSAW, oriented from IDT1 to IDT2. We also define an in-plane axis at an angle from . We apply a magnetic field along (see Fig.1(a)).
The DC spin current is detected via the ISHE in the Pt layer by measuring the time-dependent voltage between both ends of the Co/Pt bi-layer. The output voltage is recorded synchronously with the acoustic bursts (see Fig.1(d,e)). To separate, in the time domain, the spin current signal from the electromagnetic wave (EMW) and from the acoustic (SAW) signals, the distances between each IDT and the bi-layer is carefully designed (1.25 and 2.75 mm for LiNbO3 and Al2O3, respectively). In an experimental run, we first set the orientation and we saturate the magnetic film with a large field amplitude . Then, the field either increases (from -35 to +35 mT, = -350 mT) or decreases (from +35 to -35 mT, = +350 mT). is recorded at each field value. These measurements were performed for a range of orientations and also for opposite acoustic wave-vectors kSAW. The direction of kSAW is reversed by connecting the input signal to one IDT or to the other. Since the IDTs are symmetrical with respect to the Co/Pt strip, spin pumping occurs in the same time range for both propagation directions.
For each sample measured, the Co layer was first characterised since each evaporated layer has slightly different characteristics (see appendix B). In this paper, we choose to present the results obtained for two specific samples where the coercive field is lower than the resonant field .
From broadband-FMR (BB-FMR) measurements between 3 and 8.5 GHz, we record the FMR frequency, , as a function of the in-plane magnetic field amplitude () Hamida et al. (2013). By extrapolation of our experimental values ( vs ) using the Kittel formula Kittel (1951), we found a SAW-FMR resonance condition around 4 mT and 6 mT for Pt/Co on LiNbO3 and Al2O3, respectively. Both samples are invariant by a rotation of , regarding their MOKE magnetic cycles (see appendix B and insert of Fig.6). First, we present our results. Afterward, we will analyse them in term of symmetries.
III Results and discussion
Measurements, presented here, have been performed at with = 1.1 mT for Pt/Co/LiNbO3 and with = 3 mT for Pt/Co/Al2O3. Figure 1(e) shows the spin current signal for Pt/Co/Al2O3, mT and mT. This subtraction is performed to eliminate parasitic deterministic signals. According to calculation, no SAW-FMR and no spin pumping are expected at . On the contrary, at mT, the acoustic frequency matches the precession frequency of the uniform mode (See appendix B, Fig. 8). Hence, when the acoustic bursts go through the Co/Pt bi-layer, in the time range , ([0.6-0.9] s in the case of the Pt/Co/Al2O3 sample, Fig. 1 (e)), they induce the ferromagnetic resonance of Co and a pure spin current is launched in the adjacent Pt layer, with a maximum value around . The magnitude of the spin current is proportional to the time-averaged value of , around (between 0.7 and 0.8 s for Pt/Co/Al2O3).
We assume that the spin current is maximum when the resonance is triggered. Then, we identify the resonance field at the value where the current signal is maximum (see Fig. 3). We observe the change of sign of with the reversal of , induced by the reversal of (since ), which is an expected condition for acoustic spin pumping Czeschka et al. (2011).
We also note that (proportional to the spin current) is proportional to the incident electrical power (), and then to the electrical power injected in the IDT, as shown in Fig.2 for the bilayer on the Al2O3 substrate. The same behavior is observed for the LiNbO3 sample. Indeed, this is in good agreement with experiments of K.Ando et al.Ando et al. (2011) and with the model of F.Czeschka et al.Czeschka et al. (2011), from which we can easily derive, in the small angle regime: .
At first glance (see Fig.3), the dependence on Bext shown here seems to be similar to that shown by M.Weiler et alWeiler et al. (2012). However, a difference is observed in our measurements at the coercive fields. Indeed, a significant electric current is emitted at and for decreasing and increasing field respectively, which is difficult to observe in M.Weiler et alWeiler et al. (2012). The origin of this current is not yet understood and is beyond the scope of this paper. However, since is close to the resonant field, the current superimposes on the spin current and it becomes difficult to separate the two contributions. To avoid the spurious contributions, we concentrate only on the measurements of for low coercive field samples and at angles where is weakest.
So, let us now see what is expected when the magnetic field and the acoustic wave-vector are reversed. Figures 1(b,c) displays sketches of a sample (substrate and bi-layer) subject to two configurations (b) and (c), i.e. different orientations of in-plane applied field Bext, magnetization M and acoustic wave-vector kSAW. Configuration (c) is obtained from (b) by reversing Bext, M and kSAW. A trivial behaviour is expected for systems that are invariant by a rotation of about an axis perpendicular to the propagation plane. In that case, we can notice that configuration (c) can also be obtained from (b) by combining a rotation of and an exchange of the (+) and (-) terminals. Therefore, if the sample is invariant by a rotation of , we infer that going from (b) to (c) will change the sign of the measured voltage between the (+) and (-) terminals but not its magnitude.
From an experimental point of view, reversing kSAW and Bext is quite easy. However, reversing M is a little bit more tricky because of the memory effect associated with the magnetic hysteresis. In Fig.1, if configuration (b) is reached from a positive saturating field (”decreasing field scan”), configuration (c) must be reached from a negative saturating field (”increasing field scan”), and conversely. To conclude, in order to check the symmetry rules, we should compare the voltages measured either for [kSAW, Bext, ] and [kSAW, Bext, ], or for [kSAW, Bext, ] and [kSAW, Bext, ]. From a practical point of view, the comparison can be easily carried out in the following manner. Let us consider two field scans, [kSAW, ] and [kSAW, ]. For the first scan, we plot the voltage versus the signed amplitude of the field. For the second scan, we plot the opposite voltage versus the opposite of the signed amplitude of the field.
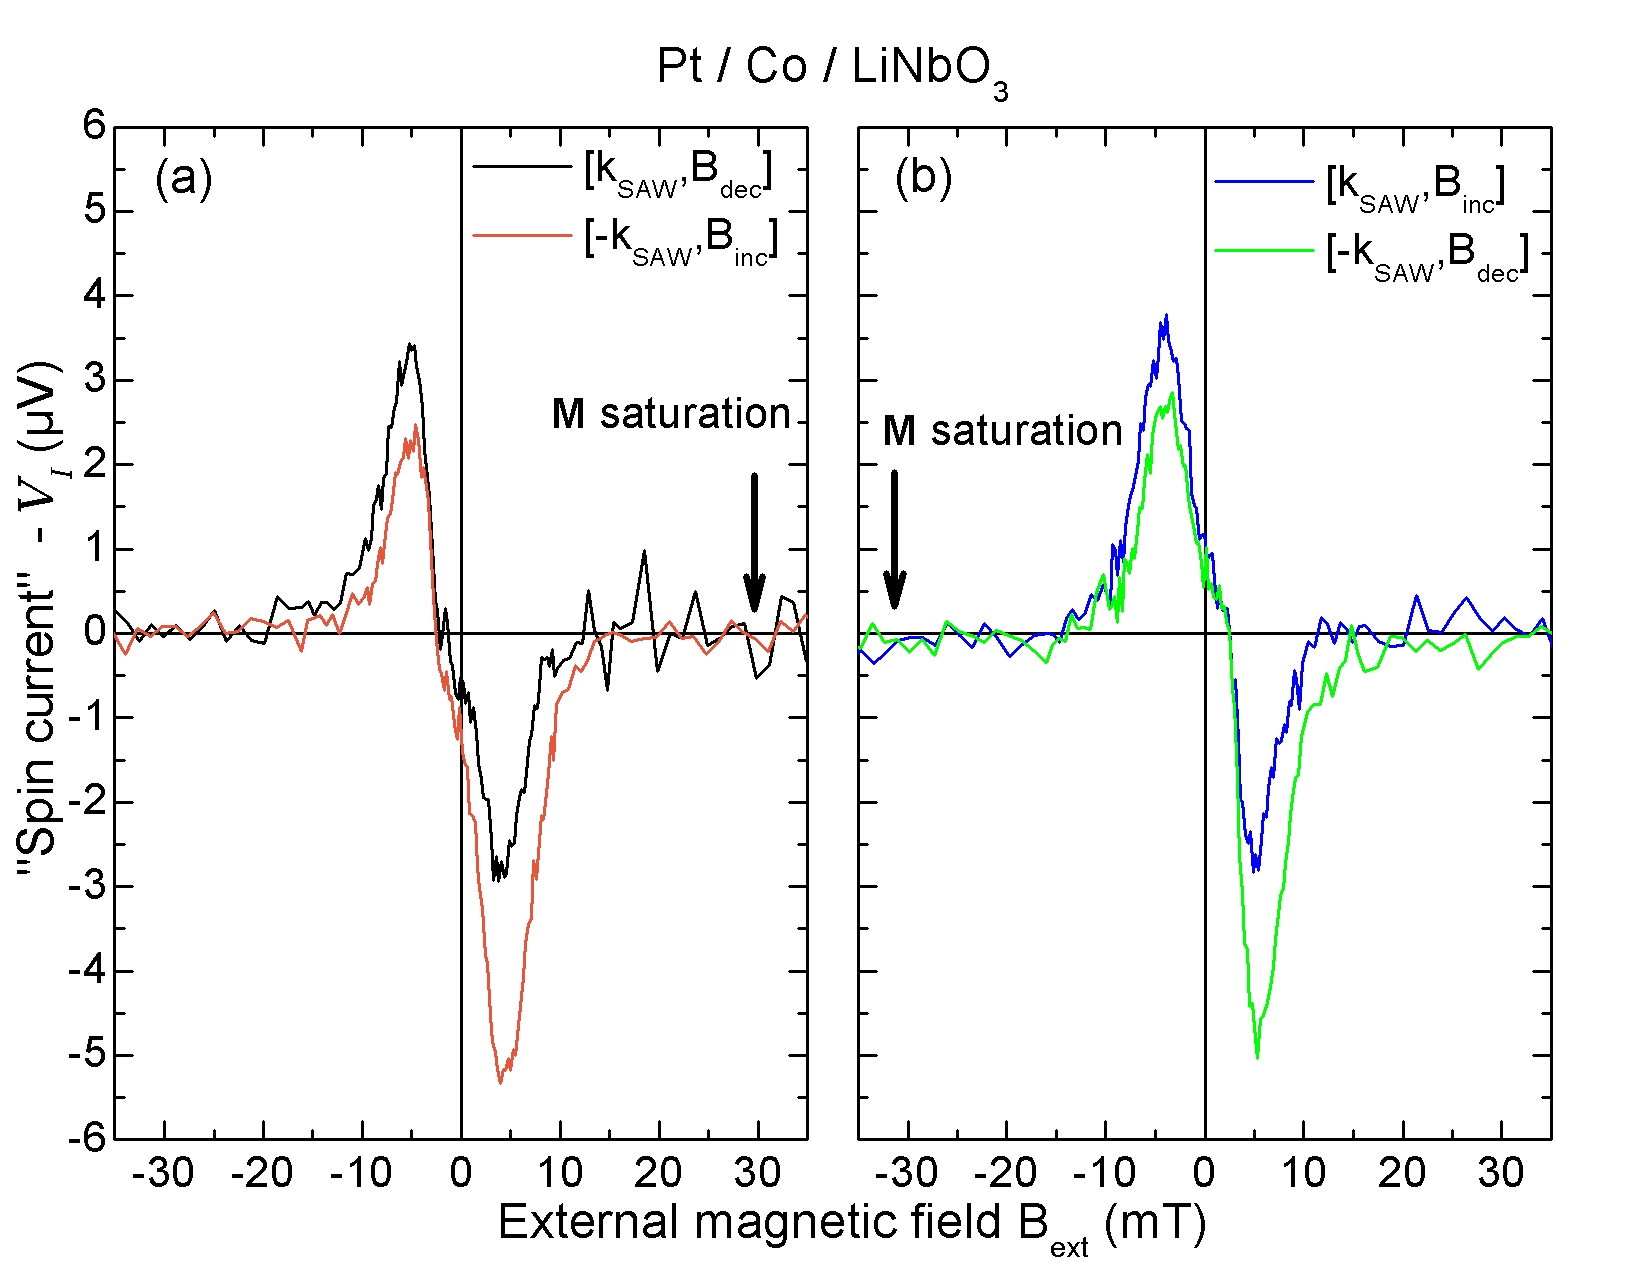
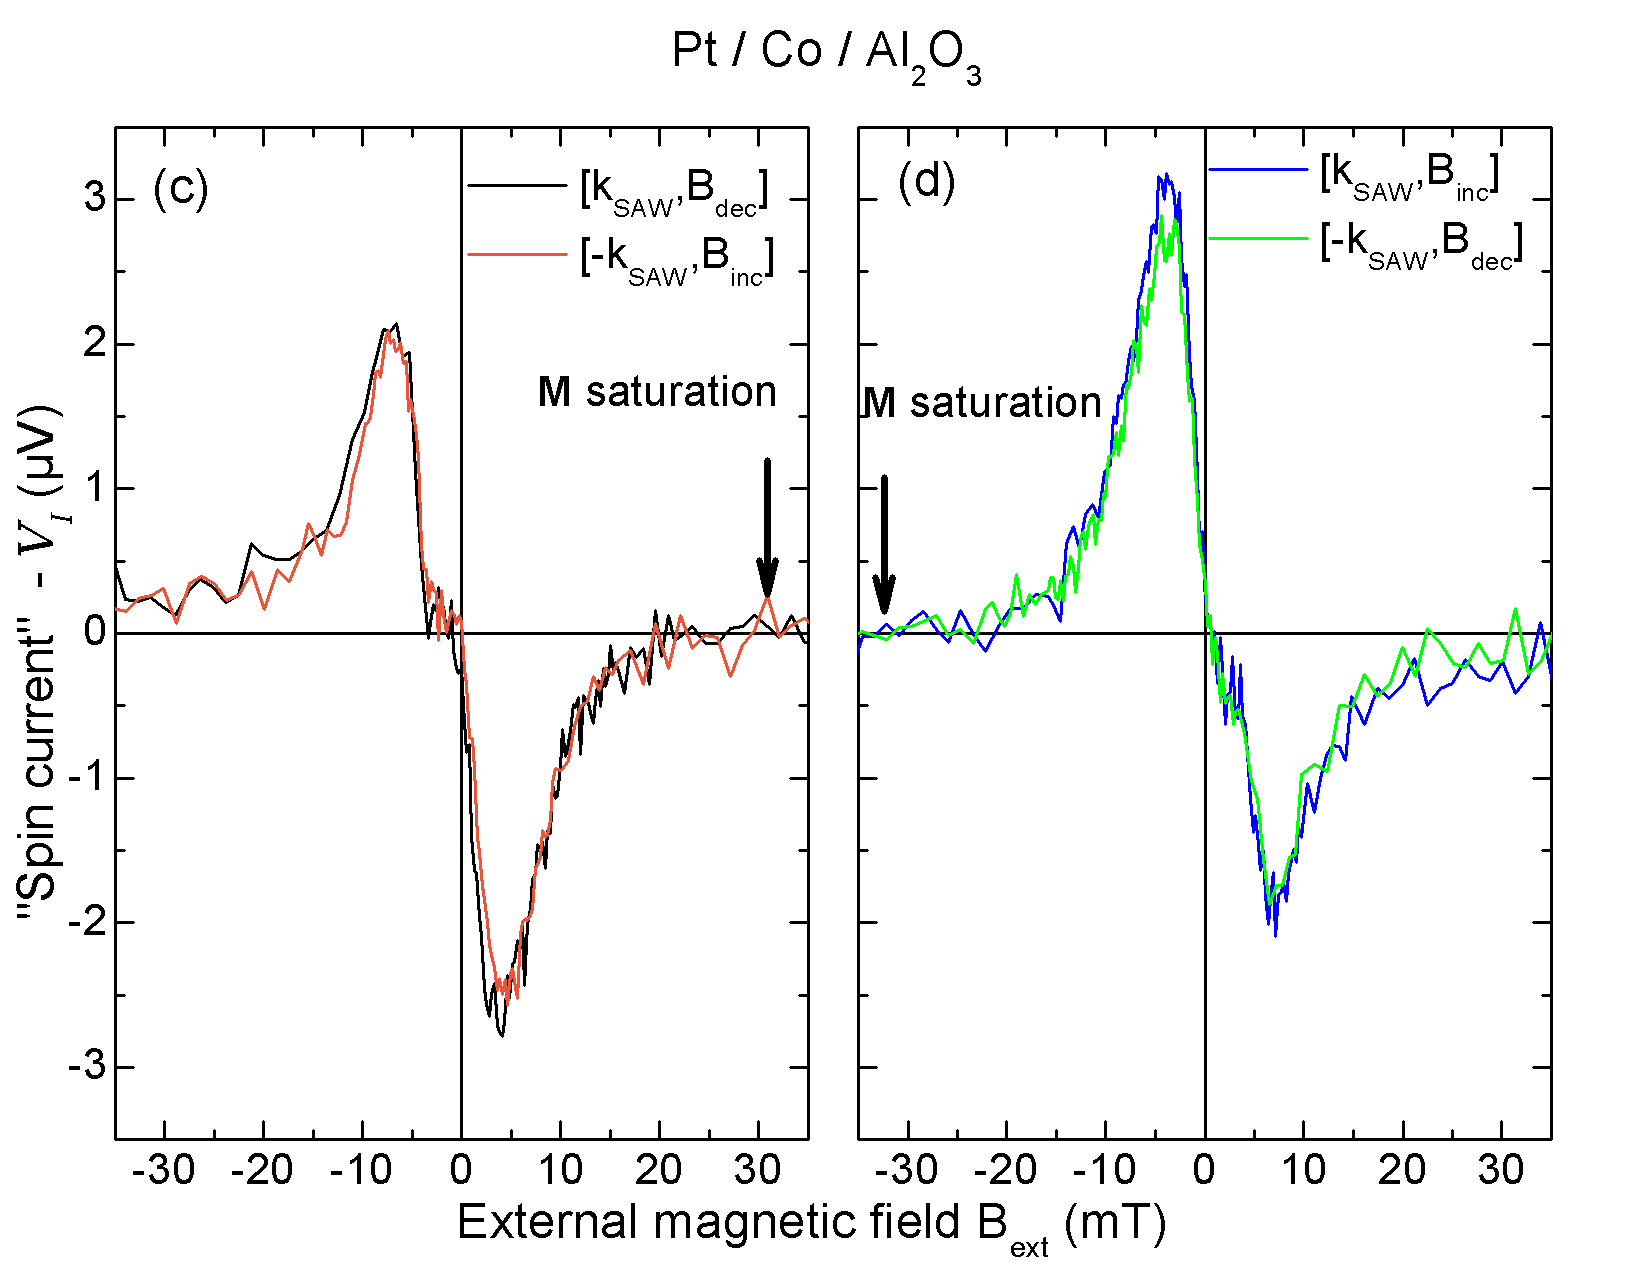
Fig.3 (a,b) displays our results for the Pt/Co/LiNbO3 sample. Clearly, the curves obtained for [kSAW, ] and [kSAW, ] scans (or [kSAW, ] and [kSAW, ] scans) do not superimpose. For example, at mT, the magnitude of the voltage is either 2.5 or 5 V, depending on the scans. This factor of 2 cannot be attributed to possible different intensities of the acoustic field, at kSAW and kSAW, arising from different efficiencies of the IDT1 and IDT2 transducers. If a multiplying factor were applied to correct the amplitudes at 5 mT, then the difference in amplitudes at -5 mT would further increase. We observed this for all angles and samples studied even if . This phenomenon must not be confused with ”non-reciprocal” acoustic propagation observed in magnetic materials where only kSAW is inverted Camley (1987).
Fig.3 (c,d) displays our results for the Pt/Co/Al2O3 sample. The curves obtained for corresponding field scans superimpose. Reversing simultaneously kSAW, Bext and M changes the sign of the measured voltage but not its magnitude. Indeed, slightly different amplitudes are observed which can be attributed to different intensities of the acoustic field, at kSAW and kSAW, arising from different efficiencies of the two transducers. The same multiplying factor of 1.1 can be applied to correct the amplitudes at 5 mT and at -5 mT.
In the Pt/Co/LiNbO3 sample, the origin of the effect has to be determined. Fundamentally, the non-symmetry of the current originates from the non-invariance of the system by a rotation of (about an axis perpendicular to the propagation plane). A tentative explanation involves the polarization vector, , that is oriented along the in-plane Z direction. One possibility concerns the excitation process and involves a coupling between the ferroelectric polarization of LiNbO3 and the ferromagnetic moment of Co, as seen in magnetoelectric materials Velev et al. (2011) or in artificial composite multiferroic systems Jedrecy et al. (2013); Jia et al. (2014); Chiba et al. (2016) where the vector is oriented perpendicularly to the FE/FM interface, permitting an efficient coupling of ferroic orders. We point out that in Y-cut LiNbO3 substrates, lies parallel to the interface. In that configuration, the electrical field in the cobalt thin film goes to zero. Nevertheless, we put forward the hypothesis that the interface roughness can induce interface charge accumulation and consequent non equilibrium spin density along the out-of-plane direction. As pointed out in Jia et al.Jia et al. (2014), this spin-unbalanced interface electrostatic effect accompanied by the so-called s-d exchange interaction, may give rise to an effective magneto-electric (ME) coupling affecting the whole Co thin film and the consequent spin pumping efficiency at the Co/Pt interface. This could modify either the magnetic precession cone angle at resonance, or the magnetic precession frequency, or both, and then modify the spin current generation. Nevertheless the BB-FMR measurements that we performed did not show any evidence of an FMR resonance shift after magnetic field reversal. This hypothesis can be tested in the future by a systematic study of non-symmetric spin pumping as a function of the interface roughness and/or the misalignment of the normal to the surface. To compare with the experiments performed on Pt/Co/Al2O3 (which display invariance by a -rotation), we notice that the Al2O3 structure is also not invariant by a -rotation since the symmetry about (0001) is only of order 3. However, a rotation leaves unchanged the location of the oxygen atoms and only involves a change in the orientation of the aluminium triangles which are located between the oxygen planes. Therefore, in our Pt/Co/Al2O3 sample, the non-invariance by a rotation of is somehow ”weak” since it is just due to slight variations of atoms stacking.
Other processes involving the detection can be evoked due to the electrical field in the Pt layer, arising from . However, they must be very weak, because of the geometry and of screening effects. In order to corroborate our hypothesis it would be interesting to quantify the effect of electrical polarization on spin current generation by modifying or reversing P through the application of an electric field. Unfortunately, the fields required to reverse the polarization are beyond our technical capabilities. Indeed, the coercive electric field of the LiNbO3 is kV.cm-1 Kim et al. (2002) which would require to apply on our samples a voltage kV.
IV Conclusion
In conclusion, we have investigated the acoustic spin pumping in Co/Pt bilayers deposited on LiNbO3 and Al2O3 substrates. Our experiments pinpoint the lack of rotational symmetry of spin-pumping signal that we possibly attribute to the permanent electrical polarization of LiNbO3. We suggest that this polarization is an important factor in the spin pumping excitation processes. The nature of the coupling with the magnetic polarization is still unclear. It may be due to a magnetoelectric coupling at the interface between LiNbO3 and Co, inducing non equilibrium spin density across the whole thin film Jia et al. (2014) and affecting spin pumping efficiency. It will be interesting to use a ferroelectric substrate whose polarisation P can be easily varied, in order to modify the spin current emission in a bilayer.
Acknowledgements.
The authors acknowledge L.Becerra and M.Rosticher for optical and electronic lithography, S.Suffit for e-beam evaporation of Co/Pt bilayers, F.Vidal for assistance during MOKE experiments, Y.J. Zheng for X-ray diffraction measurements, H.Cruguel for PFM measurements and C.Gourdon, L.Thevenard and P.Atkinson for careful reading.Appendix A Single domain evidence in ferroelectric LiNbO3
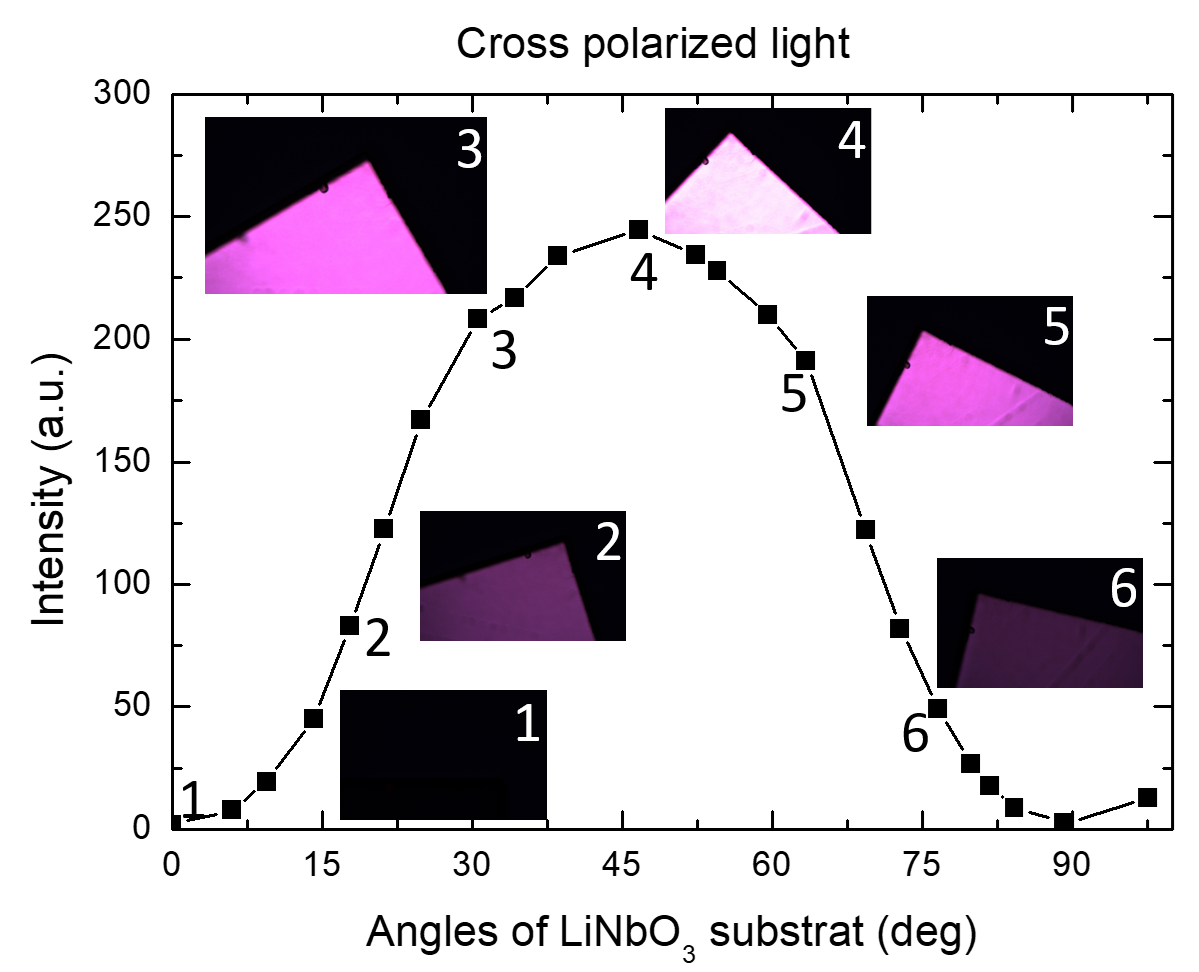
To verify that the LiNbO3 substrate is a single ferroelectric domain, we observed a substrate (from a series) using polarized light microscopy. Fig.4 summarizes our observation on a large scale (2.86 mm 2.11 mm) for a range of angles, in a rotation around the normal to the substrate. As expected, the intensity of the transmitted light depends on the angle. However, no contrast is observed over the sample, suggesting a single domain configuration. Nevertheless, anti-parallel domains cannot be excluded. To clear this point, we observed the sample (using polarized light microscopy) on a much smaller scale (110 m 83 m) in an attempt to reveal walls between anti-parallel domains. According to V.G.Zalessky et al.Zalessky and Fregatov (2006), domain walls induce optical contrast on this scale. Moreover, piezoelectric force microscopy (PFM) measurement is performed in order to detect micro- and/or nano-metric ferroelectric domains. Figures 5 (a,b,c) show PFM images for a large scale (20 m 20 m) and (d,e,f) show PFM images for a smallest scale (1 m 1 m). It turns out that ou-of-plane and in-plane measurements do not put into evidence any ferroelectric domain for both scale. We observe only a line which is present as well in the topographic and piezoelectric mode indicating that this line is a defect on the surface. Since we observed neither walls and domains, we conclude that our LiNbO3 substrates exhibit a single ferroelectric domain configurationZalessky and Fregatov (2006); Kiselev et al. (2012).
Appendix B Magnetic properties
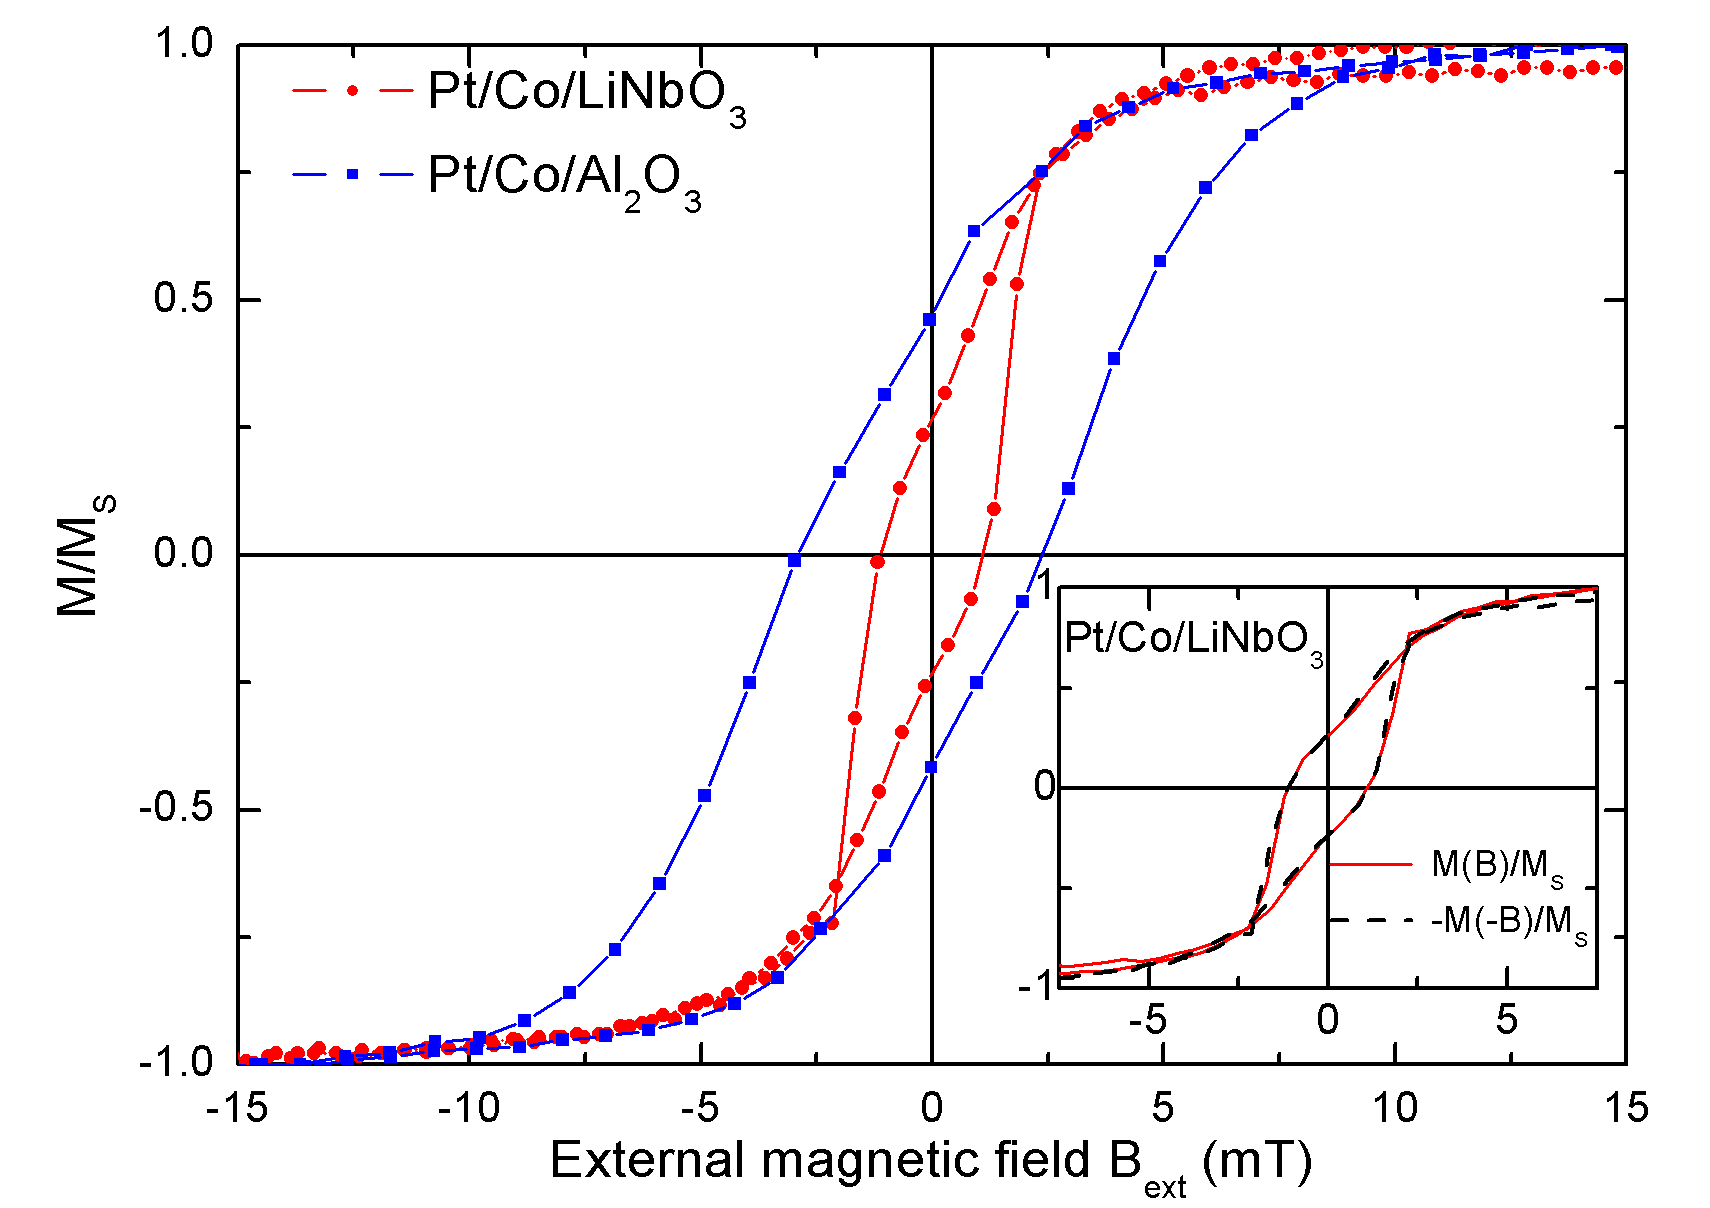
From the magnetic point of view, each evaporated Co layer has different characteristics. Figure 6 shows the magnetic cycles for Co layers deposited on LiNbO3 (at ) and Al2O3 (at ) substrates mesured by magneto-optical Kerr effect. From this measurement we can extracted the coercive field: = 1.1 mT on Pt/Co/LiNbO3 and = 3 mT on Pt/Co/Al2O3.
The insert of Fig.6 displays the raw and processed data, in case of LiNbO3: and , respectively. The nearly perfect superposition indicates that the magnetic layer is invariant by a rotation of (same for Co on Al2O3, not shown).
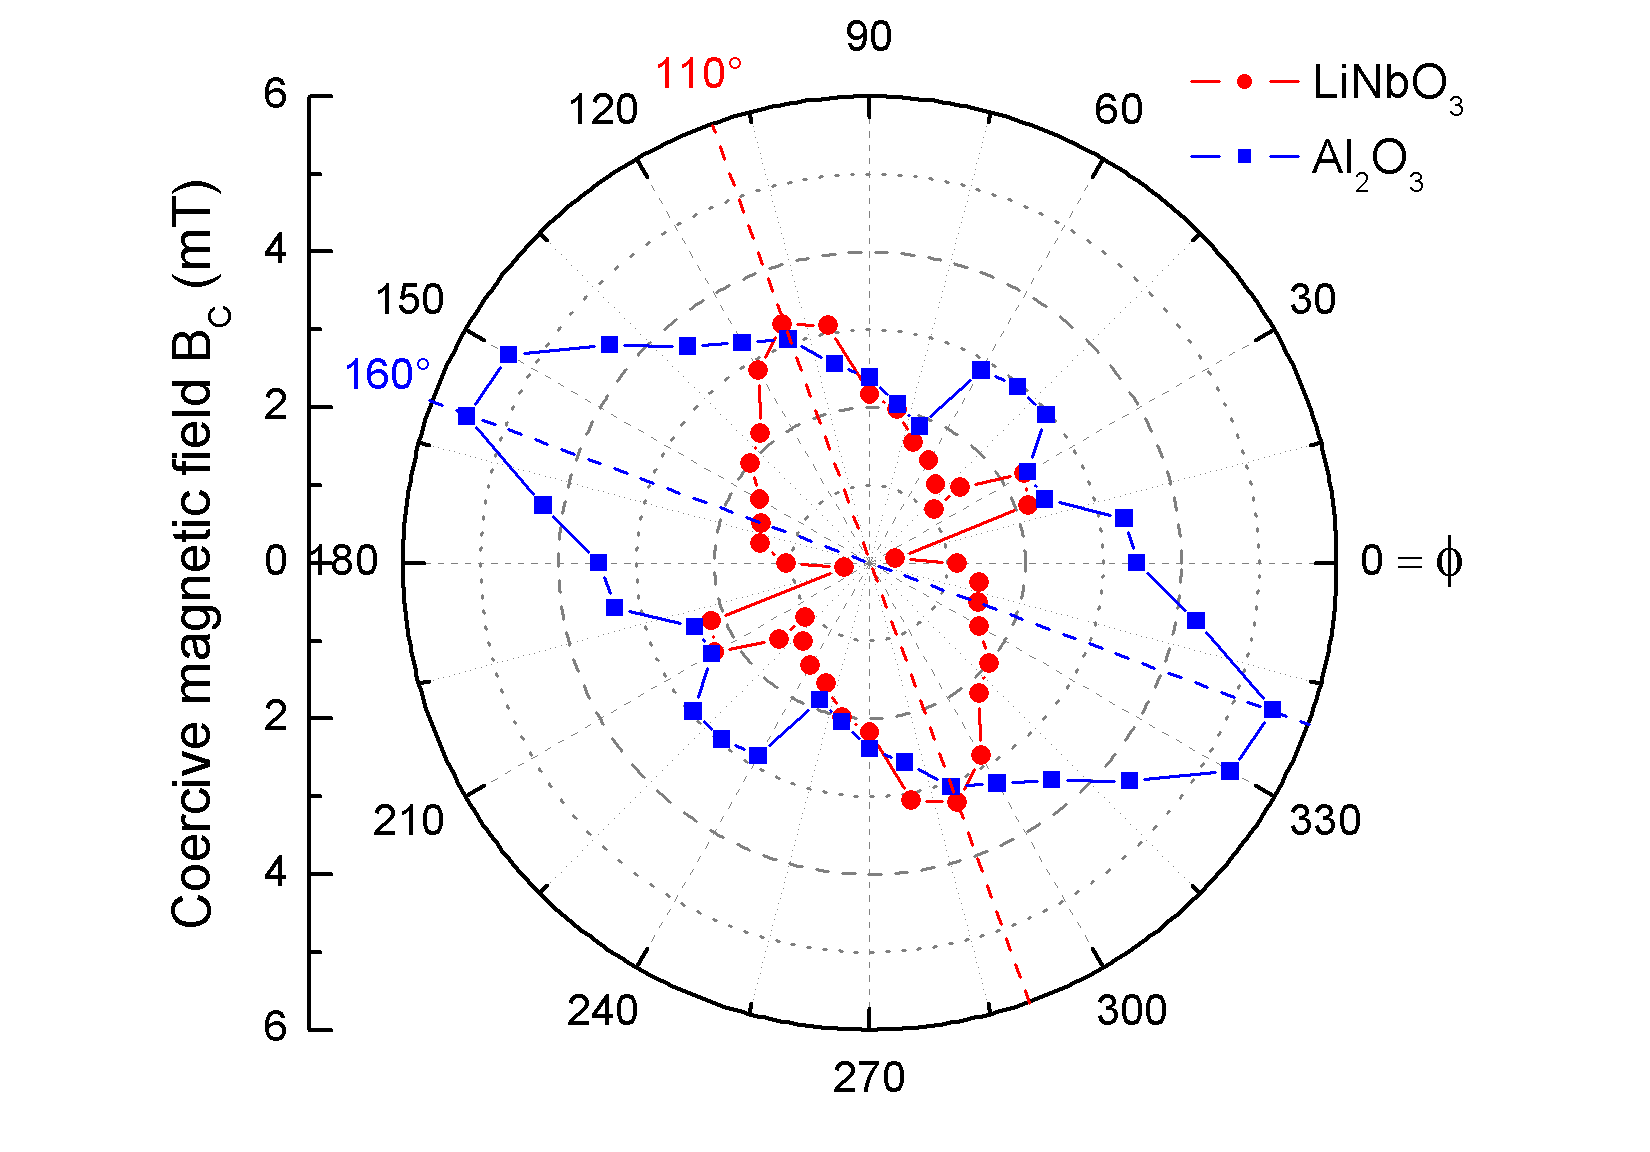
The magnetic cycle is recorded for different angles. Figure 7 displays as function of the angle, we can see that the magnetic properties are different between the two Co layers as the easy axis and the magnitude of do not match.
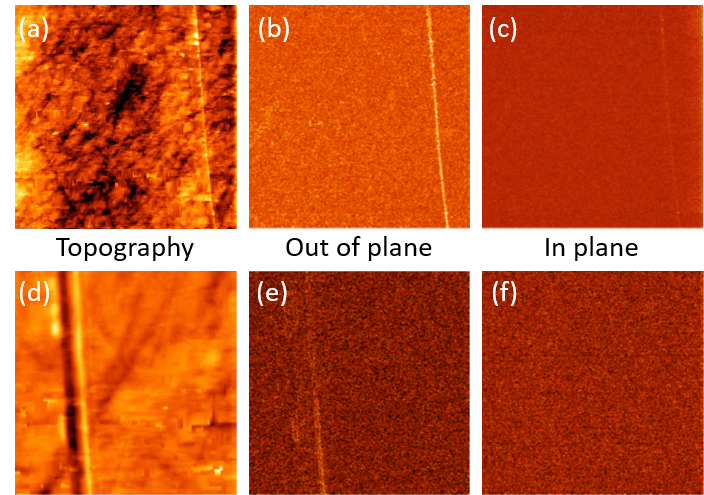
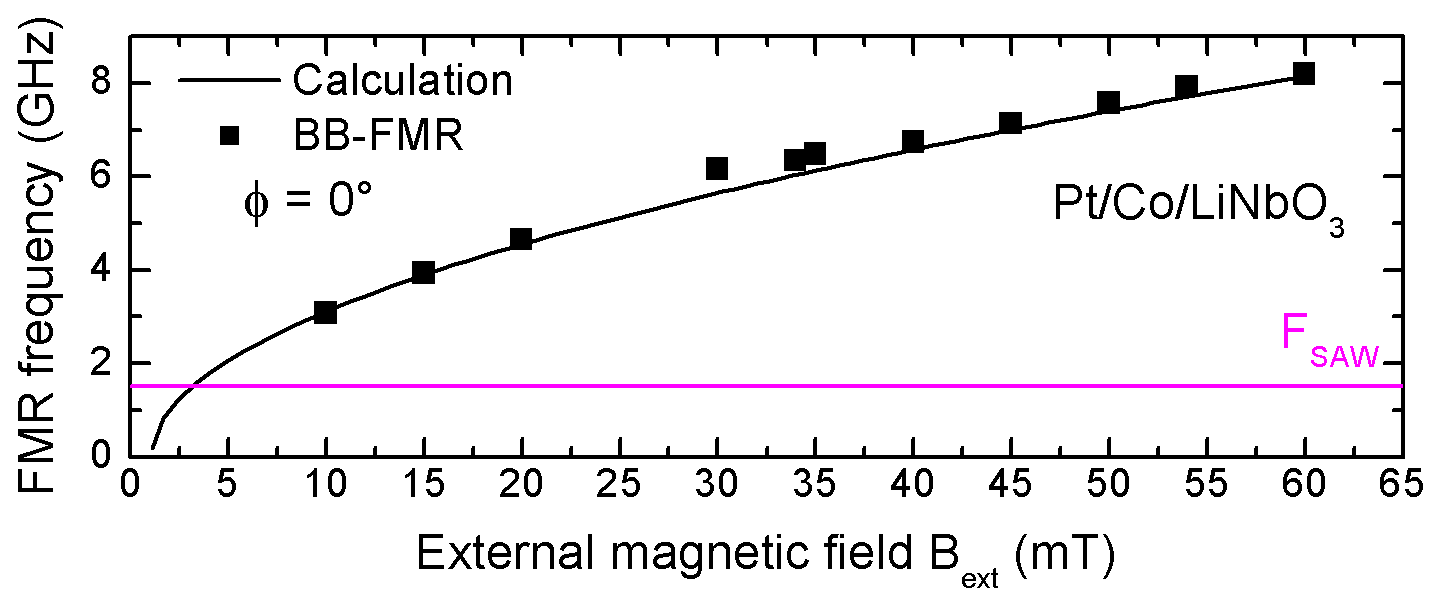
Figure 8 represents the FMR frequency, , as a function of the in-plane magnetic field amplitude (), from broadband-FMR (BB-FMR) measurements between 2.5 and 8.5 GHz. By extrapolation of our experimental values ( vs ) using the Kittel formulaKittel (1951) on both Co/Pt samples, we found a SAW-FMR resonance condition around 4 mT at 1.5 GHz in LiNbO3 and 6 mT at 1.3 GHz in Al2O3.
References
- Baibich et al. (1988) M. N. Baibich, J. M. Broto, A. Fert, F. N. Van Dau, F. Petroff, P. Eitenne, G. Creuzet, A. Friederich, and J. Chazelas, Phys. Rev. Lett. 61, 2472 (1988).
- Binasch et al. (1989) G. Binasch, P. Grünberg, F. Saurenbach, and W. Zinn, Phys. Rev. B 39, 4828 (1989).
- George et al. (1994) J. M. George, L. G. Pereira, A. Barthélémy, F. Petroff, L. Steren, J. L. Duvail, A. Fert, R. Loloee, P. Holody, and P. A. Schroeder, Phys. Rev. Lett. 72, 408 (1994).
- Maekawa et al. (2017) S. Maekawa, S. O. Valenzuela, E. Saitoh, and T. Kimura, Spin Current (Oxford University Press) (2017).
- Berger (1996) L. Berger, Phys. Rev. B 54, 9353 (1996).
- Makarov et al. (2013) A. Makarov, T. Windbacher, V. Sverdlov, al, K. L. Wang, J. G. Alzate, and P. Khalili Amiri, J. Phys. D: Appl. Phys 46, 74003 (2013).
- Uchida et al. (2008) K. Uchida, S. Takahashi, K. Harii, J. Ieda, W. Koshibae, K. Ando, S. Maekawa, and E. Saitoh, Nature 455, 778 (2008).
- Uchida et al. (2010) K. Uchida, J. Xiao, H. Adachi, J. Ohe, S. Takahashi, J. Ieda, T. Ota, Y. Kajiwara, H. Umezawa, H. Kawai, G. E. Bauer, S. Maekawa, and E. Saitoh, Nature Materials 9, 894 (2010).
- Matsuo et al. (2018) M. Matsuo, Y. Ohnuma, T. Kato, and S. Maekawa, Phys. Rev. Lett. 120, 037201 (2018).
- Kimura et al. (2007) T. Kimura, Y. Otani, T. Sato, S. Takahashi, and S. Maekawa, Phys. Rev. Lett. 98, 156601 (2007).
- Weiler et al. (2012) M. Weiler, H. Huebl, F. S. Goerg, F. D. Czeschka, R. Gross, and S. T. B. Goennenwein, Phys. Rev. Lett. 108, 176601 (2012).
- Ando et al. (2011) K. Ando, S. Takahashi, J. Ieda, Y. Kajiwara, H. Nakayama, T. Yoshino, K. Harii, Y. Fujikawa, M. Matsuo, S. Maekawa, and E. Saitoh, J. Appl. Phys 109, 103913 (2011).
- Okada et al. (2019) A. Okada, Y. Takeuchi, K. Furuya, C. Zhang, H. Sato, S. Fukami, and H. Ohno, PR Applied 12, 014040 (2019).
- Weiler et al. (2011) M. Weiler, L. Dreher, C. Heeg, H. Huebl, R. Gross, M. S. Brandt, and S. T. Goennenwein, Phys. Rev. Lett. 106, 117601 (2011).
- Thevenard et al. (2016) L. Thevenard, I. S. Camara, S. Majrab, M. Bernard, P. Rovillain, A. Lemaître, C. Gourdon, and J.-Y. Duquesne, Phys. Rev. B 93 (2016).
- Duquesne et al. (2019) J.-Y. Duquesne, P. Rovillain, C. Hepburn, M. Eddrief, P. Atkinson, A. Anane, R. Ranchal, and M. Marangolo, PR Applied 12, 024042 (2019).
- Adachi and Maekawa (2014) H. Adachi and S. Maekawa, Solid State Communications 198, 22 (2014).
- Saitoh et al. (2006) E. Saitoh, M. Ueda, H. Miyajima, and G. Tatara, Appl. Phys. Lett. 88, 182509 (2006).
- Nassau et al. (1966a) K. Nassau, H. J. Levinstein, and G. M. Loiacono, Journal of Physics and Chemistry of Solids 27, 983 (1966a).
- Nassau et al. (1966b) K. Nassau, H. J. Levinstein, and G. M. Loiacono, Journal of Physics and Chemistry of Solids 27, 989 (1966b).
- Hamida et al. (2013) A. B. Hamida, S. Sievers, K. Pierz, and H. W. Schumacher, J. Appl. Phys. 114, 123704 (2013).
- Kittel (1951) C. Kittel, J. Phys. Radium 12, 291 (1951).
- Czeschka et al. (2011) F. D. Czeschka, L. Dreher, M. S. Brandt, M. Weiler, M. Althammer, I.-M. Imort, G. Reiss, A. Thomas, W. Schoch, W. Limmer, H. Huebl, R. Gross, and S. T. B. Goennenwein, Phys. Rev. Lett. 107, 046601 (2011).
- (24) The power dependence measurement is performed for to get high intensity and the possibility to recover the signal at low power. The current emitted at Bc is also higher but does not disturb the measurement.
- Camley (1987) R. E. Camley, Surface Science Reports 7, 103 (1987).
- Velev et al. (2011) J. P. Velev, S. S. Jaswal, and E. Y. Tsymbal, Philosophical Transactions of the Royal Society A: Mathematical, Physical and Engineering Sciences 369, 3069 (2011).
- Jedrecy et al. (2013) N. Jedrecy, H. J. von Bardeleben, V. Badjeck, D. Demaille, D. Stanescu, H. Magnan, and A. Barbier, Phys. Rev. B 88, 121409(R) (2013).
- Jia et al. (2014) C.-L. Jia, T.-L. Wei, C.-J. Jiang, D.-S. Xue, A. Sukhov, and J. Berakdar, Phys. Rev. B 90, 054423 (2014).
- Chiba et al. (2016) D. Chiba, N. Shibata, and A. Tsukazaki, Sci. Rep. 6, 38005 (2016).
- Kim et al. (2002) S. Kim, V. Gopalan, and A. Gruverman, Appl. Phys. Lett. 80, 2740 (2002).
- Zalessky and Fregatov (2006) V. G. Zalessky and S. O. Fregatov, Physica B: Condensed Matter 371, 158 (2006).
- Kiselev et al. (2012) D. A. Kiselev, A. S. Bykov, R. N. Zhukov, V. V. Antipov, M. D. Malinkovich, and Y. N. Parkhomenko, Crystallography Reports 57, 781 (2012).