copyrightbox
Cross-Domain Learning for
Classifying Propaganda in Online Contents
Abstract
As news and social media exhibit an increasing amount of manipulative polarized content, detecting such propaganda has received attention as a new task for content analysis. Prior work has focused on supervised learning with training data from the same domain. However, as propaganda can be subtle and keeps evolving, manual identification and proper labeling are very demanding. As a consequence, training data is a major bottleneck.
In this paper, we tackle this bottleneck and present an approach to leverage cross-domain learning, based on labeled documents and sentences from news and tweets, as well as political speeches with a clear difference in their degrees of being propagandistic. We devise informative features and build various classifiers for propaganda labeling, using cross-domain learning. Our experiments demonstrate the usefulness of this approach, and identify difficulties and limitations in various configurations of sources and targets for the transfer step. We further analyze the influence of various features, and characterize salient indicators of propaganda.
1 Introduction
1.1 Motivation and Problem
Propaganda can be loosely defined as “misleading information that is spread deliberately to deceive and manipulate its recipients” (see, e.g., Jowett and O’Donnell, 2018 and www.britannica.com/topic/propaganda). Various factors of propaganda have been studied in the humanities, including emotionality of language, biased selection of information and deviation from facts, manipulation of cognition, and more Ellul and Kellen (1973); Silverstein (1987); Jowett and O’Donnell (2018). However, there is no consensus on the decisive factors that tell whether a given article or speech is propagandistic or not.
In the modern digital world, the influence of propaganda on society has drastically increased. Hence, there is also a major increase in computer science, computational linguistics and computational sociology research on analyzing, characterizing and, ultimately, automatically detecting propaganda Da San Martino et al. (2020).
To a first degree, one may think of propaganda as a variation of fake news, and some works investigate propaganda as a refined type of disinformation (see, e.g., Rashkin et al., 2017; Wang et al., 2019; Shu et al., 2017). While false claims can be an element of propaganda, we think that fake news is merely the tip of the iceberg, and that the persuasive and manipulative nature of propagandistic contents requires deeper approaches. Classifiers for propaganda detection need to better capture how propaganda is expressed in subtle ways by language style and rhetoric or even demagogic wording. This holds for news as well as social media posts and speeches. In all these cases, correct information may be presented in incomplete form or placed in distorted contexts, along with manipulative phrases, in order to mislead the audience.
Prior work has mostly looked into news articles (e.g., Saleh et al., 2019; Barrón-Cedeño et al., 2019; Da San Martino et al., 2019) and tweets, and has typically focused on strongly polarized topics like the 2016 US election and the related Russian Internet Research Agency (IRA) affair, the UK Brexit discussion, or political extremism. All these approaches consider propaganda detection as a classification task assuming sufficient amounts of labeled in-domain training data. For example, in the “Hack the News” datathon challenge111https://www.datasciencesociety.net/hack-news-datathon/, a large number of news articles Barrón-Cedeño et al. (2019) and sentences Da San Martino et al. (2019) from such articles were annotated by distant supervision and human judgment, respectively, to train a variety of machine learning methods. The resulting F1 scores on the leaderboard of this benchmark are amazingly high, around 90%. This may give the impression that propaganda detection is a solved problem. However, most of the positively labeled samples are simple cases of “loaded language” with strong linguistic cues independent of the topic. Moreover, the learned classifiers benefit from ample training data, which is all but self-guaranteed in general.
In this paper, we question these prior assumptions, hypothesizing that propagandistic sources and speakers are sophisticated and creative and will find new forms of deception evading the trained classifiers. The overall approach is still text classification; the novelty of our approach lies in cross-domain learning, where domains denote different kinds of sources, such as news articles vs. social media posts vs. public speeches. We acknowledge that there is often a shortage of perfectly fitting labeled data, and instead tap into alternative sources that require a transfer step. Specifically, we consider speeches and tweets, in addition to news articles, at both article and sentence levels.
1.2 Approach and Contribution
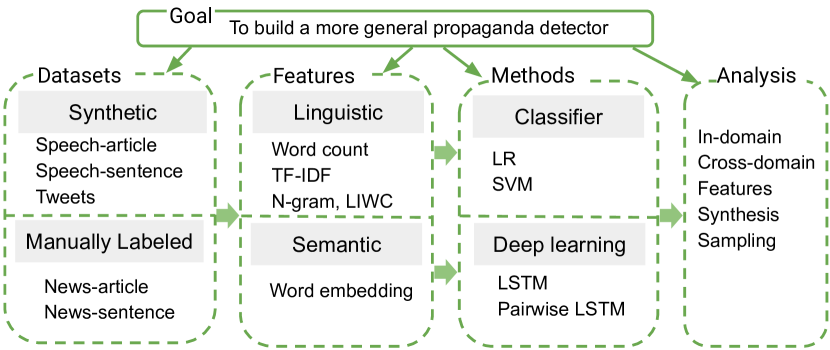
Our goal is to build more general propaganda detectors, which can leverage different kinds of data sources. In particular, we tap on political speeches of notorious propagandists, such as Joseph Goebbels (the Nazi’s Reich Minister of Propaganda). As it is very difficult (and often subjective) to label speeches and their sentences in a binary manner, we pursue a pairwise ordinal approach where training data merely ranks samples of a strongly propagandistic speaker against those of a relatively temperate speaker. We investigate to what extent models learned from such data can be transferred to classifying news and tweets, and we also study the inverse direction of learning from news and tweets to cope with speeches.
Figure 1 illustrates our framework towards generalizable propaganda detection that overcomes the bottleneck of directly applicable training labels and instead leverages cross-domain learning.
The salient contributions of this paper are as follows.
-
1.
We introduce a framework for cross-domain learning of propaganda classification. This comprises data collection, feature selection, training procedures, different learning methods, and analysis.
-
2.
We devise a pairwise ranking LSTM model, called , that uses a judiciously designed loss function to enhance cross-domain performance.
-
3.
We present experiments and analyses that provide insights into the advantages as well as limitations of cross-domain learning for propaganda classification.
-
4.
All our datasets and code have been made publicly available to support further research on understanding and countering advanced forms of propaganda.222https://github.com/leereak/propaganda-detection
2 Related Work
Propaganda Detection. We summarize the state-of-the-art according to the type of underlying data sources: the news, tweets or data to be fact-checked. Saleh et al. (2019) detect propagandistic content using a variety of well-engineered features. The study is based on a dataset of news articles annotated for the SemEval 2019 task on “Hyperpartisan News Detection”. Barrón-Cedeño et al. (2019) generated training and test data by collecting news from blacklisted sites as propaganda, while considering the Gigaword News corpus as trusted news. Further research related to propaganda detection on news articles includes work on multi-class labeling Da San Martino et al. (2019) and on the related topic of hyperpartisanship Potthast et al. (2018).
For Twitter as a data source, several datasets are widely used, most notably the tweets on the Russia-based IRA Miller (2019); Farkas and Bastos (2018); Badawy et al. (2019), contents spread by trolls or bots Caldarelli et al. (2019); Williamson III and Scrofani (2019), and extremist tweets Nizzoli et al. (2019); Johnston and Weiss (2017). Most of these studies rely on classifiers developed for bot detection to filter the propagandistic contents. Deep learning methods are also used to detect propaganda Johnston and Weiss (2017); Nizzoli et al. (2019). As more emphasis is on the analytics, the above detection techniques are still in the formative stage, by applying basic approaches like logistic regression, support vector machines, LSTMs, etc. These methods motivate us with regard to our feature engineering.
As mentioned above, some works take propaganda as a fine-grained type of fake news Rashkin et al. (2017). Some approaches Rashkin et al. (2017); Wang et al. (2019); Shu et al. (2017, 2019) considered fact-checked statements from sources such as PolitiFact, Snopes, BuzzFeed, etc. This data encompasses trusted content, satire, hoaxes, as well as propaganda, but the approaches do not develop propaganda-specific techniques. In our view, sophisticated forms of propaganda are quite different from hoaxes or plainly wrong statements, and call for custom-tailored approaches.
Propaganda Analysis. Analyses of propagandistic content have mostly looked into quantifying its influence and spreading across networks. Timothy (2017) studied how propaganda influences public opinion by means of simulations. Some studies Caldarelli et al. (2019); Williamson III and Scrofani (2019) analyzed the role of bots in spreading propagandistic posts. Gorrell et al. (2019) examined strategies of troll accounts. Farkas and Bastos (2018) reported findings on propaganda in IRA tweets. The observations suggest that techniques are customized to the targeted political agenda. As for feature analysis, the work of Barrón-Cedeño et al. (2019) and Potthast et al. (2018) investigated the effectiveness of linguistic and stylistic features. Bisgin et al. (2019) analyzed extremism propaganda contents in terms of entities, topics and targets.
Fake news analysis techniques Resende et al. (2019); Volkova and Jang (2018); Shen et al. (2017); Wang et al. (2019); Zhang et al. (2018) can as well serve as inspiration to better understand propaganda. In particular, Budak (2019) studied the prevalence and focus of fake news based on related tweets, news and interviews. Yang et al. (2019) used visualization techniques for analyzing fake news to make the detector more explainable.
3 Datasets
For our study, we compile five datasets from three domains with the aim of exploring cross-domain characteristics and performance of propaganda detection.
Speeches. We collected transcripts of speeches from four politicians, organized as ordered pairs. Trump333https://factba.se and Obama444http://obamaspeeches.com are considered as contemporary speakers, largely talking about the same or related topics. We consider the former as more propagandistic than the latter. We use Joseph Goebbels (the Nazis’ Minister of Propaganda, human-translated to English by the data provider)555https://research.calvin.edu/german-propaganda-archive/goebmain.htm and Winston Churchill (the Prime Minister of the UK)666https://winstonchurchill.org/resources/speeches/ as prominent figures from the World War II era, with the former being more propagandistic than the latter. We realize that all four of these politicians have given some propagandistic speeches. Our assumption is that, collectively and relatively, two of the speakers exhibit substantially less propaganda than the other two. The data is organized at two different levels of granularity: articles () and sentences ().
News. The news dataset comes from the Hack the News Datathon1. We combined and reorganized different datasets Barrón-Cedeño et al. (2019); Da San Martino et al. (2019) from this source, to construct an article-level news corpus () and a sentence-level corpus (), both comprehensively annotated with binary labels: propagandistic or normal. Note that the articles for the sentence-level corpus are completely disjoint from the ones in the article-level corpus. So learning on one and testing on the other entails a challenging cross-domain transfer as well.
Tweets. We combine two pre-existing collections of tweets to construct this dataset. We consider the Twitter IRA corpus Edgett (2017) with time period of 2016 as propagandistic, and the “twitter7” data from SNAP Yang and Leskovec (2011) in 2009 as regular. As “twitter7” encompasses around 476 million tweets, we under-sampled 8,963 tweets to maintain a balance with the IRA data. The tweets are randomly sampled from the June 2009 collection within the dataset. As with speeches, the data is cast into ordered pairs rather than using absolute labels as ground truth.
As some of the data initially comes with a strong label skew (with way more negative than positive samples), we apply under-sampling to construct corpora with balanced positive and negative samples. Table 1 summarizes our five datasets.
| Speeches | News | Tweets | |||
| Dataset | |||||
| Size | 288 | 24,934 | 7,798 | 7,876 | 17,926 |
4 Methods
In this section, we first introduce commonly used methods for propaganda detection, and subsequently introduce our proposed pairwise ranking model that aims at enhancing the effectiveness in the cross-domain setting.
We investigate three widely used methods as propaganda classifiers: logistic regression (LR) Hosmer Jr et al. (2013), support vector machines (SVM) Cortes and Vapnik (1995) and bidirectional long short-term memory (LSTM) Graves and Schmidhuber (2005) neural networks. In addition, we devise an enhanced form of LSTM-based network that incorporates pairwise ranking information and is equipped with a specifically designed loss function. We denote this method as LSTMR, and present it in the Subsection 4.3.
4.1 Feature-based Models
and are feature-driven learners. We consider various informative features on the language characteristics of articles and sentences:
-
word counts (WC),
-
word level TF-IDF scores (TI-W),
-
N-gram level TF-IDF scores for =2 or 3 (TI-G),
-
occurrence statistics of word categories, such as first-person pronouns or negative-emotion words, from the widely used Linguistic Inquiry and Word Count (LIWC) dictionary Pennebaker et al. (2015),
-
the combination of all the features (ALL).
4.2 LSTM Baseline Model
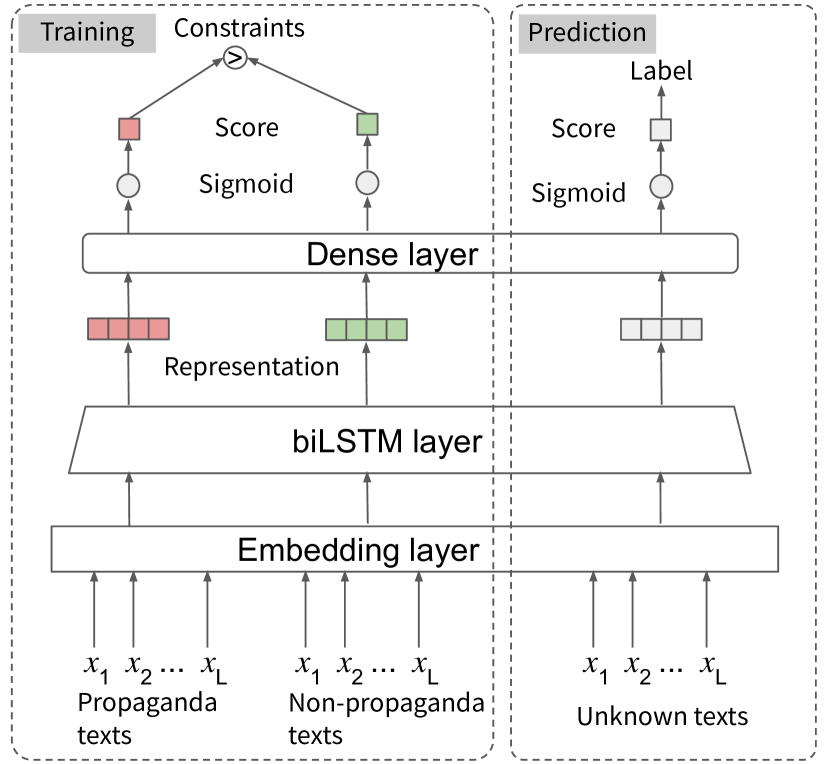
Unlike LR and SVM, the LSTM-based methods do not rely on feature modeling. Instead they can use pre-trained word embeddings to capture the text structure and semantic features. We adopt a basic LSTM classifier as a baseline. The structure of the LSTM baseline model is illustrated in Figure 2. On top of the bi-LSTM layers, the networks have a dense layer and a final sigmoid function to learn scores and yield classifier labels. The cross-entropy loss function is applied for the classifier.
4.3 Pairwise Ranking Model
Model Architecture. Figure 2 depicts our pairwise propaganda ranking model . The motivation for this design is that training labels may be subjective and noisy, especially but not only in a cross-domain setting where training and test data do not come from the same distribution. Traditional supervised learning models strictly distinguish the samples according to their labels, which leads to models over-fitting the training set, while their cross-domain generalizability diminishes. Supervised learning typically interprets the labels of data samples as a strict ground truth. In certain settings, this can lead to over-fitting to the training data distribution while hampering the ability for cross-domain learning. The model aims to mitigate this over-fitting and enhance cross-domain applicability by relaxing constraints from strict labeling to rankings. Unavoidably, the in-domain performance may decrease. As Figure 2 shows, the model operates in two phases:
-
1.
The first phase is to train the model based on the ranked pairs of data samples, where one is considered more propagandistic than the other. The bi-LSTM and dense layers serve to learn numeric scores for each of the two data points in each pair. Then the two scores are constrained by a rule that the more propagandistic sample is supposed to obtain a higher score than the other sample that it is paired up with. We can think of the former as a positive sample and the latter as a negative sample, in terms of a binary classifier. This stage results in an improved scoring function, with awareness of the constraints.
-
2.
The second phase addresses the scoring of previously unseen data points with the trained model receiving a single input text instead of a pair. The label is then determined according to the constraints-based scoring function.
Pairwise Constraints. The constraints are instantiated using the following loss functions, where is the ground-truth label ( and corresponding to the less propagandistic and the more propagandistic sample, respectively), is the predicted score, and is the indicator function with output 1(constraints are satisfied) or 0:
-
•
Logistic loss (LOG) Pasumarthi et al. (2019):
(1) -
•
Linear loss (LIN) Hanselowski et al. (2018):
(2) -
•
Threshold loss (THR), where is the threshold to control the intensity of the constraints:
(3) -
•
Counting loss (COU) to count the discordant pairs:
(4)
Among the above loss functions, the threshold loss is designed to further relax the constraints by explicitly disregarding those pairs with confidence below the threshold. We compare the model performance using different loss functions in Section 6. In the subsequent evaluation experiments we adopt loss function for by reason of its better performance.
Sampling Method. We apply different methods for constructing and sampling the ranked pairs. We consider data from all three source types: news, tweets and speeches. Whenever we have 0/1-labeled data points, we randomly combine a positive sample (1) and a negative sample (0) into an ordered pair for training the model. This is the case for news and tweets, as these datasets have been manually annotated. When we have merely relatively ordered data points where some are more propagandistic than others, we sample such pairs. This is the case for the speeches, where we assume that Goebbels is more propagandistic than Churchill and the same ranking holds for Trump versus Obama.
For news and tweets, we need to cope with skewed label distributions: way more negative than positive samples. As we consider cross-domain learning where the eventual test set has an a-priori unknown distribution that could be fairly different from the prior label distribution at training time, we generally re-balance all datasets. We consider two strategies to this end. The first is to under-sample the entire dataset, and the second is to over-sample the smaller class. Note that the over-sampling is per data point, so we still construct new pairs of ranked samples (i.e., there are no duplicate pairs).
| PN | Method | |||||||||||||||||||||||||
| WC | TI-W | TI-G | LIWC | ALL | WC | TI-W | TI-G | LIWC | ALL | WC | TI-W | TI-G | LIWC | ALL | WC | TI-W | TI-G | LIWC | ALL | WC | TI-W | TI-G | LIWC | ALL | ||
| YES | LR | 964 | 971 | 964 | 903 | 964 | 844 | 845 | 795 | 629 | 865 | 813 | 810 | 651 | 674 | 817 | 914 | 926 | 895 | 810 | 930 | 665 | 674 | 621 | 609 | 677 |
| SVM | 960 | 982 | 960 | 900 | 982 | 837 | 838 | 783 | 630 | 846 | 795 | 794 | 638 | 676 | 795 | 907 | 915 | 875 | 812 | 921 | 647 | 645 | 598 | 608 | 657 | |
| LSTM | 973 | 747 | 807 | 866 | 715 | |||||||||||||||||||||
| LSTMR | 908 | 751 | 789 | 856 | 718 | |||||||||||||||||||||
| NO | LR | 960 | 971 | 960 | 892 | 964 | 823 | 820 | 778 | 621 | 843 | 755 | 757 | 665 | 662 | 762 | 895 | 905 | 877 | 811 | 915 | 646 | 660 | 615 | 600 | 659 |
| SVM | 953 | 982 | 960 | 900 | 975 | 816 | 814 | 766 | 621 | 820 | 741 | 739 | 652 | 661 | 735 | 882 | 893 | 853 | 813 | 907 | 632 | 639 | 594 | 595 | 640 | |
5 Experimental Evaluation
| Test | ||||||||||||||||
| Train | Method | P | R | F | P | R | F | P | R | F | P | R | F | P | R | F |
| LR | - | - | - | 949 | 084 | 154 | 451 | 009 | 017 | 900 | 005 | 009 | 696 | 012 | 024 | |
| SVM | - | - | - | 887 | 181 | 301 | 532 | 056 | 102 | 771 | 014 | 027 | 553 | 055 | 101 | |
| LSTM | - | - | - | 639 | 113 | 191 | 312 | 118 | 172 | 279 | 190 | 226 | 450 | 110 | 177 | |
| LSTMR | - | - | - | 632 | 064 | 115 | 354 | 067 | 113 | 300 | 233 | 263 | 430 | 098 | 159 | |
| LR | 1000 | 667 | 800 | - | - | - | 508 | 648 | 570 | 333 | 005 | 010 | 459 | 367 | 408 | |
| SVM | 1000 | 778 | 875 | - | - | - | 507 | 630 | 562 | 440 | 017 | 033 | 472 | 400 | 433 | |
| LSTM | 886 | 486 | 628 | - | - | - | 484 | 889 | 627 | 452 | 018 | 035 | 485 | 657 | 559 | |
| LSTMR | 980 | 667 | 793 | - | - | - | 446 | 587 | 507 | 475 | 034 | 064 | 490 | 471 | 480 | |
| LR | 727 | 056 | 103 | 537 | 671 | 596 | - | - | - | 665 | 192 | 298 | 524 | 681 | 592 | |
| SVM | 583 | 049 | 090 | 524 | 619 | 568 | - | - | - | 650 | 246 | 357 | 533 | 658 | 589 | |
| LSTM | 267 | 306 | 285 | 517 | 981 | 677 | - | - | - | 537 | 770 | 633 | 496 | 961 | 654 | |
| LSTMR | 356 | 326 | 341 | 500 | 754 | 601 | - | - | - | 646 | 669 | 658 | 534 | 855 | 657 | |
| LR | 510 | 889 | 648 | 481 | 556 | 516 | 571 | 454 | 506 | - | - | - | 564 | 685 | 619 | |
| SVM | 500 | 757 | 602 | 487 | 572 | 526 | 554 | 527 | 540 | - | - | - | 557 | 702 | 621 | |
| LSTM | 516 | 986 | 678 | 362 | 264 | 305 | 532 | 197 | 287 | - | - | - | 616 | 566 | 590 | |
| LSTMR | 515 | 972 | 673 | 489 | 913 | 637 | 532 | 831 | 649 | - | - | - | 530 | 951 | 680 | |
| LR | 503 | 1000 | 670 | 460 | 474 | 467 | 571 | 393 | 466 | 514 | 980 | 674 | - | - | - | |
| SVM | 507 | 1000 | 673 | 474 | 486 | 480 | 546 | 431 | 481 | 534 | 964 | 688 | - | - | - | |
| LSTM | 505 | 1000 | 671 | 470 | 750 | 578 | 559 | 632 | 593 | 503 | 998 | 669 | - | - | - | |
| LSTMR | 511 | 1000 | 676 | 476 | 762 | 586 | 570 | 723 | 637 | 511 | 994 | 675 | - | - | - | |
| Test | ||||||||||||||||
| Train | Method | P | R | F | P | R | F | P | R | F | P | R | F | P | R | F |
| LR | - | - | - | 967 | 061 | 115 | 491 | 006 | 013 | 938 | 004 | 008 | 688 | 008 | 017 | |
| SVM | - | - | - | 925 | 098 | 178 | 546 | 026 | 050 | 778 | 007 | 014 | 535 | 023 | 045 | |
| LR | 980 | 347 | 513 | - | - | - | 494 | 581 | 534 | 207 | 002 | 003 | 449 | 347 | 391 | |
| SVM | 987 | 535 | 694 | - | - | - | 497 | 540 | 518 | 370 | 008 | 015 | 477 | 371 | 417 | |
| LR | 462 | 042 | 076 | 537 | 704 | 609 | - | - | - | 564 | 215 | 311 | 520 | 709 | 600 | |
| SVM | 333 | 028 | 051 | 525 | 641 | 577 | - | - | - | 566 | 252 | 349 | 525 | 670 | 589 | |
| LR | 518 | 785 | 624 | 486 | 422 | 452 | 569 | 341 | 427 | - | - | - | 576 | 560 | 568 | |
| SVM | 486 | 611 | 542 | 490 | 449 | 469 | 532 | 408 | 462 | - | - | - | 564 | 582 | 573 | |
| LR | 503 | 1000 | 670 | 476 | 491 | 483 | 539 | 379 | 445 | 511 | 982 | 672 | - | - | - | |
| SVM | 505 | 1000 | 671 | 494 | 506 | 500 | 522 | 432 | 473 | 534 | 961 | 687 | - | - | - | |
Setup. The feature dimensions of , -, - are truncated to their respective top 5,000, and we use LIWC 2015 Pennebaker et al. (2015) with 76 categories including first person singular, negation, sexual, swear, etc. Optionally, we eliminate proper nouns (PN), as tagged using the NLTK toolkit Bird et al. (2009). This is to reduce the influence of particular names and their respective topics (e.g., “Iran”). The rationale is that texts could be about the very same topic but differ in their degree of propaganda.
For and , we use the pre-trained 100-dimensional embeddings from GloVe (Pennington et al., 2014), 128 bi-LSTM cells and 200501 dense layers. The embeddings are frozen during training. For , the loss with a threshold of and complete sampling (neither under- nor over-sampling) is adopted. Note that is a ranking model rather than a classifier. As the ranking scores are comparable and range from 0 to 1, we empirically consider as a threshold to classify test samples as positive or negative.
For in-domain learning, where training and test data are from the same source, we adopt 5-fold cross validation. Hyper-parameters are tuned by this setting, and then kept fixed for cross-domain experiments. Note that in the cross-domain case, cross-validation is impossible as the target-domain data is treated completely unseen. We report on precision (P), recall (R) and F1 (F) scores, with propaganda being the positive class.
In-Domain Performance. The results are shown in Table 2. Overall, we achieve acceptable in-domain performance on most datasets (over 80%) except (around 65%). Results for article-level classification ( and ) are better than for the sparser, and perhaps noisier, sentence-level data (, and ). We observe a larger drop for than regarding the and methods but not for the and methods. This suggests a greater robustness of semantic features compared to linguistic features.
For the and methods, the , - and - features work better than the features. However, the combination of all four feature groups yields the best results. When omitting proper nouns, performance drops, which indicates that the models also learn some topic features instead of propaganda itself. However, the representations are not affected much when excluding proper nouns due to their focus on word categories.
The and methods perform slightly worse than and on all datasets except . Due to the influence of the pairwise ranking and the loss function, performs slightly worse than on some datasets. As a trade-off, it gets better cross-domain performance (see Table 3). Overall, feature-based learning works best for the standard case of in-domain classification.
Cross-Domain Performance. The cross-domain results are given in Table 3. As expected, cross-domain classification is much more challenging than in-domain classification. Still, many cross-domain settings show reasonably good performance. The best cross-domain results are observed for the classifier trained on and tested on . The most balanced precision–recall performance is obtained by the classifier trained on and tested on . Overall, compares favorably against other methods, especially on , and .
Combining Datasets for Training. As a final configuration, we combine several datasets, excluding , into a single training set and test on . The results are given in Table 5. As we see, the larger amount of training data does not help the classifiers to improve their cross-domain performance. On the contrary, the F1 scores slightly drop when more data is combined. The likely reason is the high variability in the underlying features and data characteristics that comes from such highly heterogeneous sources. These settings require further research.
| Method | + | ++ | +++ | |||||||||
| P | R | F | P | R | F | P | R | F | P | R | F | |
| LR | 696 | 012 | 024 | 447 | 327 | 377 | 503 | 446 | 473 | 509 | 580 | 542 |
| SVM | 553 | 055 | 101 | 485 | 363 | 415 | 508 | 475 | 491 | 507 | 554 | 529 |
| LSTM | 450 | 110 | 177 | 478 | 594 | 530 | 496 | 966 | 655 | 462 | 639 | 536 |
| LSTMR | 430 | 098 | 159 | 477 | 416 | 445 | 504 | 361 | 421 | 508 | 458 | 482 |
6 Analysis
Datasets and Granularity. The best cross-domain results are obtained for training on news and applying the learned models to speeches or tweets. This suggests that high-quality training labels are still crucial. Performance for articles is better than for sentences, underlining the difficulty of dealing with very short texts without placing them into their full context. From a model perspective, this makes features such as TF-IDF sparser without abundant signals to aid in the detection.
Proper Nouns. Table 4 shows cross-domain results when excluding proper nouns. We observe a notable drop in performance. This suggests that focusing on language alone is not sufficient for detecting propaganda. The entities to which news, tweets or speeches refer are important as topical context, and cannot be easily left out. This finding seems to contradict recent experimental work on fact checking Suntwal et al. (2019), where de-lexicalization was found useful. A major reason is that our cross-domain setting not just switches between data sources, but involves a transfer to a different style of source, like news vs. speeches. Moreover, our negative finding underlines the additional complexity of propaganda detection, calling for more research on the role of proper nouns.
Feature Groups. We conduct experiments with classifiers learned with single feature groups, using for training. Table 6 gives the cross-domain results. Comparing these against the feature performance in Tables 2 and 4, we observe that the combination of all four features has a positive effect for in-domain classification but does not work so well for cross-domain learning. However, there is no single feature group that dominates all others. This suggests that different datasets exhibit different kinds of linguistic cues, underlining again the big challenge in cross-domain classification.
| Method | ||||||||||||||||
| 1 | 2 | 3 | 4 | 1 | 2 | 3 | 4 | 1 | 2 | 3 | 4 | 1 | 2 | 3 | 4 | |
| LR | 673 | 673 | 671 | 387 | 397 | 458 | 452 | 491 | 422 | 487 | 418 | 435 | 672 | 676 | 623 | 603 |
| SVM | 674 | 673 | 678 | 390 | 428 | 467 | 458 | 493 | 459 | 498 | 416 | 443 | 687 | 688 | 662 | 596 |
Informative Language Features. To analyze to what extent word-level features can yield interpretable cues that characterize propaganda in different kinds of sources, we trained the classifer on the data with - and features, excluding proper nouns. We observed the following most distinctive words, characteristic for propaganda:
-
“advantage”, “absolutely”, “neo”, “political”, “attacks”, “american”, “shocking”, “influential”, “impossible”, “lies”, “devastating”, “hell”, “administration”, “autonomous”, “ridiculous”
The most salient features (word categories) were:
-
affect, neg-emo, anger, swear, certain
This suggests that exaggerations (e.g., “absolutely”) and negative emotions (e.g., “lies” or “devastating”) play a key role in manipulating the audience. As for features, words that express negative emotions are typical for propaganda, as well as being strongly self-confident.
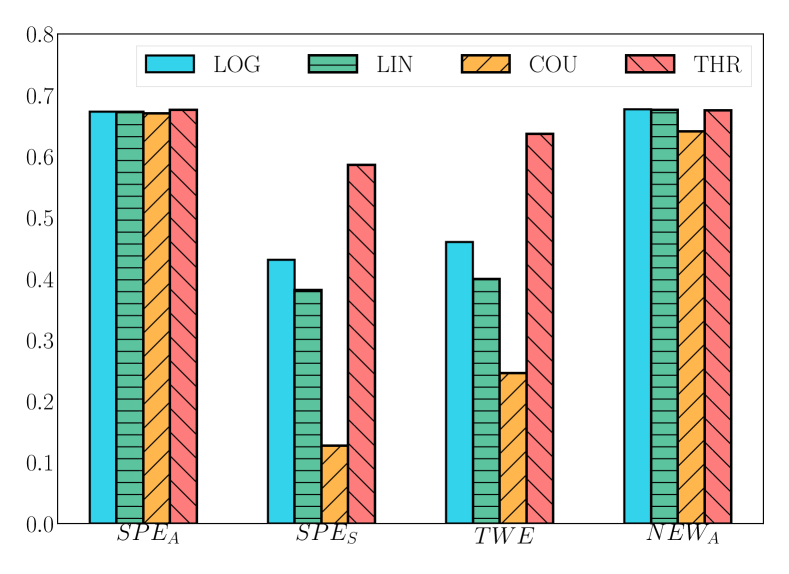
LSTMR Loss Functions. For our model, the selection of the loss function has a notable influence on performance. The previous experiments all used as loss function. Training on and with cross-domain test data, Figure 3 compares the effectiveness of all four loss functions that we studied. We notice that the specifically designed loss function outperforms all alternatives, especially on the and datasets. This observation is in line with our design goal that helps the model training to discount ranked pairs of low confidence. We sacrifice in-domain performance to some extent, but improve the cross-domain classifier.
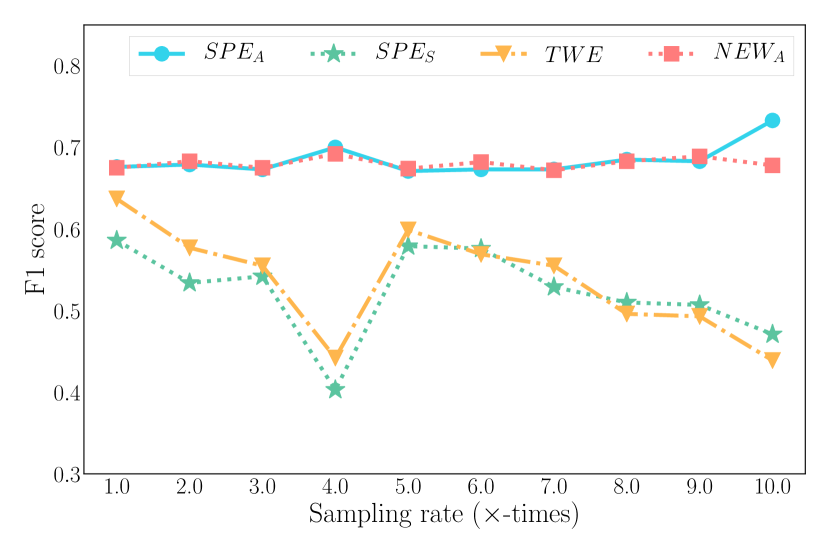
Sampling Strategies. The training of requires ranked pairs of samples. Over-sampling constructs these pairs by repeatedly drawing from the positive and negative classes. The effect of the amount of over-sampling is plotted in Figure 4, for the setting with training on and cross-domain testing on the other datasets. The results show the limitations of this sampling strategy: there is hardly any increase in performance and even a drop for some cases. This calls for further research towards overcoming training bottlenecks.
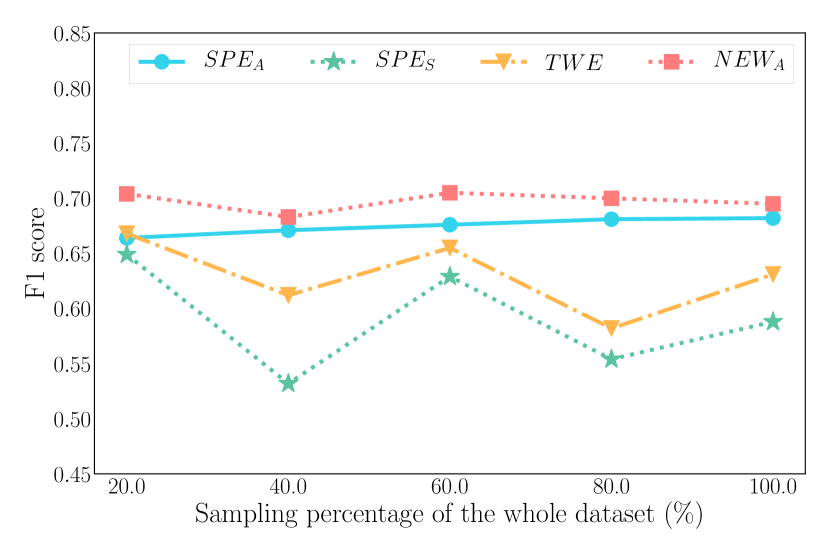
For the under-sampling strategy, Figure 5 shows results (for the same train-test setting) with varying fractions of training samples. On the data, the performance increases with more training samples, as expected. However, on other test datasets, performance remains unchanged or drops or fluctuates. This points out the limitations of cross-domain classification. Our approach counters the training bottleneck to a good degree, but there is quite some room for improvement and the need for further research.
7 Conclusion and Future Work
Although propaganda has become a pervasive challenge in online media, previous work has mostly treated it as a variation of fake news, or considered unrealistic settings where the test distribution precisely matches the training data distribution.
In this paper, we present a first and preliminary analysis of the problem of propaganda detection in cross-domain learning settings. This encompasses several novel aspects, ranging from data collection methods, feature computation, designing different classifiers, and the corresponding analysis. We tap into a previously unexplored content source: speeches by politicans who are known for different levels of propaganda, using them as collective and relative signals. On the methodology side, we devise a pairwise ranking method with customized loss functions to improve the classification. The experimental results demonstrate the effectiveness of this method. Furthermore, we conduct a series of experiments to explore the most salient factors for cross-domain generalizability of propaganda detection learning. The observations and analysis reveal insightful patterns and lessons for building more general propaganda detectors.
As our datasets are still fairly small, our findings are of preliminary nature and our methodology is subject to ongoing research. We believe that cross-domain learning is a crucial asset for the important topic of propaganda detection, and hope that our initial results are useful for further research along these lines.
Acknowledgments
The work is partly supported by “The Fundamental Research Funds of Shandong University”. Gerhard Weikum’s work is partly supported by the ERC Synergy Grant 610150 (imPACT). Any opinions, findings and conclusions, or recommendations expressed in this material are those of the authors and do not necessarily reflect the views of the funding agencies.
References
- Badawy et al. (2019) Adam Badawy, Aseel Addawood, Kristina Lerman, and Emilio Ferrara. 2019. Characterizing the 2016 russian ira influence campaign. Social Network Analysis and Mining, 9(1):31.
- Barrón-Cedeño et al. (2019) Alberto Barrón-Cedeño, Israa Jaradat, Giovanni Da San Martino, and Preslav Nakov. 2019. Proppy: Organizing the news based on their propagandistic content. Information Processing & Management, 56(5):1849–1864.
- Bird et al. (2009) Steven Bird, Ewan Klein, and Edward Loper. 2009. Natural language processing with Python: analyzing text with the natural language toolkit. O’Reilly Media, Inc.
- Bisgin et al. (2019) Halil Bisgin, Hasan Arslan, and Yusuf Korkmaz. 2019. Analyzing the dabiq magazine: The language and the propaganda structure of isis. In International Conference on Social Computing, Behavioral-Cultural Modeling and Prediction and Behavior Representation in Modeling and Simulation, pages 1–11. Springer.
- Budak (2019) Ceren Budak. 2019. What happened? The spread of fake news publisher content during the 2016 US presidential election. In The World Wide Web Conference, pages 139–150. ACM.
- Caldarelli et al. (2019) Guido Caldarelli, Rocco De Nicola, Fabio Del Vigna, Marinella Petrocchi, and Fabio Saracco. 2019. The role of bot squads in the political propaganda on twitter. arXiv preprint arXiv:1905.12687.
- Cortes and Vapnik (1995) Corinna Cortes and Vladimir Vapnik. 1995. Support-vector networks. Machine learning, 20(3):273–297.
- Da San Martino et al. (2020) Giovanni Da San Martino, Stefano Cresci, Alberto Barrón-Cedeño, Seunghak Yu, Roberto Di Pietro, and Preslav Nakov. 2020. A survey on computational propaganda detection. In Proceedings of the Twenty-Ninth International Joint Conference on Artificial Intelligence, IJCAI 2020, pages 4826–4832. IJCAI.
- Da San Martino et al. (2019) Giovanni Da San Martino, Seunghak Yu, Alberto Barrón-Cedeño, Rostislav Petrov, and Preslav Nakov. 2019. Fine-grained analysis of propaganda in news article. In Proceedings of the 2019 Conference on Empirical Methods in Natural Language Processing and the 9th International Joint Conference on Natural Language Processing (EMNLP-IJCNLP), pages 5640–5650. ACL.
- Edgett (2017) Sean Edgett. 2017. Testimony of Sean J. Edgett. United States Senate Committee on the Judiciary, Subcommittee on Crime and Terrorism.
- Ellul and Kellen (1973) Jacques Ellul and Konrad Kellen. 1973. Propaganda: The formation of men’s attitudes. Vintage Books New York.
- Farkas and Bastos (2018) Johan Farkas and Marco Bastos. 2018. Ira propaganda on twitter: Stoking antagonism and tweeting local news. In Proceedings of the 9th International Conference on Social Media and Society, pages 281–285. ACM.
- Gorrell et al. (2019) Genevieve Gorrell, Mehmet E Bakir, Ian Roberts, Mark A Greenwood, Benedetta Iavarone, and Kalina Bontcheva. 2019. Partisanship, propaganda and post-truth politics: Quantifying impact in online debate. arXiv preprint arXiv:1902.01752.
- Graves and Schmidhuber (2005) Alex Graves and Jürgen Schmidhuber. 2005. Framewise phoneme classification with bidirectional lstm and other neural network architectures. Neural networks, 18(5-6):602–610.
- Hanselowski et al. (2018) Andreas Hanselowski, Hao Zhang, Zile Li, Daniil Sorokin, Benjamin Schiller, Claudia Schulz, and Iryna Gurevych. 2018. Ukp-athene: Multi-sentence textual entailment for claim verification. arXiv preprint arXiv:1809.01479.
- Hosmer Jr et al. (2013) David W Hosmer Jr, Stanley Lemeshow, and Rodney X Sturdivant. 2013. Applied logistic regression, volume 398. John Wiley & Sons.
- Johnston and Weiss (2017) Andrew H Johnston and Gary M Weiss. 2017. Identifying sunni extremist propaganda with deep learning. In 2017 IEEE Symposium Series on Computational Intelligence (SSCI), pages 1–6. IEEE.
- Jowett and O’Donnell (2018) Garth S. Jowett and Victoria O’Donnell. 2018. Propaganda & Persuasion (7th Edition). Sage Publications.
- Miller (2019) Daniel Taninecz Miller. 2019. Topics and emotions in russian twitter propaganda. First Monday, 24(5).
- Nizzoli et al. (2019) Leonardo Nizzoli, Marco Avvenuti, Stefano Cresci, and Maurizio Tesconi. 2019. Extremist propaganda tweet classification with deep learning in realistic scenarios. In Proceedings of the 10th ACM Conference on Web Science, pages 203–204. ACM.
- Pasumarthi et al. (2019) Rama Kumar Pasumarthi, Sebastian Bruch, Xuanhui Wang, Cheng Li, Michael Bendersky, Marc Najork, Jan Pfeifer, Nadav Golbandi, Rohan Anil, and Stephan Wolf. 2019. Tf-ranking: Scalable tensorflow library for learning-to-rank. In Proceedings of the 25th ACM SIGKDD International Conference on Knowledge Discovery & Data Mining, pages 2970–2978. ACM.
- Pennebaker et al. (2015) James W Pennebaker, Ryan L Boyd, Kayla Jordan, and Kate Blackburn. 2015. The development and psychometric properties of liwc2015. Technical report.
- Pennington et al. (2014) Jeffrey Pennington, Richard Socher, and Christopher Manning. 2014. Glove: Global vectors for word representation. In Proceedings of the 2014 conference on empirical methods in natural language processing (EMNLP), pages 1532–1543.
- Potthast et al. (2018) Martin Potthast, Johannes Kiesel, Kevin Reinartz, Janek Bevendorff, and Benno Stein. 2018. A stylometric inquiry into hyperpartisan and fake news. In Proceedings of the 56th Annual Meeting of the Association for Computational Linguistics (Volume 1: Long Papers), pages 231–240.
- Rashkin et al. (2017) Hannah Rashkin, Eunsol Choi, Jin Yea Jang, Svitlana Volkova, and Yejin Choi. 2017. Truth of varying shades: Analyzing language in fake news and political fact-checking. In Proceedings of the 2017 Conference on Empirical Methods in Natural Language Processing, pages 2931–2937.
- Resende et al. (2019) Gustavo Resende, Philipe Melo, Hugo Sousa, Johnnatan Messias, Marisa Vasconcelos, Jussara Almeida, and Fabrício Benevenuto. 2019. (Mis) Information dissemination in WhatsApp: Gathering, analyzing and countermeasures. In The World Wide Web Conference, pages 818–828. ACM.
- Saleh et al. (2019) Abdelrhman Saleh, Ramy Baly, Alberto Barrón-Cedeño, Giovanni Da San Martino, Mitra Mohtarami, Preslav Nakov, and James Glass. 2019. Team QCRI-MIT at SemEval-2019 Task 4: Propaganda analysis meets hyperpartisan news detection. In Proceedings of the 13th International Workshop on Semantic Evaluation, pages 1041–1046.
- Shen et al. (2017) Xiaoyu Shen, Youssef Oualil, Clayton Greenberg, Mittul Singh, and Dietrich Klakow. 2017. Estimation of gap between current language models and human performance. Proc. Interspeech 2017, pages 553–557.
- Shu et al. (2017) Kai Shu, Amy Sliva, Suhang Wang, Jiliang Tang, and Huan Liu. 2017. Fake news detection on social media: A data mining perspective. ACM SIGKDD Explorations Newsletter, 19(1):22–36.
- Shu et al. (2019) Kai Shu, Suhang Wang, and Huan Liu. 2019. Beyond news contents: The role of social context for fake news detection. In Proceedings of the Twelfth ACM International Conference on Web Search and Data Mining, pages 312–320. ACM.
- Silverstein (1987) Brett Silverstein. 1987. Toward a science of propaganda. Political Psychology, pages 49–59.
- Suntwal et al. (2019) Sandeep Suntwal, Mithun Paul, Rebecca Sharp, and Mihai Surdeanu. 2019. On the importance of delexicalization for fact verification. In Proceedings of the 2019 Conference on Empirical Methods in Natural Language Processing and the 9th International Joint Conference on Natural Language Processing, EMNLP-IJCNLP 2019, Hong Kong, China, November 3-7, 2019, pages 3411–3416. ACL.
- Timothy (2017) Jithender J Timothy. 2017. How does propaganda influence the opinion dynamics of a population? arXiv preprint arXiv:1703.10138.
- Volkova and Jang (2018) Svitlana Volkova and Jin Yea Jang. 2018. Misleading or falsification: Inferring deceptive strategies and types in online news and social media. In Companion Proceedings of the The Web Conference 2018, pages 575–583. ACM.
- Wang et al. (2019) Liqiang Wang, Yafang Wang, Gerard de Melo, and Gerhard Weikum. 2019. Understanding archetypes of fake news via fine-grained classification. Social Network Analysis and Mining, 9(1):37.
- Williamson III and Scrofani (2019) William Williamson III and James Scrofani. 2019. Trends in detection and characterization of propaganda bots. In Proceedings of the 52nd Hawaii International Conference on System Sciences.
- Yang et al. (2019) Fan Yang, Shiva K Pentyala, Sina Mohseni, Mengnan Du, Hao Yuan, Rhema Linder, Eric D Ragan, Shuiwang Ji, and Xia Ben Hu. 2019. Xfake: Explainable fake news detector with visualizations. In The World Wide Web Conference, pages 3600–3604. ACM.
- Yang and Leskovec (2011) Jaewon Yang and Jure Leskovec. 2011. Patterns of temporal variation in online media. In Proceedings of the fourth ACM international conference on Web search and data mining, pages 177–186. ACM.
- Zhang et al. (2018) Amy X Zhang, Aditya Ranganathan, Sarah Emlen Metz, Scott Appling, Connie Moon Sehat, Norman Gilmore, Nick B Adams, Emmanuel Vincent, Jennifer Lee, Martin Robbins, et al. 2018. A structured response to misinformation: Defining and annotating credibility indicators in news articles. In Companion Proceedings of the The Web Conference 2018, pages 603–612. ACM.