Ultrabroad-Band Direct Digital Refractive Index Imaging Based on Suspended Graphene Plasmon Cavities
Abstract
Mid-infrared spectroscopy is essential for chemical identification and compositional analysis, due to the existence of characteristic molecular absorption fingerprints. However, it is very challenging to determine the refractive index of an analyte at low concentrations using current photonic systems in a broad mid-infrared spectral range. We propose an imaging-based nanophotonic technique for refractive index determination. The technique is based on deeply subwavelength graphene plasmon cavities and allows for the retrieval of molecular concentration. This method features a two-dimensional array of suspended graphene plasmon cavities, in which the extremely high field enhancement and extraordinary compression of graphene plasmons can be realized simultaneously by combining shallow and deep cavities. This enables resonant unit cells to be read out in the spatial absorption pattern of the array at multiple spectral points, and the resulting information is then translated into the refractive index of the analytes. The proposed technique gives complementary information compared with the current nanophotonic techniques based on molecular absorption, including the ability of the refractive index measurement, the ultra-broadband measurable spectral range, and the small volume of the analyte required, thereby pushing the potential for refractometric sensing technologies into the infrared frequencies.
keywords:
Graphene plasmonics; Suspended 2D materials; Surface phonon polaritons; Sensing; MetamaterialsChair in Hybrid Nanosystems, Nanoinstitute München, Faculty of Physics, Ludwig-Maximilians-Universität München, 80539 München, Germany \abbreviationsIR,NMR,UV
1 Introduction
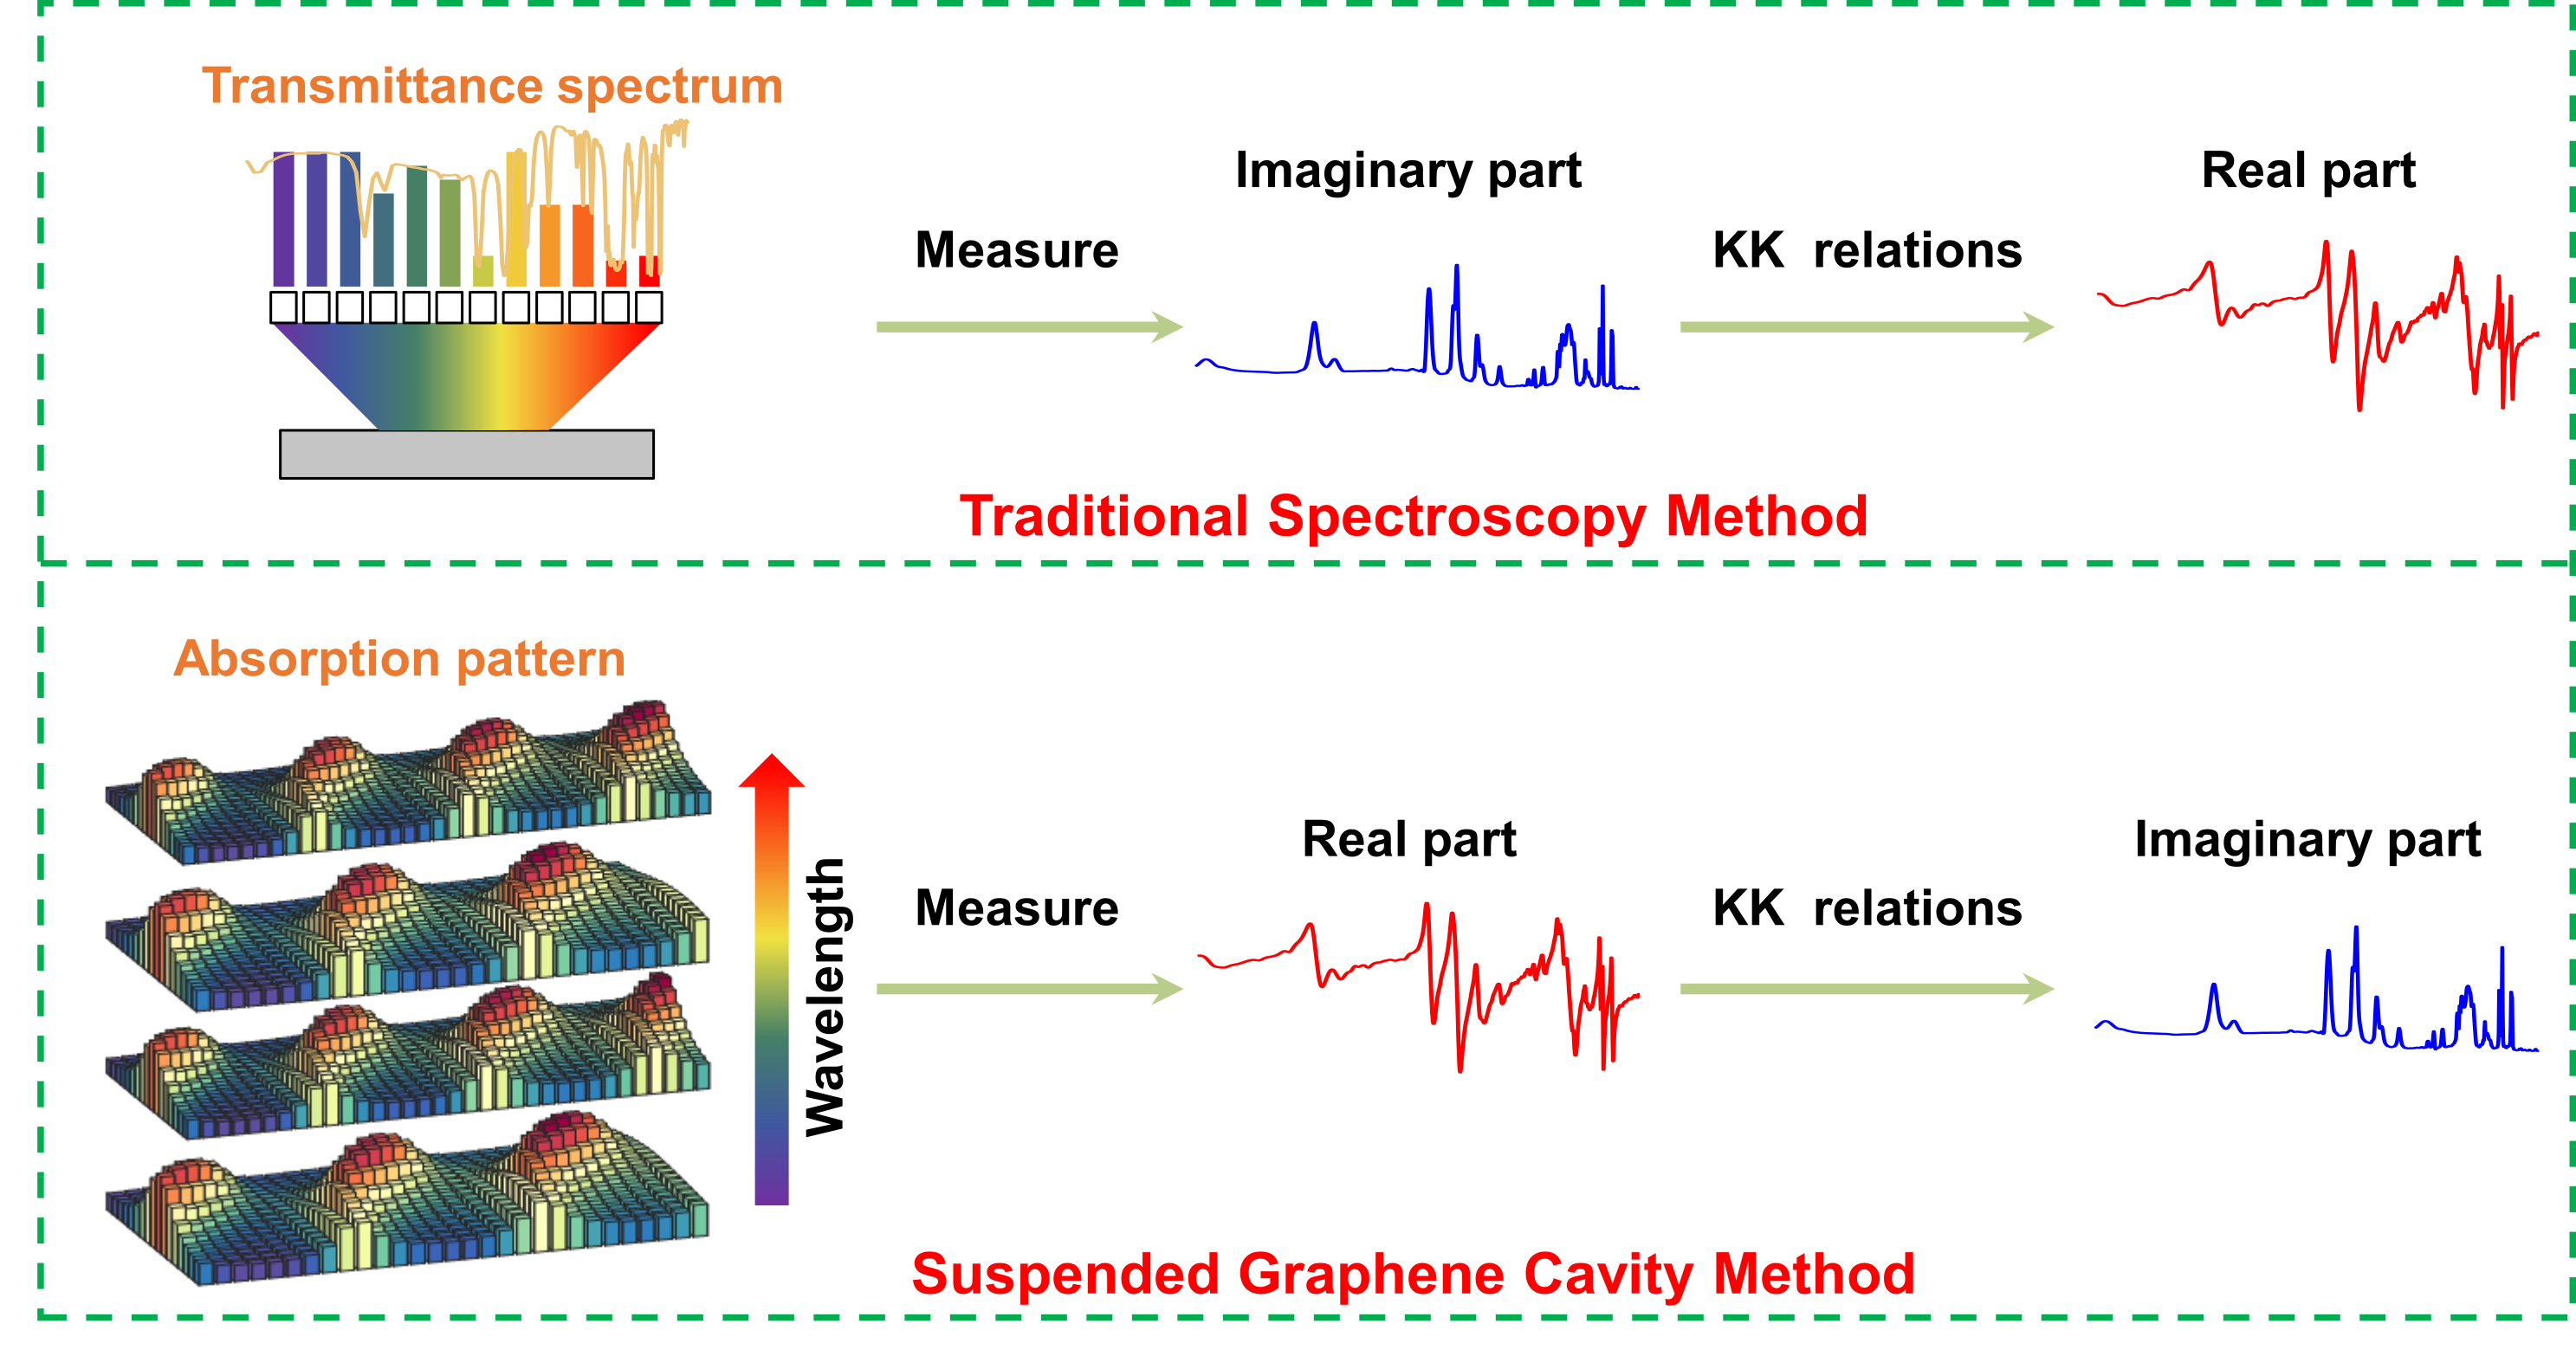
The mid-infrared (MIR) spectrum is known for the presence of characteristic molecular absorption fingerprints originating from the intrinsic vibrational modes of chemical bonds, and thus the MIR spectrum is critical for chemical identification and structural characterization 1. MIR optical sensing technologies, such as MIR absorption spectroscopy, allow for the direct characterization of molecular structures, and have been recognized as powerful, non-destructive, label-free techniques for chemical analysis 2. Conventionally, spectral analysis is achieved using macro systems, such as Fourier-transform infrared (FTIR) spectrometers, which measure the transmittance or emission spectrum of the analyte using gratings 3. The analyte can be characterised based on either the retrieved refractive index (Fig. 1) or the existence of the characteristic molecular absorption fingerprints. However, this bulk approach usually requires complex and expensive equipment, such as FTIR spectrometers, and suffers from low sensitivity when detecting signals from small volumes of samples, because of the mismatch between MIR wavelengths ( µm) and the dimensions of molecules ( nm).
To tackle this problem, nanophotonic systems with strong near-field enhancement of subwavelength resonators have been explored in MIR optical sensing. Recent sensor-on-chip approaches based on the surface-enhanced infrared absorption (SEIRA) have been realized based on various nanophotonic platforms 4, 5, 6, 7, 8, 9, 1, which potentially allow for a simplified and inexpensive sensor design that is well suited to miniaturization. However, the achieved performance is still far from ideal. Most platforms are based on near-field enhancement of subwavelength resonators; however, the tuning band range of the resonance frequency in current platforms only covers a small spectral region. Furthermore, although plasmonic or all-dielectric resonators are used, the field enhancement () is constrained to (usually) less than and field compression is limited to a scale around (where is the free-space wavelength) 10, 11, 12, 13. This diminishes the sensitivity when looking at nanometre-scale samples at mid-IR wavelengths. In fact, most current sensor-on-chip approaches are based on the detection of characteristic molecular absorption 9, 6. Thus, they can be used for differentiating types of molecules; however, using these techniques it is challenging to obtain a quantitative characterization of properties of the analyte such as the refractive index. This is due to the low signal-to-noise ratio originating from the relatively small imaginary part of the refractive indices of molecules and the small volume of the analyte used in these approaches.
Within a Fabry-Pérot cavity, light reflects many times and forms a standing wave when resonance conditions are matched. The real part of the refractive index of the cavity materials determines the occurrence of the resonance, which is visible in the absorption of the system. Therefore, the visibility of the resonance can be used to measure the refractive index of the material in the cavity. Such a technique has been realized in bulk systems 14, 15. However, it is difficult to realise in a deeply subwavelength system, due to the limited field compression and/or the large loss. Graphene plasmons 16, 17, 18, 19 (GPs) can overcome this limitation by exploiting their extremely short wavelength, strong field confinement, and large field enhancement. Furthermore, GPs have a frequency range covering the mid- and far-IR and terahertz bands 20, and can be dynamically tuned by changing the Fermi energy via an external gate voltage 21, 22, 23. This strong tunability combined with a broad spectral reach make GPs highly promising for various vital applications such as modulators 20 and photodetectors 24, 25, 26, 27. In the last decade, many tunable sensors 28, 29, including mid-infrared sensors 30, 31, 32, 33, based on graphene have been proposed and investigated, indicating that graphene could offer a great opportunity to significantly improve the performance of devices used for refractometric detection in the infrared band.
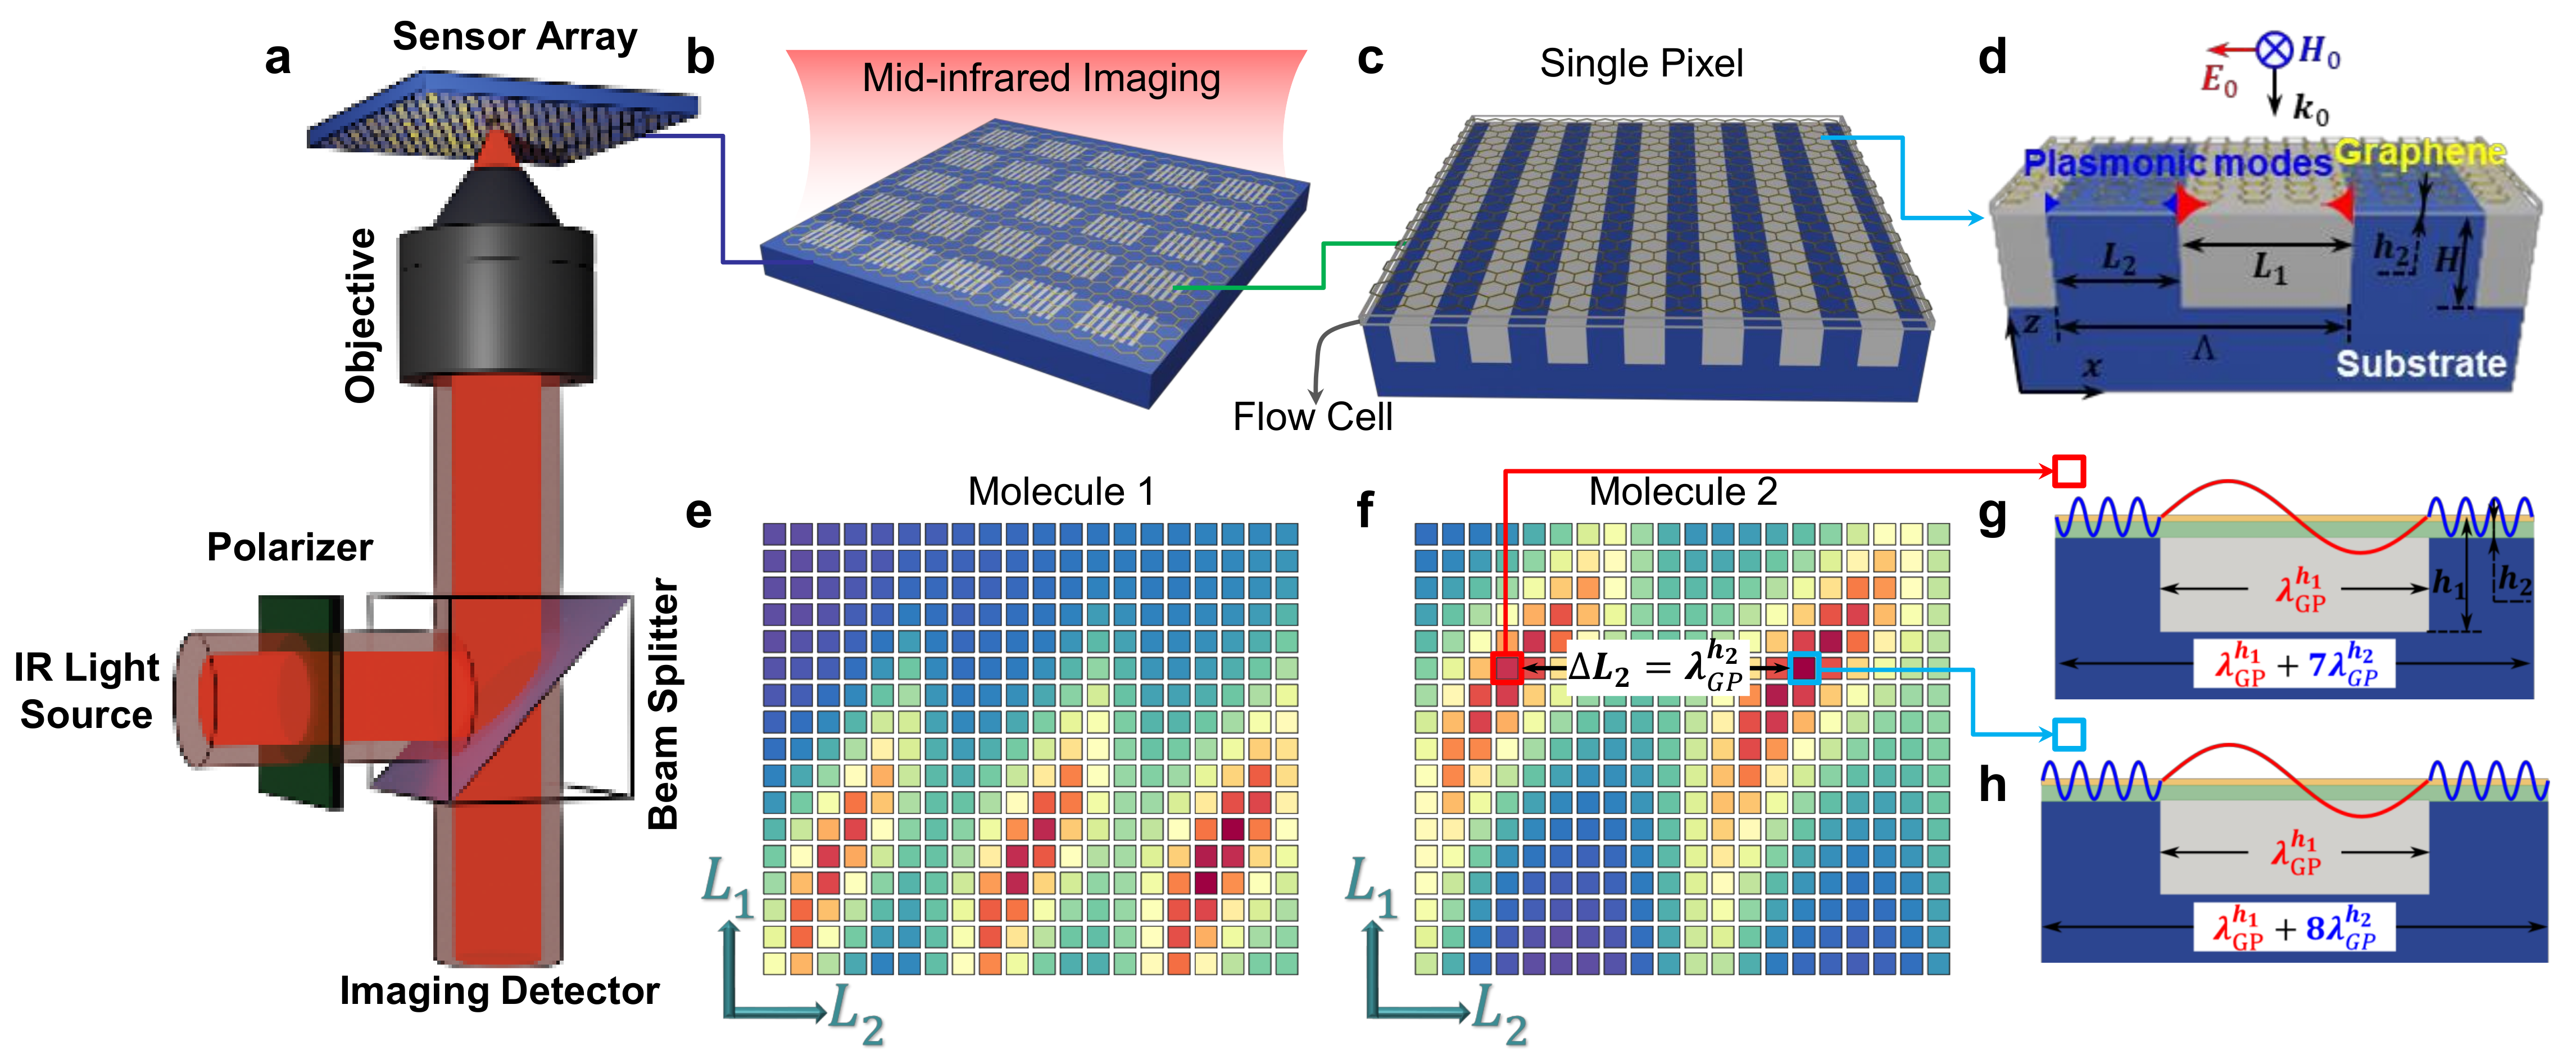
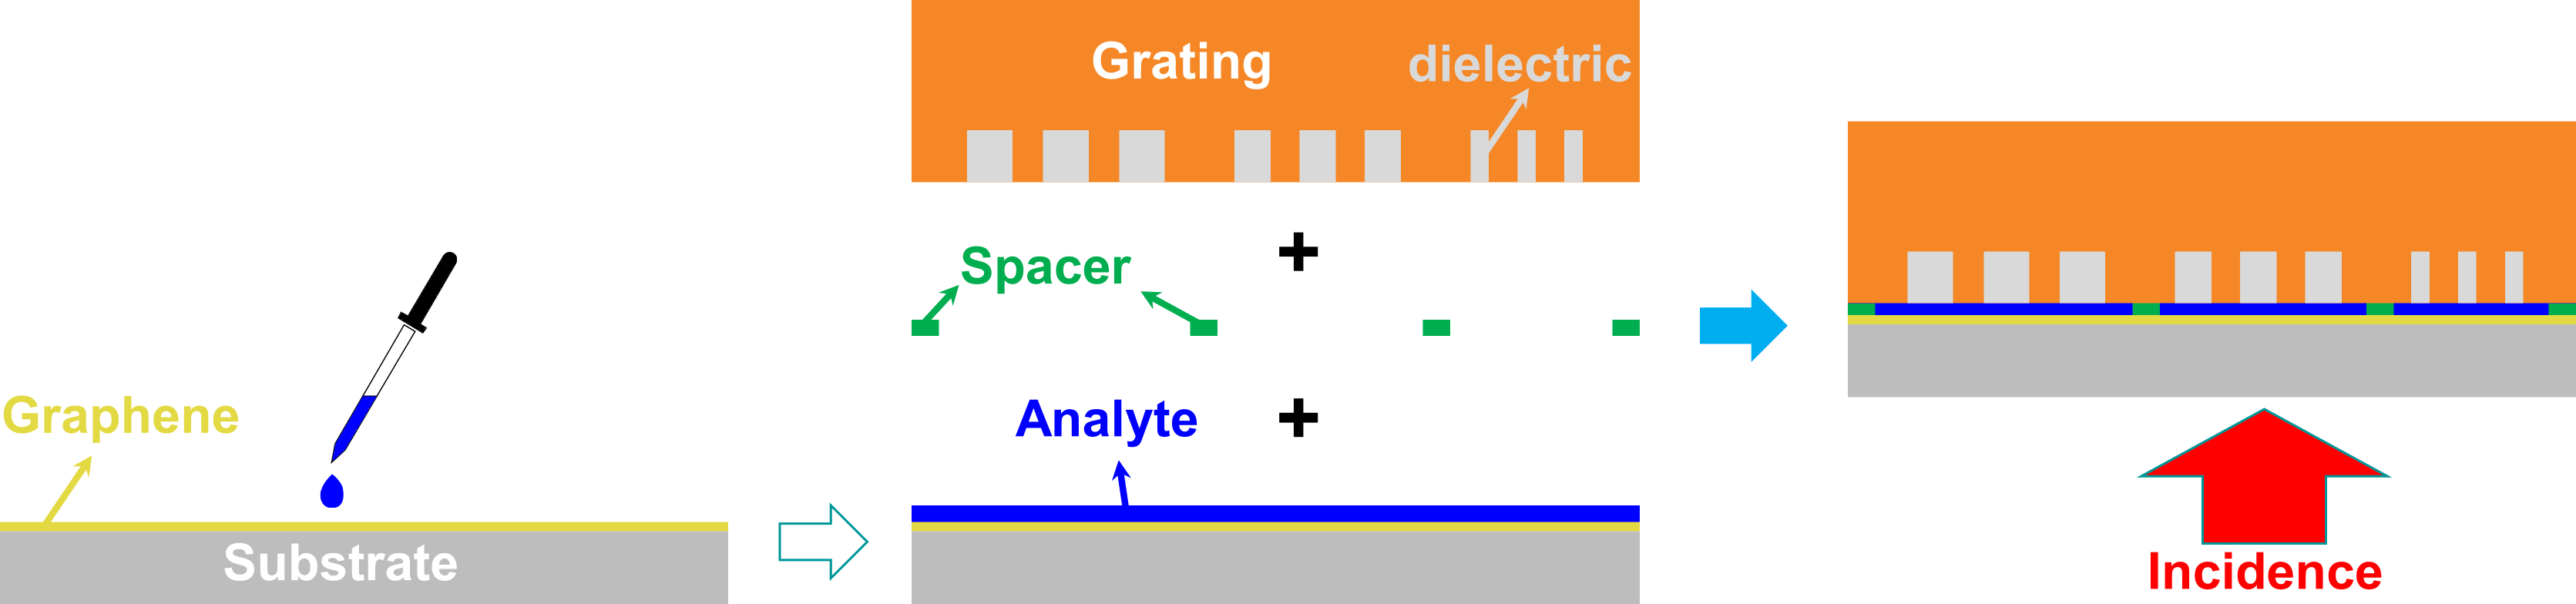
In this work, we report on a broadband tunable sensing technique based on suspended graphene plasmon cavities (Fig. 2) and demonstrate its capability for enhancing light-matter interactions, detecting the real part of the refractive index of the analyte, and characterising both types and concentrations of the various molecules. Our design exploits the standing wave properties of plasmonic resonance in suspended graphene cavities, which is driven by two horizontal Fabry-Pérot cavities and one vertical Fabry-Pérot cavity (Fig. 2c and d). In particular, we implement a two-dimensional array of suspended graphene plasmon cavities, which consist of a continuous graphene monolayer on top of a metallic grating with a gap. The GPs excited due to the scattering from the edges of the cavities are horizontally reflected back and forward in the gap and in the trench to form two horizontal cavities (Fig. 2g and h). The resonance is highly sensitive to the real part of the refractive index of the analyte and and we expect it to be visible in the reflection (absorption) pattern of the system due to the dissipation. Therefore, this configuration allows us to establish a unique relation between the real part of the refractive index of the analyte and the spatial absorption pattern (Fig. 1, and Fig. 2e and f). By translating these spatial absorption maps for different molecules into their refractive indices, we demonstrate that this technique is suitable for refractive index measurement, chemical identification, and concentration analysis. The proposed technique offers several advantages in molecular sensing over traditional nanophotonic systems. These include the ability to measure refractive indices, the ultra-broadband measurable spectral range, the tiny volume of the analyte required, and the deeply subwavelength dimensions of the elements.
2 Results
Plasmonic waves in graphene have attracted numerous investigations, because of their extreme field confinement. However, the efficient excitation of such plasmonic waves is still very challenging because there is a large momentum mismatch between the incident light and GPs. In this work the GPS are excited efficiently and the extremely high field enhancement and extraordinary compression of GPs occur simultaneously, thanks to the combination of a shallow cavity and a deep cavity in the same configuration: the shallow one is above the ridge with length and height , and the deep one is in the trench with length and height (Fig. 2d). In each cavity, the scattering by sharp ridges is used to generate a broad spectrum of wavevectors to compensate for the momentum mismatch. The forward and backward launched plasmonic waves constructively interfere in the cavities to form standing waves (Fig. 2g and h). Thus, when the cavity length satisfies the Fabry-Pérot equation (where represents the cavities in the trench and above the ridge, respectively), the GPs may be excited. A Fabry-Pérot equation reads
| (1) |
where is the phase shift, denotes the wavenumber of the GPs, and the integer denotes the resonance mode order. The cavity height-dependent dispersion relation of GPs derived in reference 34 is used in this work. The real part of the wavenumber of GPs determines the effective plasmon wavelength, , where denotes the cavity height and could be or in this work. To study the properties of GPs, the effective refractive index (ERI or modal) of the GP, (where is the wavenumber in free space), is introduced. Taking a phase shift of , we get , which we find to be a good approximation for our results. It should be noted that the phase shift is frequency-dependent. Fig. 2g and h show the sketches of the standing waves of GP resonances supported in this system. While those waves propagate in the graphene layer, the optical energy is dissipated thorugh Ohmic losses.
Based on the Fabry-Pérot equation and the dispersion relation of GPs, we can establish a theory for the fundamental building block of our sensor, as shown in Fig. 2c and d. The system is composed of a graphene monolayer deposited on a gold grating. We assume that there is a small gap (with a thickness of ) between the two. The gap and the trench are filled with the analyte and dielectric materials, respectively. Without loss of generality, we shall take the dielectric in the trench to be air. More realistic configurations will be discussed later. To investigate our system, we begin by calculating the absorption of the system as a function of trench length () and ridge length () for a fixed gap thickness nm and a fixed incident wavelength µm. According to the cavity height-dependent dispersion of GPs 34, the corresponding ERIs () are and with nm and µm, respectively. The absorption versus the trench length and the ridge length is shown in Fig. 3a. The strong absorption peaks are due to the excitation of the GPs, which can be confirmed by near-field plots in Fig. 3c. The component is antisymmetric as a consequence of the electromagnetic field boundary conditions and the symmetry of the system.
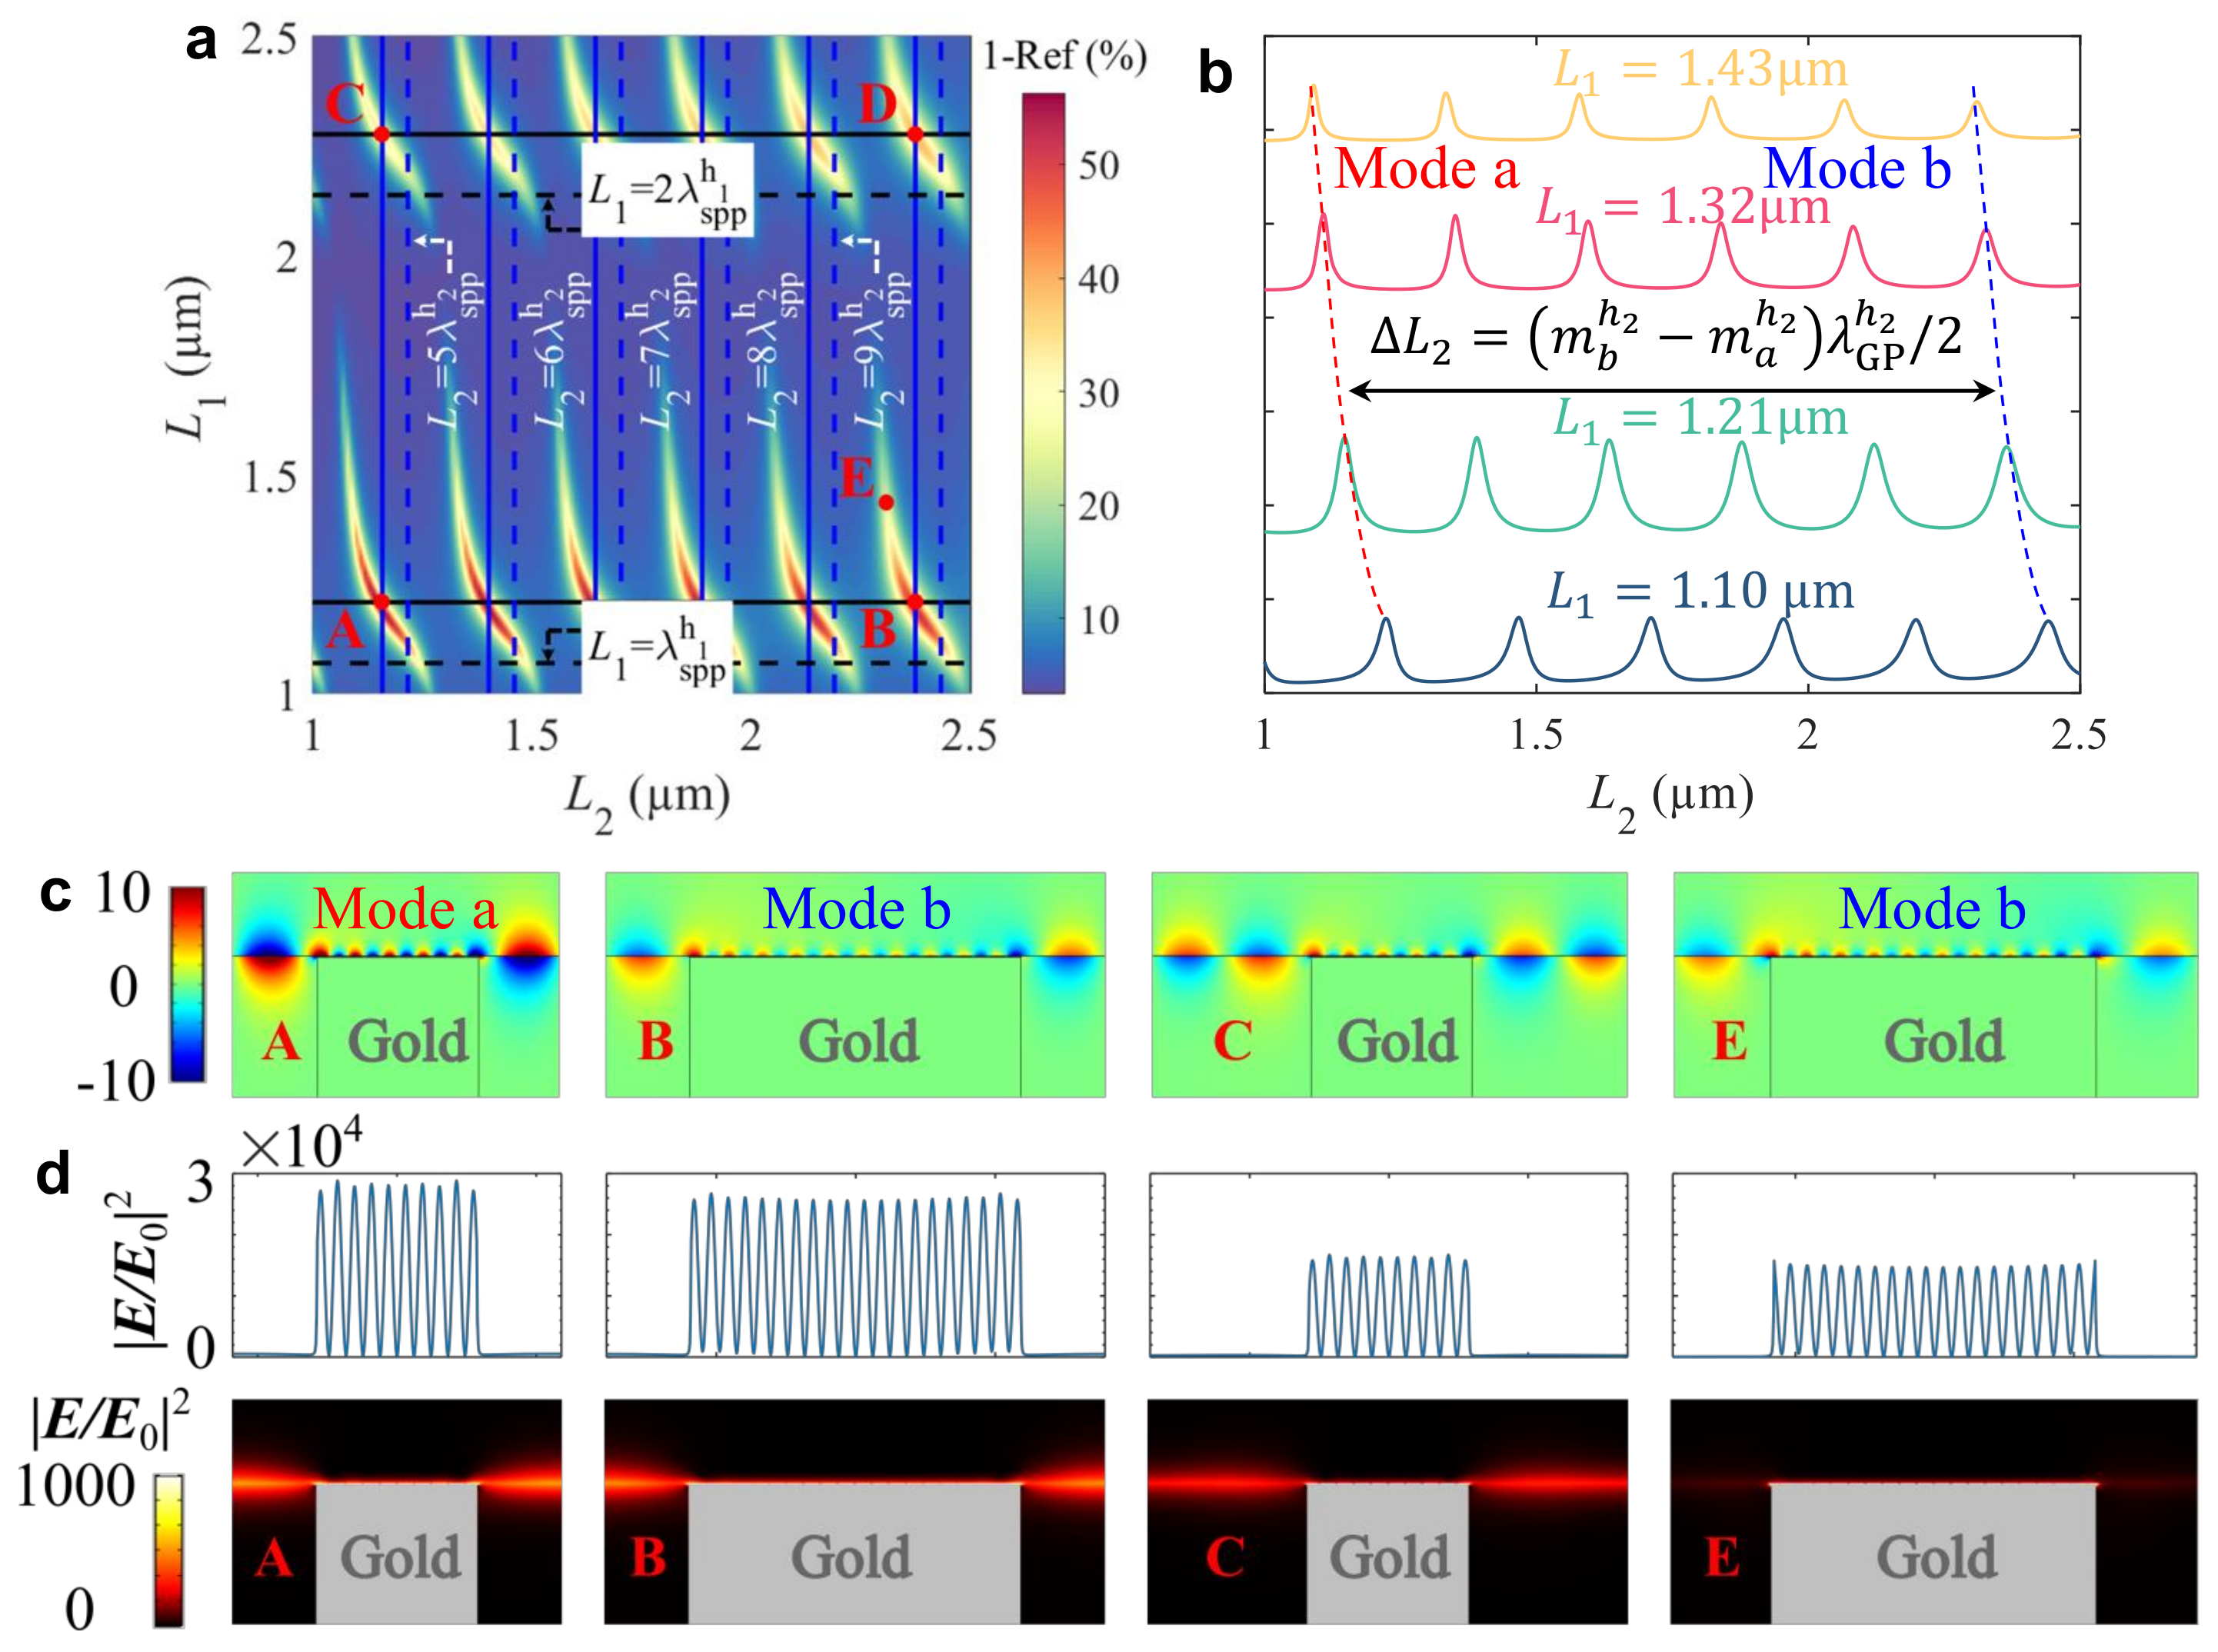
In earlier works 35, 34, the graphene monolayer and the grating were in physical contact with one another. However, due to the existence of the small gap in this study, there exists a very strong field in the parts of the graphene which are located above the trench of the gold grating. Consequently, there is very strong absorption in these locations. In Fig. 3a, the local maximum values of the graphene absorption correspond to the excitation of standing waves in both cavities. The predictions of those local peak positions are also given using the proposed theory, as the crossing points of the black dashed lines (for the cavity in the trench) and the blue dashed lines (for the cavity above the ridge) shown in Fig. 3a. Although the reasonable agreement between the predictions and the numerical results confirms the validity of the proposed model, there is an apparent shift between the predictions and the real local peak positions. This discrepancy is due to the coupling between the graphene plasmonic modes and the dipole mode of the trench, which can be observed clearly in the near-field plots shown in Fig. 3c. Therefore, we need to modify the Fabry-Pérot model by optimizing the phase shift to a value different from to compensate for the phase difference (which comes from the coupling between the GP mode and the trench dipole mode), as the figure caption shows. It should be noted that the phase shifts strongly depend on the gap thickness, the permittivities of the materials in the system, and the properties of the graphene layer. Using the modified phase shifts, we demonstrate excellent predictions as shown by the crossing points between the black solid lines (for the cavity in the trench) and the blue solid lines (the cavity is above the ridge) in Fig. 3a.
Another interesting feature is that strong absorption persists when the conditions for establishing standing waves in those two cavities are not fully satisfied individually. In addition, the shape of the strong absorption pattern in Fig. 3a looks like a "Sigmoid function" with a rotation of 90 degrees. This is because plasmonic modes in both cavities can still be excited, as long as their phases compensate each other at the edges. This is confirmed by the near-field plot in Fig. 3c for the point marked as point E in Fig. 3a. The absorption is strongest when the Fabry-Pérot resonance is fully satisfied in each cavity. It is worth noting that, if we choose several trench lengths, as shown in Fig. 3b, the difference in the position of the adjacent peaks equals the effective wavelength of GPs in the shallow cavities (), which can be used to retrieve the refractive index of the material in the gap.
One of the main appeals of such a suspended graphene cavity system is that the extremely high field intensity is extraordinarily compressed inside the gap above the ridge. Previous work 34 has shown that the electromagnetic field can be strongly trapped in a very shallow cavity (the compression factor is about ) and that high intensity enhancement () of graphene plasmon waves can be realized under certain conditions. However, these two phenomena did not appear in the same system. In this work, we achieve both the extremely high enhancement and the extraordinary compression in the same system, as shown in Fig. 3d. This is because: (i) the tiny gap above the ridge makes the extraordinary compression possible, and (ii) the optimized trench height could significantly enhance the conversion efficiency using a horizontal Fabry-Pérot cavity. Higher enhancement and even more extraordinary compression could be achieved by further optimizing the parameters of the system.
So far, we have confirmed that the resonance of the fundamental building block of the proposed sensor can be precisely predicted by the established theory based on the Fabry-Pérot cavities and the height-dependent dispersion relation of GPs. It was verified that the established theory remained valid when we changed the incident wavelength and the parameters of this configuration, such as the gap thickness, the cavity height, the Fermi energy of the graphene layer, and the materials filled in the gap and the trench. In the following, we will use the deeply subwavelength Fabry-Pérot cavities formed in the system for molecular refractive index measurement.
To illustrate the working principle of the refractive index measurement using our tiny Fabry-Pérot cavity, we first consider an ideal Fabry-Pérot cavity. Depending on the length of the cavity, a greater or smaller number of interference fringes inside the cavity are observed, which we usually call different orders of modes. According to the conventional Fabry-Pérot equation, the real part of the refractive index of the cavity core can be expressed as , where is the difference of the cavity length for the adjacent modes. In a bulk system, the resonances are observed in the transmission of the cavities. This is also the core concept of our technique, though there is still a distinct difference. In our system, it is the GPs which form deeply subwavelength Fabry-Pérot cavities. Consequently, in the above equation should be in our technique.
To observe the resonances, we propose measuring the reflection (or absorption) pattern of a two-dimensional array of suspended graphene plasmon cavities, with two variables of the configuration in the horizontal and vertical directions (Fig. 2). Although there are several choices for these two variables, we choose and here (Fig. 2e and f), respectively, due to the convenience of the fabrication. The key points of the proposed technique are to extract the effective wavelength of GPs from the measured absorption pattern based on the Fabry-Pérot equation and then recalculate the refractive index of the analyte using the dispersion relation. Although there are several different approaches to realize this technique, in this demonstration (Fig. 3b), the value of is extracted by calculating the separation of adjacent resonance peak positions via , where and are the orders of the modes excited, respectively, and is the difference of the trench lengths for those two modes. Although the absolute values of and are usually difficult to be measured in experiments, their difference would be easily obtained by counting the number of resonance peaks. It is also worth noting that, the "Sigmoid function" shape of the strong absorption pattern makes the resonances straightforward to find in the absorption pattern because even when the Fabry-Pérot resonance is not fully satisfied in each cavity, the modes can still be excited and thus be observable. The separation of the adjacent resonance peaks observed for different trench lengths is the same (Fig. 3b). Such a phenomenon is particularly attractive in the design of the sensor because it allows robust observation of the resonance modes and the adjacent resonance peaks in the captured image. The real part of the refractive index of the analyte could be numerically calculated based on the dispersion relation of GPs. When varying the incident wavelength, the refractive indices of the analyte at a certain spectral range can be obtained. Consequently, the type, even the concentration, of the molecule to be analyzed can be differentiated based on the retrieved refractive index.
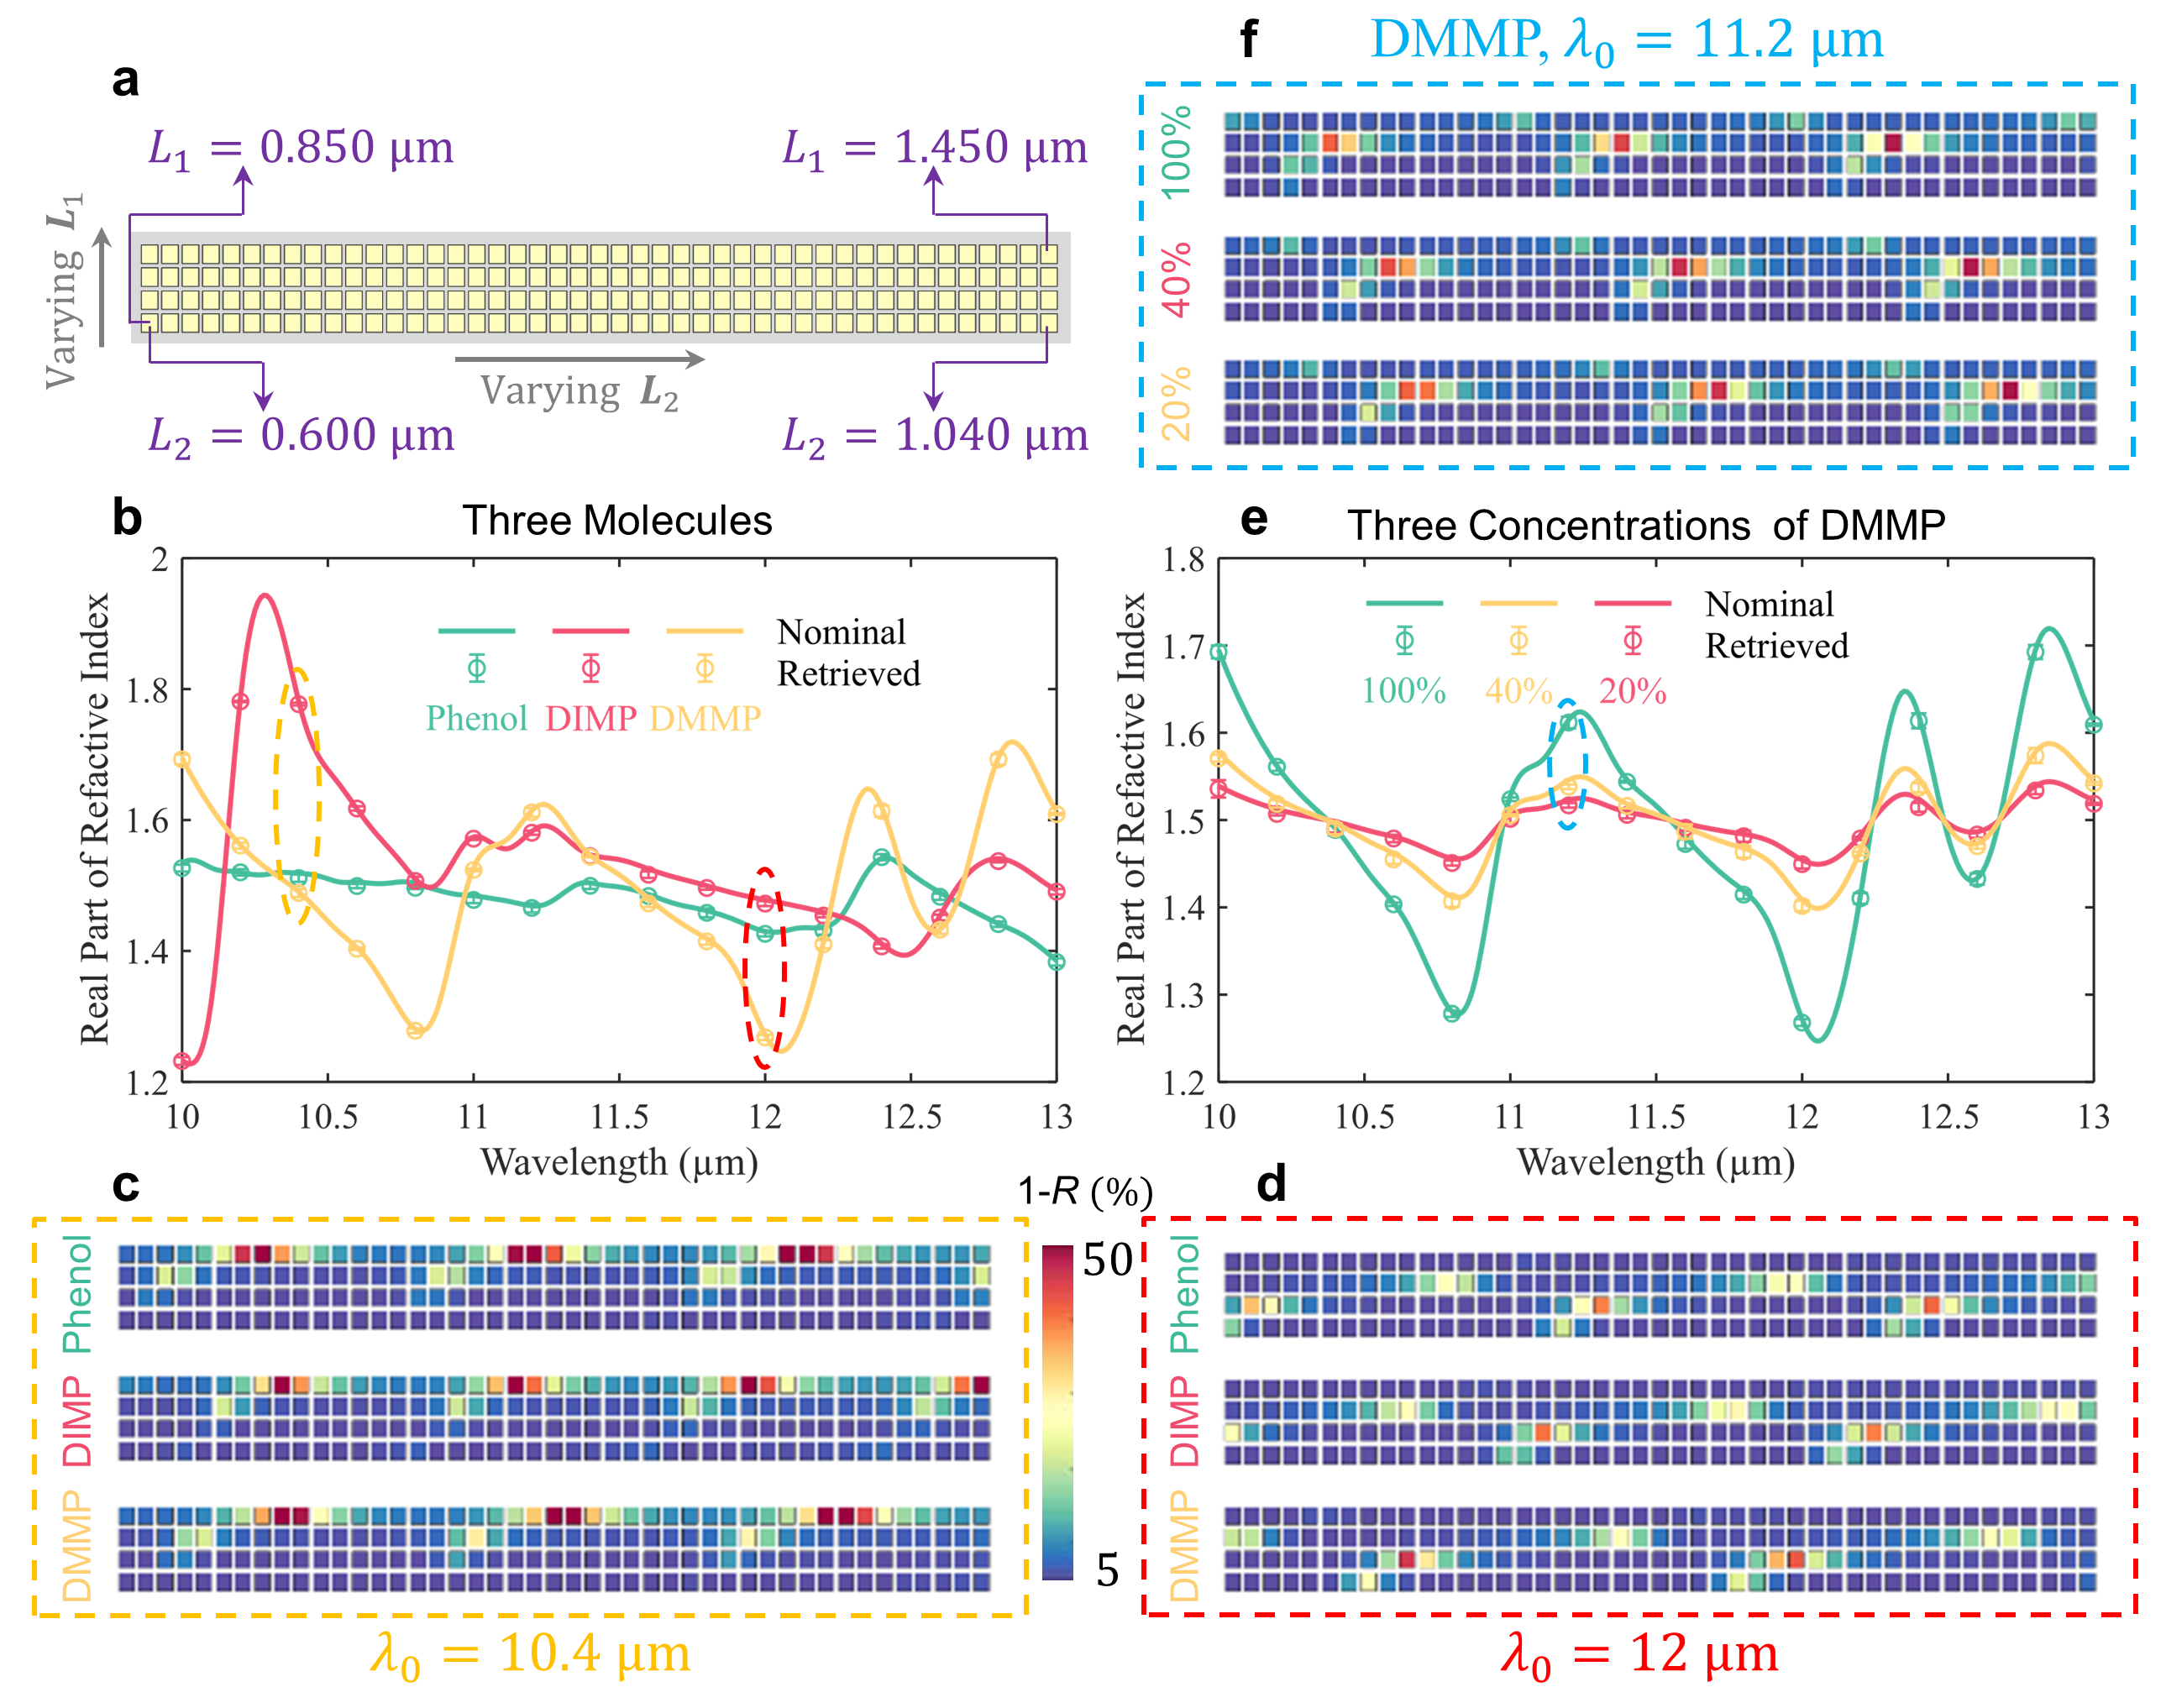
We demonstrate the performance of the proposed sensor by showing its capability of detecting the real part of the refractive index for three different molecules. Without any loss of generality, we select the incident wavelength ranging from µm to µm. As shown in Fig. 4, a two-dimensional array of suspended graphene plasmon cavities with varying trench lengths and ridge lengths are used. It should be further noted that a flow cell is placed in the gap over the ridge and on top of the trench to circulate liquid samples and to be reusable (Fig. 2c). The flow cell may also serve to support the graphene layer. The thickness of the flow cell is only nm, which means the volume of analyte required in the measurement is very small. The sensor is used to detect three different molecules, including phenol 36, diisopropyl methylphosphonate 37 (DIMP) and dimethyl methylphosphonate 37 (DMMP). It should be noted that, in the simulation, only the real part of the reflective index of the analyte is used as proof of concept. The refractive index here is used to trigger the resonance of the system, and the energy is mainly absorbed by the graphene layer, rather than the analyte itself. This is particularly suitable for the measurement of the refractive index with negligible imaginary part, in which case the approaches based on characteristic molecular absorption fingerprints would fail. As shown in Fig. 4b, the retrieved refractive indices of different molecules are in good agreement with the nominal ones, which confirms the validation of the proposed techniques.
Here, we also assess the capability of our sensor for concentration detection (Fig. 4e). For techniques based on the SEIRA concept, when the detected absorption fingerprints of different molecules overlap, it is difficult to differentiate the types of analytes. In addition, for traditional nanophotonic sensors, the signal-to-noise ratio is relatively low. For these reasons, it is very challenging to determine the concentration of molecules using current nanophotonic systems. However, our approach is based on sensing the real part of the refractive index of the analyte. Therefore, this technique would be more suitable for the determination of both the types and concentrations of various molecules. Fig. 4b and e demonstrate that the proposed technique is suitable for refractive index measurement, chemical identification, and concentration analysis. Moreover, the refractive index retrieval at a particular wavelength in this technique relies only on a single measurement, which is an advantage in sensing. For example, we can measure the concentration based on one measurement. Such single measurement detection is beneficial to high-throughput measurement.
Until now, the method for the molecule detection is based on the retrieved refractive indices calculated from the spatial absorption maps. In fact, the barcode-like spatial absorption maps of the two-dimensional array can be used directly for a molecule or concentration sensing, when a database is prepared based on the proposed theory. As shown in Fig. 4, different barcode-like spatial absorption maps for different wavelengths, molecules (Fig. 4c and d) or concentrations (Fig. 4f) are easily observed. Thus, this direct digital imaging technique offers the potential for chemical identification and concentration analysis through pattern recognition based on a library of multiple molecular barcode signatures.
Additionally, our scheme could provide an ultra-broad spectral measurement band, thanks to the super-broad band of GPs. When using resonance elements in traditional nanophotonic sensors, the resonance spectrum must be tuned to overlap with the molecular fingerprints. However, the tunability is very limited since it is achieved by varying the geometry or the optical properties (such as the permittivity) of the resonator. Hence, the spectral range measured by the traditional nanophotonic sensors is usually very narrow. In contrast, our technique is valid when the plasmons in the graphene layer can be excited efficiently, and thus its measurable spectral range could cover the mid- and far-IR and terahertz bands by carefully designing the two horizontal Fabry-Pérot cavities and the vertical Fabry-Pérot cavities. Finally, a more realistic configuration is suggested in Fig. 5.
Discussions
We have designed a digital sensor using suspended graphene plasmon cavities, which could provide extremely high field enhancement and extraordinary field compression. To do this, we have established the theory of the suspended graphene plasmon cavities. In the proposed theory, the Fabry-Pérot equation is used to predict the conditions for the GP resonance in two types of cavities (in the trench and above the ridge), and the dispersion relation of GPs in a general multilayer system is used to calculate the GP wavelength at different values of the cavity height. The excellent agreement between the predictions from this proposed theory and the numerical results confirms the validity of the proposed model. We also have achieved the extremely high field enhancement and extraordinary compression of GPs simultaneously, thanks to the combination of the shallow cavity and the deep cavity in the same configuration. Based on the excellent optical properties of such suspended graphene plasmon cavities, we have proposed the working principle of a digital sensor that allows the complex refractive index of an analyte to be retrieved. To demonstrate the performance of such a sensor, different molecules and different concentrations of DMMP have been (theoretically) detected. Given the capabilities of the refractive index measurement, the ultra-broadband measurable spectral range, the high sensitivity, and the small volume of the analyte required, the proposed sensor could serve as an ideal platform for applications such as chemical sensing, thermal imaging, heat scavenging, security and materials inspection, and molecule sensing 38, 39, 40. Furthermore, the tunability of the Fermi energy and geometric parameters of the cavities makes the design of this system extremely versatile. We also expect the investigated system using the combination of the shallow and deep cavities to open up numerous potential applications in photodetection, nonlinear optics, and integrated optics.
Materials and methods
Height-dependent dispersion relationship of GPs. In the previous study 34, we derived a dispersion relation of GPs in a general multilayer system, which can be described as a I-G-II-III system (where I, II and III represent metal or dielectric materials, and G represents a two-dimensional material). The corresponding optical properties are given by the relative permittivities where represent media I, II and III, respectively, when only non-magnetic materials are considered. To describe the property of the interface G, a complex surface conductivity is introduced. To obtain the dispersion relation of GPs in this system, we obtained the general TM solution. By considering the boundary conditions, the dispersion relation of the plasmon waves could be given by an implicit expression as follows 34
| (2) |
where
| (3) |
Here denotes the thickness of slab II, denote the respective wavevector perpendicular to the interfaces in the three materials, and is the angular frequency of the wavelength of interest.
Numerical simulation. Finite-element method simulations were carried out using COMSOL Multiphysics to obtain the absorption properties and field distributions of this system. In this paper, the incident source is TM polarized and incident from the air side, normal to the surface, and the substrate material is gold. To simplify the analysis, the substrate is infinitely thick below the grating to switch off the transmission channel, and the dielectric material in the gap and trench is set as air. The details of the properties of graphene and gold may be found in the references 34 and 41. To obtain a high absorption efficiency of the system, we have fixed the trench height () at µm, unless otherwise specified.
To show the capability of detecting the real part of refractive index, the analyte in the flow cell is assumed to have a real refractive index , which is given by the real part of the refractive index of the molecule. To stress the ability of detecting the concentration () of the analyte, we approximate the refractive index as for different concentrations, where is the real part of refractive index of DMMP 36.
3 Conflicts of Interest
There is no conflicts to declare.
X.X. is supported by Lee Family Scholars. S.M. acknowledges the Lee-Lucas Chair in Physics. V.G. acknowledges the Spanish Ministerio de Economia y Competitividad for financial support through the grant NANOTOPO (FIS2017-91413-EXP) and also the Ministerio de Ciencia, Innovación y Universidades through the grant MELODIA (PGC2018-095777-B-C21). The authors thank Dr. Daan M. Arroo and Ms. Marie Rider for comments on the manuscript.
References
- Chalmers and Griffiths 2002 Chalmers, J.; Griffiths, P. Handbook of Vibrational Spectroscopy, 5 volumes set.; Wiley, 2002
- Mizaikoff 2013 Mizaikoff, B. Waveguide-enhanced mid-infrared chem/bio sensors. Chemical Society Reviews 2013, 42, 8683–8699
- Gómez-Rivas et al. 2008 Gómez-Rivas, J.; Vecchi, G.; Giannini, V. Surface plasmon polariton-mediated enhancement of the emission of dye molecules on metallic gratings. New Journal of Physics 2008, 10, 105007
- Li et al. 2017 Li, R.; Wu, D.; Liu, Y.; Yu, L.; Yu, Z.; Ye, H. Infrared plasmonic refractive index sensor with ultra-high figure of merit based on the optimized all-metal grating. Nanoscale research letters 2017, 12, 1–6
- Leitis et al. 2019 Leitis, A.; Tittl, A.; Liu, M.; Lee, B. H.; Gu, M. B.; Kivshar, Y. S.; Altug, H. Angle-multiplexed all-dielectric metasurfaces for broadband molecular fingerprint retrieval. Science advances 2019, 5, eaaw2871
- Tittl et al. 2018 Tittl, A.; Leitis, A.; Liu, M.; Yesilkoy, F.; Choi, D.-Y.; Neshev, D. N.; Kivshar, Y. S.; Altug, H. Imaging-based molecular barcoding with pixelated dielectric metasurfaces. Science 2018, 360, 1105–1109
- Neubrech et al. 2017 Neubrech, F.; Huck, C.; Weber, K.; Pucci, A.; Giessen, H. Surface-enhanced infrared spectroscopy using resonant nanoantennas. Chemical reviews 2017, 117, 5110–5145
- Dong et al. 2017 Dong, L.; Yang, X.; Zhang, C.; Cerjan, B.; Zhou, L.; Tseng, M. L.; Zhang, Y.; Alabastri, A.; Nordlander, P.; Halas, N. J. Nanogapped Au antennas for ultrasensitive surface-enhanced infrared absorption spectroscopy. Nano letters 2017, 17, 5768–5774
- Singh 2016 Singh, P. SPR biosensors: Historical perspectives and current challenges. Sensors and actuators B: Chemical 2016, 229, 110–130
- Giannini et al. 2008 Giannini, V.; Zhang, Y.; Forcales, M.; Rivas, J. G. Long-range surface polaritons in ultra-thin films of silicon. Optics Express 2008, 16, 19674–85
- Giannini et al. 2011 Giannini, V.; Fernández-Domínguez, A. I.; Heck, S. C.; Maier, S. A. Plasmonic nanoantennas: fundamentals and their use in controlling the radiative properties of nanoemitters. Chemical Reviews 2011, 111, 3888–912
- Biagioni et al. 2012 Biagioni, P.; Huang, J.-S.; Hecht, B. Nanoantennas for visible and infrared radiation. Rep. Prog. Phys. 2012, 75, 024402
- Jahani and Jacob 2016 Jahani, S.; Jacob, Z. All-dielectric metamaterials. Nature Nanotechnology 2016, 11, 23–36
- Ran et al. 2008 Ran, Z. L.; Rao, Y. J.; Liu, W. J.; Liao, X.; Chiang, K. S. Laser-micromachined Fabry-Perot optical fiber tip sensor for high-resolution temperature-independent measurement of refractive index. Optics express 2008, 16, 2252–2263
- Ran et al. 2009 Ran, Z.; Rao, Y.; Zhang, J.; Liu, Z.; Xu, B. A miniature fiber-optic refractive-index sensor based on laser-machined Fabry–Perot interferometer tip. Journal of Lightwave Technology 2009, 27, 5426–5429
- Grigorenko et al. 2012 Grigorenko, A.; Polini, M.; Novoselov, K. Graphene plasmonics. Nature photonics 2012, 6, 749
- Garcia de Abajo 2014 Garcia de Abajo, F. J. Graphene plasmonics: challenges and opportunities. Acs Photonics 2014, 1, 135–152
- Rappoport et al. 2020 Rappoport, T. G.; Epstein, I.; Koppens, F. H.; Peres, N. M. Understanding the electromagnetic response of graphene/metallic nanostructures hybrids of different dimensionality. ACS Photonics 2020, 7, 2302–2308
- Wang et al. 2019 Wang, R.; Ren, X.-G.; Yan, Z.; Jiang, L.-J.; Wei, E.; Shan, G.-C. Graphene based functional devices: A short review. Frontiers of Physics 2019, 14, 13603
- Low and Avouris 2014 Low, T.; Avouris, P. Graphene plasmonics for terahertz to mid-infrared applications. ACS nano 2014, 8, 1086–1101
- Fei et al. 2012 Fei, Z.; Rodin, A.; Andreev, G. O.; Bao, W.; McLeod, A.; Wagner, M.; Zhang, L.; Zhao, Z.; Thiemens, M.; Dominguez, G., et al. Gate-tuning of graphene plasmons revealed by infrared nano-imaging. Nature 2012, 487, 82–85
- Chen et al. 2012 Chen, J.; Badioli, M.; Alonso-González, P.; Thongrattanasiri, S.; Huth, F.; Osmond, J.; Spasenović, M.; Centeno, A.; Pesquera, A.; Godignon, P., et al. Optical nano-imaging of gate-tunable graphene plasmons. Nature 2012, 487, 77–81
- Rufangura et al. 2020 Rufangura, P.; Folland, T. G.; Agrawal, A.; Caldwell, J. D.; Iacopi, F. Towards low-loss on-chip nanophotonics with coupled graphene and silicon carbide: a review. Journal of Physics: Materials 2020, 3, 032005
- Koppens et al. 2014 Koppens, F.; Mueller, T.; Avouris, P.; Ferrari, A.; Vitiello, M.; Polini, M. Photodetectors based on graphene, other two-dimensional materials and hybrid systems. Nature nanotechnology 2014, 9, 780–793
- Shautsova et al. 2018 Shautsova, V.; Sidiropoulos, T.; Xiao, X.; Güsken, N. A.; Black, N. C.; Gilbertson, A. M.; Giannini, V.; Maier, S. A.; Cohen, L. F.; Oulton, R. F. Plasmon induced thermoelectric effect in graphene. Nature communications 2018, 9, 5190
- Konstantatos 2018 Konstantatos, G. Current status and technological prospect of photodetectors based on two-dimensional materials. Nature communications 2018, 9, 1–3
- Nguyen-Huu et al. 2020 Nguyen-Huu, N.; Pištora, J.; Cada, M.; Nguyen-Thoi, T.; Ma, Y.; Yasumoto, K.; Rahman, B. A.; Wu, Q.; Ma, Y.; Ngo, Q. H., et al. Ultra-Wide Spectral Bandwidth and Enhanced Absorption in a Metallic Compound Grating Covered by Graphene Monolayer. IEEE Journal of Selected Topics in Quantum Electronics 2020, 27, 1–8
- Ogawa et al. 2020 Ogawa, S.; Fukushima, S.; Shimatani, M. Graphene Plasmonics in Sensor Applications: A Review. Sensors 2020, 20, 3563
- Epstein et al. 2020 Epstein, I.; Alcaraz, D.; Huang, Z.; Pusapati, V.-V.; Hugonin, J.-P.; Kumar, A.; Deputy, X. M.; Khodkov, T.; Rappoport, T. G.; Hong, J.-Y., et al. Far-field excitation of single graphene plasmon cavities with ultracompressed mode volumes. Science 2020, 368, 1219–1223
- Rodrigo et al. 2015 Rodrigo, D.; Limaj, O.; Janner, D.; Etezadi, D.; De Abajo, F. J. G.; Pruneri, V.; Altug, H. Mid-infrared plasmonic biosensing with graphene. Science 2015, 349, 165–168
- Xiao et al. 2016 Xiao, S.; Zhu, X.; Li, B.-H.; Mortensen, N. A. Graphene-plasmon polaritons: From fundamental properties to potential applications. Frontiers of Physics 2016, 11, 117801
- Wenger et al. 2017 Wenger, T.; Viola, G.; Kinaret, J.; Fogelström, M.; Tassin, P. High-sensitivity plasmonic refractive index sensing using graphene. 2D Materials 2017, 4, 025103
- Yi et al. 2019 Yi, Z.; Liang, C.; Chen, X.; Zhou, Z.; Tang, Y.; Ye, X.; Yi, Y.; Wang, J.; Wu, P. Dual-band plasmonic perfect absorber based on graphene metamaterials for refractive index sensing application. Micromachines 2019, 10, 443
- Xiao et al. 2018 Xiao, X.; Li, X.; Caldwell, J. D.; Maier, S. A.; Giannini, V. Theoretical analysis of graphene plasmon cavities. Applied Materials Today 2018, 12, 283–293
- Li et al. 2017 Li, K.; Fitzgerald, J. M.; Xiao, X.; Caldwell, J. D.; Zhang, C.; Maier, S. A.; Li, X.; Giannini, V. Graphene Plasmon Cavities Made with Silicon Carbide. ACS Omega 2017, 2, 3640–3646
- Francescato et al. 2014 Francescato, Y.; Giannini, V.; Yang, J.; Huang, M.; Maier, S. A. Graphene sandwiches as a platform for broadband molecular spectroscopy. ACS Photonics 2014, 1, 437–443
- Querry 1987 Querry, M. R. Optical constants of minerals and other materials from the millimeter to the ultraviolet; Chemical Research, Development & Engineering Center, US Army Armament âŠ, 1987
- Germain and Knapp 2009 Germain, M. E.; Knapp, M. J. Optical explosives detection: from color changes to fluorescence turn-on. Chemical Society Reviews 2009, 38, 2543–2555
- Long et al. 2013 Long, F.; Zhu, A.; Shi, H. Recent advances in optical biosensors for environmental monitoring and early warning. Sensors 2013, 13, 13928–13948
- Fan et al. 2008 Fan, X.; White, I. M.; Shopova, S. I.; Zhu, H.; Suter, J. D.; Sun, Y. Sensitive optical biosensors for unlabeled targets: A review. analytica chimica acta 2008, 620, 8–26
- Olmon et al. 2012 Olmon, R. L.; Slovick, B.; Johnson, T. W.; Shelton, D.; Oh, S.-H.; Boreman, G. D.; Raschke, M. B. Optical dielectric function of gold. Physical Review B 2012, 86, 235147