:
\theoremsep
\jmlrvolumeML4H Extended Abstract Arxiv Index
\jmlryear2020
\jmlrsubmitted2020
\jmlrpublished
\jmlrworkshopMachine Learning for Health (ML4H) 2020
A stability-driven protocol for drug response interpretable prediction (staDRIP)
Abstract
Modern cancer -omics and pharmacological data hold great promise in precision cancer medicine for developing individualized patient treatments. However, high heterogeneity and noise in such data pose challenges for predicting the response of cancer cell lines to therapeutic drugs accurately. As a result, arbitrary human judgment calls are rampant throughout the predictive modeling pipeline. In this work, we develop a transparent stability-driven pipeline for drug response interpretable predictions, or staDRIP, which builds upon the PCS framework for veridical data science [40] and mitigates the impact of human judgment calls. Here we use the PCS framework for the first time in cancer research to extract proteins and genes that are important in predicting the drug responses and stable across appropriate data and model perturbations. Out of the 24 most stable proteins we identified using data from the Cancer Cell Line Encyclopedia (CCLE), 18 have been associated with the drug response or identified as a known or possible drug target in previous literature, demonstrating the utility of our stability-driven pipeline for knowledge discovery in cancer drug response prediction modeling.
1 Introduction
A critical goal in precision medicine oncology revolves around predicting a patient’s response to therapeutic drugs given the patient’s unique molecular profile [30, 19]. Accurate personalized drug response predictions can immediately shed light on therapies that are likely to be ineffective or toxic and aid clinicians in deciding the most promising treatment for their patients [2]. Moreover, interpreting these drug response prediction models can help to improve recommendations of compounds and target genes to prioritize in future preclinical research [8].
While several community-wide, public efforts [4, 10] and many other works have made progress towards improving the predictive accuracy of drug response predictions, identifying the important disease signatures (i.e., proteins, genes, and other biomarkers) that drive the drug response prediction models has received less attention. To date, previous works have typically focused on feature selection within one specific model such as elastic nets [18, 4] and random forest [29]. However, because molecular profiling data is often heterogeneous, noisy, and high-dimensional, these results are highly sensitive to modeling decisions made by humans including the type of model, the amount of training data, and the choice of algorithm.
In this work, we focus on this goal of detecting stable, interpretable, and predictive -omic signatures that drive a cell line’s drug response. To overcome the aforementioned challenges, we develop a transparent stability-driven pipeline for drug response interpretable prediction called staDRIP that is rooted in the PCS framework for veridical data science [40]. At its core, the PCS framework builds its foundation on three principles: predictability as a reality check, computability as an important consideration in algorithmic design and data collection, and stability as an overarching principle and minimal requirement for scientific knowledge extraction. These principles were motivated by extensive interdisciplinary research such as [36], which analyzed the gap-gene network of Drosophila, and [5], which discovered stable transcription factor interactions in Drosophila embryos. Since its conception, the PCS framework has further demonstrated a strong track record of driving many scientific discoveries including novel gene-gene interactions for the red-hair phenotype [6] and clinically-interpretable subgroups in a randomized drug trial [12].
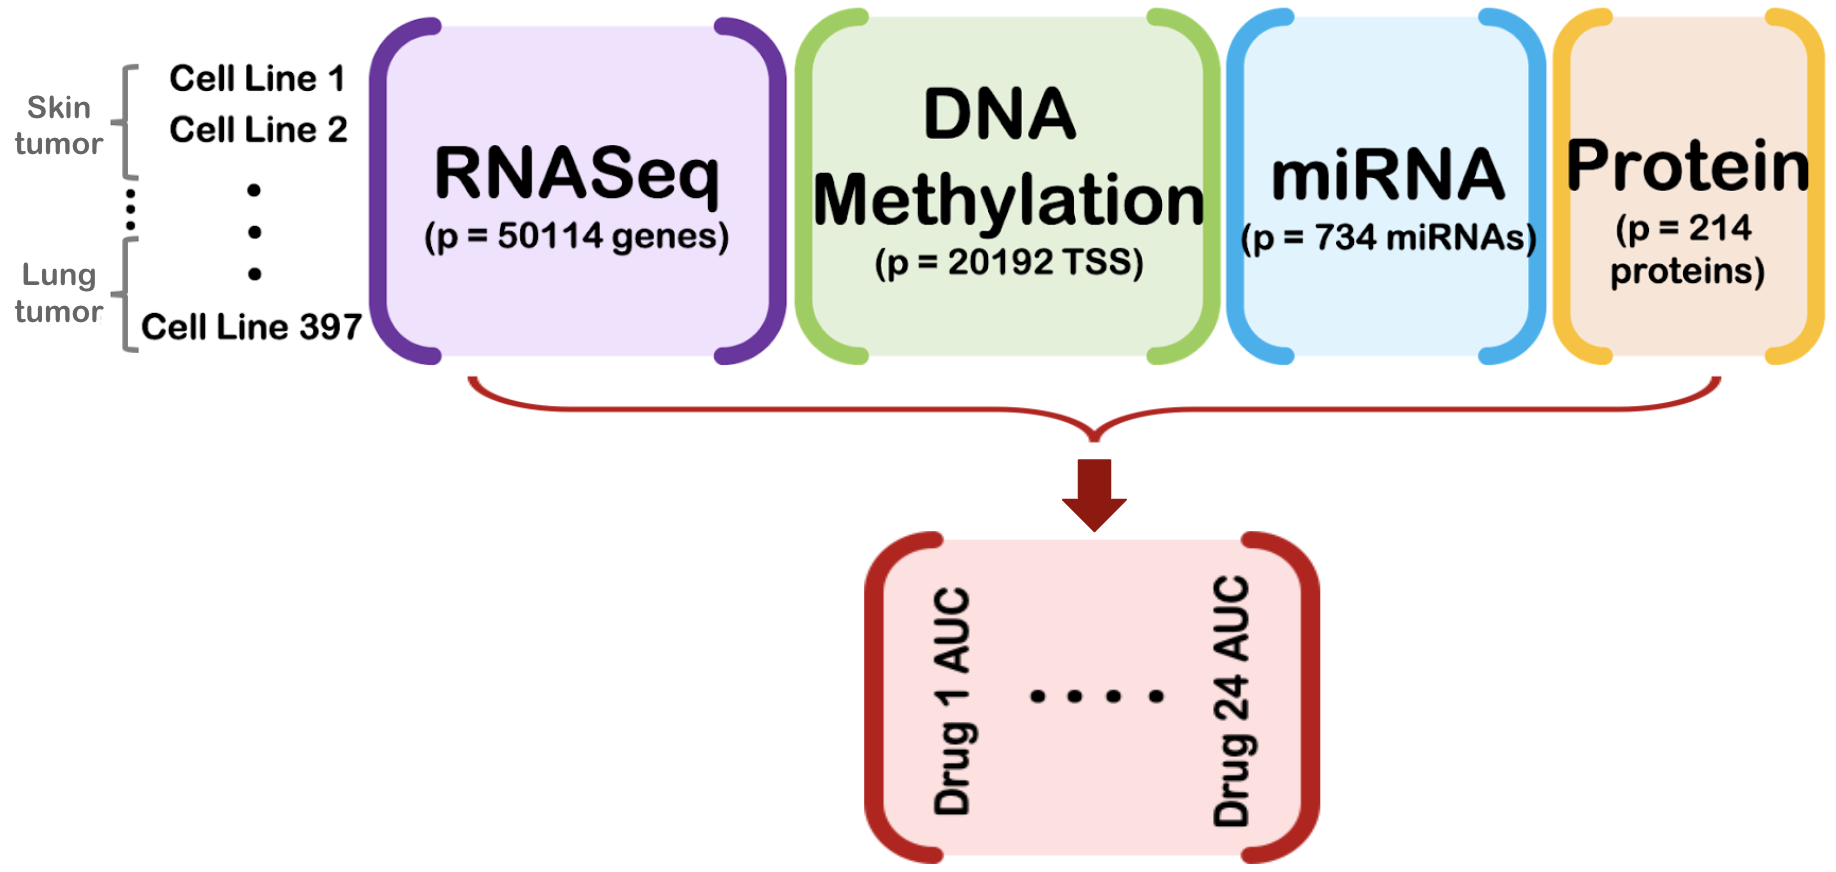
Here, using integrative -omics and drug response data from the Cancer Cell Line Encyclopedia (CCLE)111The CCLE is one of the most comprehensive public databases for developing detailed genetic and pharmacologic characterizations of human cancer cell lines. After preprocessing (see Appendix A), we arrive at a panel of 370 human cancer cell lines that have both high-throughput molecular profiling of RNASeq gene expression (5000 genes), microRNA expression (734 miRNAs), DNA methylation (4000 transcription start sites), and protein expression (214 proteins) as well as pharmacological data for 24 anticancer drugs. [4], we employ the PCS framework to develop staDRIP and provide extensive documentation of our modeling choices to arrive at stable biological discoveries of proteins and genes that are predictive of cancer drug responses. Unlike previous works whose results depend heavily on human decisions, staDRIP finds predictive -omic features that are stable across various models and data perturbations, thus mitigating the impact of human judgment calls. We further show that 18 of the top 24 -omic features identified by staDRIP have been previously implicated in the scientific literature, and in doing so, hint at novel candidates for future preclinical research.
2 Results
2.1 Prediction Accuracy
Building on the PCS framework, staDRIP first uses predictive accuracy as a reality check to filter out models that are poor fits for the observed data before turning to our primary goal of identifying important biomarkers for drug response prediction. Specifically, we define drug response as the area under the fitted dose-response curve of growth inhibition (see Appendix A for details). For each of the available 24 anticancer drugs, we divide the data into a 50-25-25% training-validation-test split and use the training data to fit (1) an elastic net tuned with cross-validation (CV), which has been widely used and advocated by previous studies [4, 18], (2) Lasso tuned with CV, (3) Lasso tuned with ESCV, an alternative CV metric that incorporates stability to yield more stable estimation properties with minimal loss of accuracy [21], (4) Gaussian kernel ridge regression, and (5) random forest to predict the drug response given the miRNA, RNASeq, methylation, and protein expression profiles separately. We also fit several data integration methods including concatenated versions of the aforementioned methods, the recently proposed X-shaped Variational Autoencoder (X-VAE) [32], and the winner of the DREAM 7 challenge,222The DREAM 7 challenge was a public competition where teams were tasked to integrate multiple –omics measurements and predict drug sensitivity in cancer cell lines. the Bayesian multi-task multiple kernel learning method (BMTMKL) [10].
For each of these fits, we report in Table 2 in Appendix B.3 the average validation accuracy across all 24 drugs as measured by the value and the WPC-index, a weighted probabilistic concordance index, which has been used in previous studies and measures how well the predicted rankings agree with the true responses [10]. From Table 2, we see that kernel ridge regression trained only on the RNASeq data yields the best predictive performance. However, considering that our primary goal is not purely prediction, the differences between model prediction accuracies shown in Table 2 are relatively small from a practical viewpoint. In our inferential procedure discussed next, we will see that leveraging the stability across these methods with similar predictive accuracies is key to our staDRIP pipeline for identifying genes and proteins that are stable predictive features underlying the drug response models.
Nonetheless, for completeness, we report the test accuracy from the best model, the RNASeq-based kernel ridge regression, to have an (SD) of 0.204 ( 0.038) and WPC-index of 0.620 ( 0.0075) across the 24 drugs. For brevity, we leave more detailed individual drug-level prediction results to the Appendix.
2.2 Identifying predictive -omic features with PCS inference
| Drug | Protein | Supporting Literature | Drug | Protein | Supporting Literature |
| 17-AAG | Bax | He et al. [16] | PD-0332991 | Bcl-2 | Chen and Pan [9] |
| AEW541 | Akt | Attias-Geva et al. [1] | PF2341066 | c-Met | Camidge et al. [7] |
| AZD0530 | p38 | Yang et al. [38] | PHA-665752 | MEK1 | – |
| AZD6244 | PI3K-p85 | Balmanno et al. [3] | PLX4720 | MEK1 | Emery et al. [13] |
| Erlotinib | EGFR | McDermott et al. [24] | Paclitaxel | Src | Le and Bast [20] |
| Irinotecan | MDMX_MDM4 | Ling et al. [22] | Panobinostat | VEGFR2 | Strickler et al. [33] |
| L-685458 | YAP | – | RAF265 | PI3K-p85 | Mordant et al. [25] |
| LBW242 | ASNS | – | Sorafenib | Bcl-2 | Tutusaus et al. [34] |
| Lapatinib | HER2 | Esteva et al. [14] | TAE684 | PTEN | – |
| Nilotinib | STAT5 | Warsch et al. [35] | TKI258 | CD49b | – |
| Nutlin.3 | Bcl-2 | Drakos et al. [11] | Topotecan | – | – |
| PD-0325901 | MEK1 | Henderson et al. [17] | ZD-6474 | c-Kit | Yang et al. [39] |
Beyond predictability, the PCS framework emphasizes stability throughout the data science life cycle so as to reduce reliance on particular human judgment calls. Accordingly, we leverage and quantify the stability of important features under numerous data and model perturbations in staDRIP as follows: for each of the 24 drugs separately,
-
1.
Use predictability as reality check: select a set of models with high predictive accuracy across a variety of metrics on the validation data.
-
2.
Compute stability of predictive features across data perturbations: for each model , refit the model to bootstrap replicates of the data, and compute the stability score of each feature as the proportion of bootstrap samples where the feature is selected (details in Appendix C.1). Let denote the subset of features with high stability scores (e.g., top 10).
-
3.
Select predictive features that are stable across model perturbations: take the intersection as the stable predictive -omic features across data and model perturbations.
In our work, we are primarily interested in identifying proteins and genes that are predictive of drug responses as many drugs are directly related to known proteins and genes. Hence, considering the five models trained on the RNAseq and protein data separately, we take . Note that while kernel ridge has the highest accuracy, it is omitted from since there is no straightforward, computationally efficient method to select features from kernel ridge to the best of our knowledge. We also omit the Lasso from as it generally has the worst predictive accuracy. For each remaining model in , we then take to be the 10 features with the highest stability scores and list those genes and proteins in the top 10 most stable features across all three models in Table 5 in the Appendix.
In Table 1, we provide our main evidence for the utility of staDRIP, listing the single most stable protein for each drug along with independent publications that support these findings. Specifically, of the 24 proteins identified as most stable by staDRIP, 18 have been associated with the drug sensitivity or identified as a known or possible drug target in prior preclinical studies. See Appendix C.2 for details of this literature evidence.
Now in contrast to staDRIP, which finds stable predictive features across models with similar predictive accuracies, previous state-of-the-art methods [4, 18] use only an elastic net to identify predictive -omics features of drug responses. To compare staDRIP to this elastic net approach, we extract the proteins with the highest stability score for each drug when taking . Repeating the same literature search procedure as we did for the proteins identified by staDRIP, we found only 14 of the 24 proteins identified by the elastic net are known from previous clinical studies (see Table 6 in the Appendix). Detailed comparisons of the results of our method, staDRIP, and that of the elastic net can be found in Appendix C.2.
3 Conclusion
Rooted by the PCS framework, we emphasize the importance of predictability, (computability), and stability as minimum requirements for extracting scientific knowledge throughout the staDRIP pipeline. We show that, guided by good prediction performance, incorporating a number of stability checks and extracting the stable parts of top-performing models can help to avoid the poor generalization exhibited by existing methods and can successfully identify candidate therapeutic targets for future preclinical research. We also acknowledge that while many stability considerations are built into staDRIP, there are inevitably human judgment calls that still impact our analysis. For example, we make a number of judgement calls in the data preprocessing stage, which we detail in Appendix A. Additionally, many other reasonable models such as ridge regression and gradient boosting could be considered in the staDRIP pipeline. We thus provide transparent and extensive documentation here to justify these decisions using domain knowledge when possible.
4 Acknowledgments
The authors would like to thank Karl Kumbier for his helpful comments. TT acknowledges support from the NSF Graduate Research Fellowship Program DGE-1752814. BY acknowledges the support from ARO Army Research Office grant W911NF-17-1-0005, Office of Naval Research Grant N00014-17-1-2176, the Center for Science of Information (CSoI), a US NSF Science and Technology Center, under grant agreement CCF-0939370, UCSF fund N7251, National Science Foundation grants NSF-DMS-1613002, 1953191, and IIS 1741340. BY is a Chan Zuckerberg Biohub investigator. This work was in part supported by the Mayo Clinic Center for Individualized Medicine.
References
- Attias-Geva et al. [2011] Zohar Attias-Geva, Itay Bentov, Ami Fishman, Haim Werner, and Ilan Bruchim. Insulin-like growth factor-i receptor inhibition by specific tyrosine kinase inhibitor nvp-aew541 in endometrioid and serous papillary endometrial cancer cell lines. Gynecologic oncology, 121(2):383–389, 2011.
- Azuaje [2016] Francisco Azuaje. Computational models for predicting drug responses in cancer research. Briefings in bioinformatics, 18(5):820–829, 2016.
- Balmanno et al. [2009] Kathryn Balmanno, Simon D Chell, Annette S Gillings, Shaista Hayat, and Simon J Cook. Intrinsic resistance to the mek1/2 inhibitor azd6244 (arry-142886) is associated with weak erk1/2 signalling and/or strong pi3k signalling in colorectal cancer cell lines. International journal of cancer, 125(10):2332–2341, 2009.
- Barretina et al. [2012] Jordi Barretina, Giordano Caponigro, Nicolas Stransky, Kavitha Venkatesan, Adam A Margolin, Sungjoon Kim, Christopher J Wilson, Joseph Lehár, Gregory V Kryukov, Dmitriy Sonkin, et al. The cancer cell line encyclopedia enables predictive modelling of anticancer drug sensitivity. Nature, 483(7391):603, 2012.
- Basu et al. [2018] Sumanta Basu, Karl Kumbier, James B Brown, and Bin Yu. Iterative random forests to discover predictive and stable high-order interactions. Proceedings of the National Academy of Sciences, 115(8):1943–1948, 2018.
- Behr et al. [2020] Merle Behr, Karl Kumbier, Aldo Cordova-Palomera, Matthew Aguirre, Euan Ashley, Rima Arnaout, James B Brown, James Priest, and Bin Yu. Learning epistatic polygenic phenotypes with boolean interactions. 2020.
- Camidge et al. [2014] D Ross Camidge, Sai-Hong Ignatius Ou, Geoffrey Shapiro, Gregory Alan Otterson, Liza Cosca Villaruz, Miguel Angel Villalona-Calero, A John Iafrate, Marileila Varella-Garcia, Sanja Dacic, Stephanie Cardarella, et al. Efficacy and safety of crizotinib in patients with advanced c-met-amplified non-small cell lung cancer (nsclc)., 2014.
- Caponigro and Sellers [2011] Giordano Caponigro and William R Sellers. Advances in the preclinical testing of cancer therapeutic hypotheses. Nature reviews Drug discovery, 10(3):179, 2011.
- Chen and Pan [2017] Liang Chen and Jingxuan Pan. Dual cyclin-dependent kinase 4/6 inhibition by pd-0332991 induces apoptosis and senescence in oesophageal squamous cell carcinoma cells. British journal of pharmacology, 174(15):2427–2443, 2017.
- Costello et al. [2014] James C Costello, Laura M Heiser, Elisabeth Georgii, Mehmet Gönen, Michael P Menden, Nicholas J Wang, Mukesh Bansal, Petteri Hintsanen, Suleiman A Khan, John-Patrick Mpindi, et al. A community effort to assess and improve drug sensitivity prediction algorithms. Nature biotechnology, 32(12):1202, 2014.
- Drakos et al. [2011] E Drakos, Rajesh R Singh, GZ Rassidakis, E Schlette, J Li, Francois-Xavier Claret, RJ Ford, Francisco Vega, and L Jeffrey Medeiros. Activation of the p53 pathway by the mdm2 inhibitor nutlin-3a overcomes bcl2 overexpression in a preclinical model of diffuse large b-cell lymphoma associated with t (14; 18)(q32; q21). Leukemia, 25(5):856–867, 2011.
- Dwivedi et al. [2020] Raaz Dwivedi, Yan Shuo Tan, Briton Park, Mian Wei, Kevin Horgan, David Madigan, and Bin Yu. Stable discovery of interpretable subgroups via calibration in causal studies. arXiv preprint arXiv:2008.10109, 2020.
- Emery et al. [2009] Caroline M Emery, Krishna G Vijayendran, Marie C Zipser, Allison M Sawyer, Lili Niu, Jessica J Kim, Charles Hatton, Rajiv Chopra, Patrick A Oberholzer, Maria B Karpova, et al. Mek1 mutations confer resistance to mek and b-raf inhibition. Proceedings of the National Academy of Sciences, 106(48):20411–20416, 2009.
- Esteva et al. [2010] Francisco J Esteva, Dihua Yu, Mien-Chie Hung, and Gabriel N Hortobagyi. Molecular predictors of response to trastuzumab and lapatinib in breast cancer. Nature reviews Clinical oncology, 7(2):98, 2010.
- Güvenç Paltun et al. [2019] Betül Güvenç Paltun, Hiroshi Mamitsuka, and Samuel Kaski. Improving drug response prediction by integrating multiple data sources: matrix factorization, kernel and network-based approaches. Briefings in Bioinformatics, 2019.
- He et al. [2013] Kan He, Xingnan Zheng, Lin Zhang, and Jian Yu. Hsp90 inhibitors promote p53-dependent apoptosis through puma and bax. Molecular cancer therapeutics, 12(11):2559–2568, 2013.
- Henderson et al. [2010] Ying C Henderson, Yunyun Chen, Mitchell J Frederick, Stephen Y Lai, and Gary L Clayman. Mek inhibitor pd0325901 significantly reduces the growth of papillary thyroid carcinoma cells in vitro and in vivo. Molecular cancer therapeutics, 9(7):1968–1976, 2010.
- Jang et al. [2014] In Sock Jang, Elias Chaibub Neto, Justin Guinney, Stephen H Friend, and Adam A Margolin. Systematic assessment of analytical methods for drug sensitivity prediction from cancer cell line data. In Biocomputing 2014, pages 63–74. World Scientific, 2014.
- Kohane [2015] Isaac S Kohane. Ten things we have to do to achieve precision medicine. Science, 349(6243):37–38, 2015.
- Le and Bast [2011] Xiao-Feng Le and Robert C Bast, Jr. Src family kinases and paclitaxel sensitivity. Cancer biology & therapy, 12(4):260–269, 2011.
- Lim and Yu [2016] Chinghway Lim and Bin Yu. Estimation stability with cross-validation (escv). Journal of Computational and Graphical Statistics, 25(2):464–492, 2016.
- Ling et al. [2014] Xiang Ling, Chao Xu, Chuandong Fan, Kai Zhong, Fengzhi Li, and Xinjiang Wang. Fl118 induces p53-dependent senescence in colorectal cancer cells by promoting degradation of mdmx. Cancer research, 74(24):7487–7497, 2014.
- Liu et al. [2011] Yuqing Liu, Zhuo Wang, Shu Qin Kwong, Eric Lik Hang Lui, Scott L Friedman, Fu Rong Li, Reni Wing Chi Lam, Guo Chao Zhang, Hui Zhang, and Tao Ye. Inhibition of pdgf, tgf-, and abl signaling and reduction of liver fibrosis by the small molecule bcr-abl tyrosine kinase antagonist nilotinib. Journal of hepatology, 55(3):612–625, 2011.
- McDermott et al. [2007] Ultan McDermott, Sreenath V Sharma, Lori Dowell, Patricia Greninger, Clara Montagut, Jennifer Lamb, Heidi Archibald, Raul Raudales, Angela Tam, Diana Lee, et al. Identification of genotype-correlated sensitivity to selective kinase inhibitors by using high-throughput tumor cell line profiling. Proceedings of the National Academy of Sciences, 104(50):19936–19941, 2007.
- Mordant et al. [2010] Pierre Mordant, Yohann Loriot, Céline Leteur, Julien Calderaro, Jean Bourhis, Marie Wislez, Jean-Charles Soria, and Eric Deutsch. Dependence on phosphoinositide 3-kinase and ras-raf pathways drive the activity of raf265, a novel raf/vegfr2 inhibitor, and rad001 (everolimus) in combination. Molecular cancer therapeutics, 9(2):358–368, 2010.
- Naito et al. [2010] Atsuhiko T Naito, Sho Okada, Tohru Minamino, Koji Iwanaga, Mei-Lan Liu, Tomokazu Sumida, Seitaro Nomura, Naruhiko Sahara, Tatsuya Mizoroki, Akihiko Takashima, et al. Promotion of chip-mediated p53 degradation protects the heart from ischemic injury. Circulation research, 106(11):1692, 2010.
- Nelson et al. [2008] David L Nelson, Albert L Lehninger, and Michael M Cox. Lehninger principles of biochemistry. Macmillan, 2008.
- Nishioka et al. [2007] C Nishioka, T Ikezoe, A Takeshita, J Yang, T Tasaka, Y Yang, Y Kuwayama, N Komatsu, K Togitani, HP Koeffler, et al. Zd6474 induces growth arrest and apoptosis of human leukemia cells, which is enhanced by concomitant use of a novel mek inhibitor, azd6244. Leukemia, 21(6):1308–1310, 2007.
- Riddick et al. [2011] Gregory Riddick, Hua Song, Susie Ahn, Jennifer Walling, Diego Borges-Rivera, Wei Zhang, and Howard A Fine. Predicting in vitro drug sensitivity using random forests. Bioinformatics, 27(2):220–224, 2011.
- Rubin [2015] Mark A Rubin. Health: Make precision medicine work for cancer care. Nature News, 520(7547):290, 2015.
- Shao et al. [2016] Jinjin Shao, Zhifei Xu, Xueming Peng, Min Chen, Yuanrun Zhu, Li Xu, Hong Zhu, Bo Yang, Peihua Luo, and Qiaojun He. Gefitinib synergizes with irinotecan to suppress hepatocellular carcinoma via antagonizing rad51-mediated dna-repair. PLoS One, 11(1):e0146968, 2016.
- Simidjievski et al. [2019] Nikola Simidjievski, Cristian Bodnar, Ifrah Tariq, Paul Scherer, Helena Andres-Terre, Zohreh Shams, Mateja Jamnik, et al. Variational autoencoders for cancer data integration: Design principles and computational practice. BioRxiv, page 719542, 2019.
- Strickler et al. [2012] John H Strickler, Alexander N Starodub, Jingquan Jia, Kellen L Meadows, Andrew B Nixon, Andrew Dellinger, Michael A Morse, Hope E Uronis, P Kelly Marcom, S Yousuf Zafar, et al. Phase i study of bevacizumab, everolimus, and panobinostat (lbh-589) in advanced solid tumors. Cancer chemotherapy and pharmacology, 70(2):251–258, 2012.
- Tutusaus et al. [2018] Anna Tutusaus, Milica Stefanovic, Loreto Boix, Blanca Cucarull, Aynara Zamora, Laura Blasco, Pablo García de Frutos, Maria Reig, Jose C Fernandez-Checa, Montserrat Marí, et al. Antiapoptotic bcl-2 proteins determine sorafenib/regorafenib resistance and bh3-mimetic efficacy in hepatocellular carcinoma. Oncotarget, 9(24):16701, 2018.
- Warsch et al. [2011] Wolfgang Warsch, Karoline Kollmann, Eva Eckelhart, Sabine Fajmann, Sabine Cerny-Reiterer, Andrea Hölbl, Karoline V Gleixner, Michael Dworzak, Matthias Mayerhofer, Gregor Hoermann, et al. High stat5 levels mediate imatinib resistance and indicate disease progression in chronic myeloid leukemia. Blood, The Journal of the American Society of Hematology, 117(12):3409–3420, 2011.
- Wu et al. [2016] Siqi Wu, Antony Joseph, Ann S Hammonds, Susan E Celniker, Bin Yu, and Erwin Frise. Stability-driven nonnegative matrix factorization to interpret spatial gene expression and build local gene networks. Proceedings of the National Academy of Sciences, 113(16):4290–4295, 2016.
- Wu et al. [2015] Yi-Ju Wu, Yee-Jee Jan, Bor-Sheng Ko, Shu-Man Liang, and Jun-Yang Liou. Involvement of 14-3-3 proteins in regulating tumor progression of hepatocellular carcinoma. Cancers, 7(2):1022–1036, 2015.
- Yang et al. [2010] Joy C Yang, Lanfang Bai, Stanley Yap, Allen C Gao, Hsing-Jien Kung, and Christopher P Evans. Effect of the specific src family kinase inhibitor saracatinib on osteolytic lesions using the pc-3 bone model. Molecular cancer therapeutics, 9(6):1629–1637, 2010.
- Yang et al. [2006] Yang Yang, Takayuki Ikezoe, Chie Nishioka, Takahiro Taguchi, Wei-guo Zhu, H Phillip Koeffler, and Hirokuni Taguchi. Zd6474 induces growth arrest and apoptosis of gist-t1 cells, which is enhanced by concomitant use of sunitinib. Cancer science, 97(12):1404–1409, 2006.
- Yu and Kumbier [2020] Bin Yu and Karl Kumbier. Veridical data science. Proceedings of the National Academy of Sciences, 117(8):3920–3929, 2020.
Appendix A Data
To begin building the personalized drug response models, we leverage data from a panel of 397 human cancer cell lines that have both high-throughput molecular profiling and pharmacological data for 24 anticancer drugs from the Cancer Cell Line Encyclopedia (CCLE) project [4]. Specifically, -omics data from the CCLE was downloaded from DepMap Public 18Q3 (https://depmap.org/portal/download/). These cell lines encompass 23 different tumor sites and have been profiled for gene expression, microRNA expression, DNA methylation, and protein expression. Note that though the CCLE contains data from 947 cell lines, only 397 of these cell lines had data from all four molecular profiles of interest and pharmacological profiling.
In addition to the molecular profiles, we obtained pharmacological profiling of 24 chemotherapy and target therapy drugs from the CCLE [4]. For each cell line-drug combination, the CCLE incorporated a systematic framework to measure molecular correlates of pharmacological sensitivity in vitro across eight dosages. We refer to [4] for details on this procedure, but given the fitted dose-response curves of growth inhibition from these experiments, we took the activity area, or AUC, to be the primary response of interest in this work. The AUC is defined as the area between the response curve and 0 (i.e., the no response reference level) and is a well-accepted measure of drug sensitivity [18, 4]. In this case, the AUC is measured on an 8-point scale with 0 corresponding to an inactive compound and 8 corresponding to a compound with 100% inhibition at all 8 dosages.
In Figure 1, we provide a graphical summary of the raw molecular and pharmacological profiling data sets.
A.1 Data preprocessing
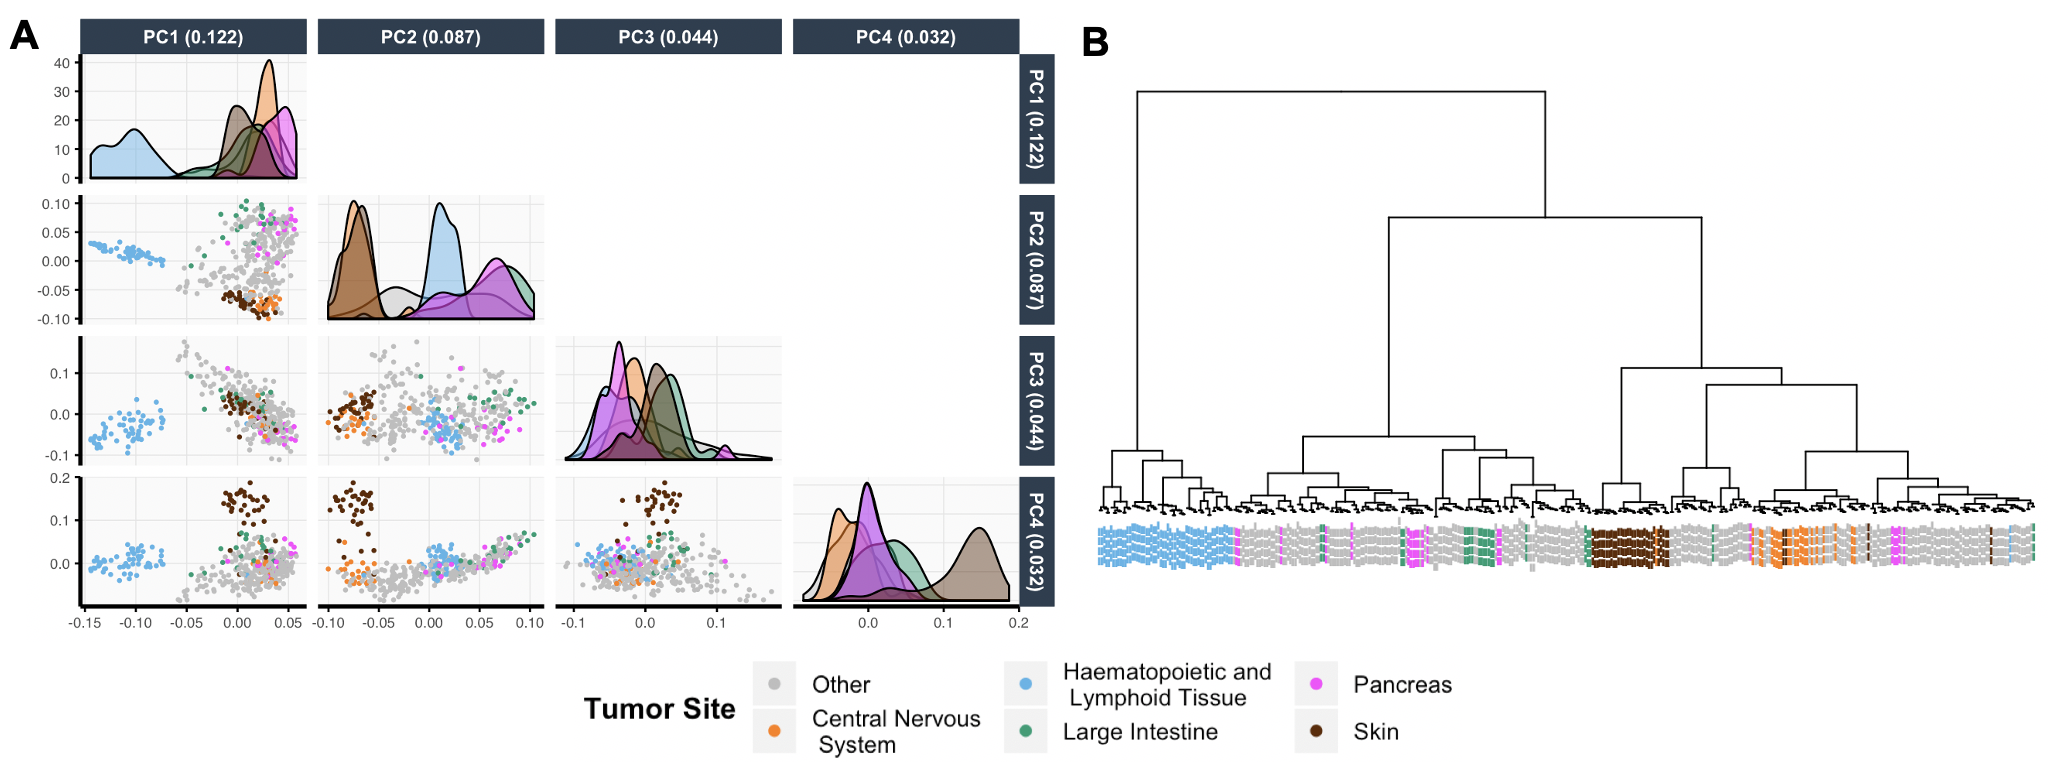
Given the raw data described above, there are a couple areas of initial concern that warrant preprocessing. First, the cancer cell lines encompass 23 different tumor sites, and cell lines from the same tumor site tend to have more similar expression profiles than cell lines from different sites. To illustrate, we observe clusters of cell lines by tumor site when performing both hierarchical clustering and PCA on the RNASeq profile in Figure 2. Due to these inherent differences between tumors, we chose to omit the cell lines from tumor sites with cell lines. This reduces our sample size to 370 cell lines from 16 tumor sites. Here, we chose the threshold to ensure we have at least 2 cell lines from each tumor site in each of the training, validation, and test splits (using a 50-25-25% partitioning scheme).
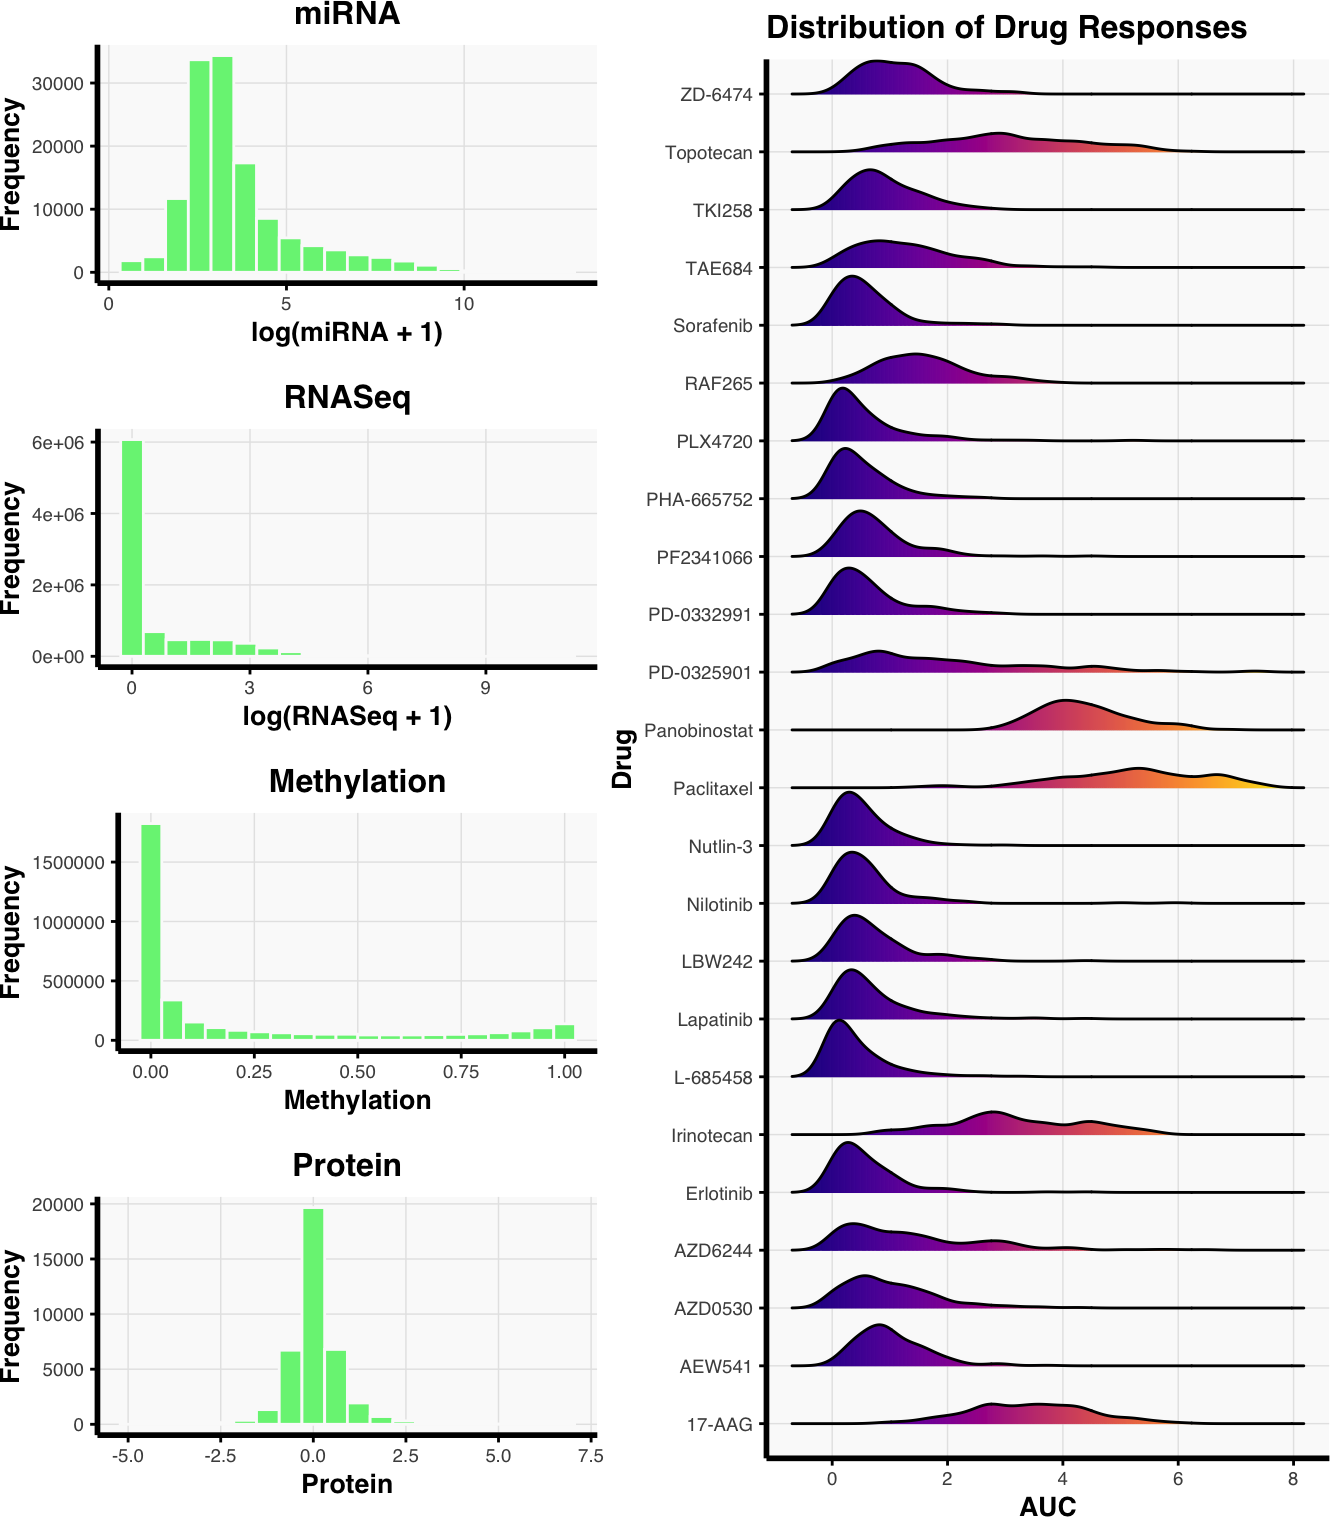
In addition to reducing the number of samples in our analysis, we reduced the number of features to more manageable sizes before continuing with our analyses. Originally, the molecular profiling data consisted of 734 miRNAs, 50114 genes, 20192 TSS, and 214 proteins. With only 370 cell lines, we aggressively preprocessed the number of genes and TSS by taking the top 10% of genes (or 5000 genes) and top 20% of TSS (or 4000 TSS) with the highest variance. We also transformed the miRNA and RNASeq expression values using the log-transformation log(x+1) in order to mitigate potential problems with highly skewed positive count values.
We recognize however that there were many other reasonable ways to preprocess this data. For instance, we could have taken the top 20% of genes and top 40% of TSS with the highest variance. Another common alternative would have been to filter features using marginal correlations with the response or using a multivariate prediction model (e.g., the Lasso). To assess robustness to these choices, we reran our prediction analysis using these alternative preprocessing procedures and saw that the prediction accuracies are higher using the variance-filtering preprocessing pipelines, as compared to the correlation-filtering and Lasso-filtering pipelines (see PCS documentation). Further, the smaller variance-filtered model gives similar prediction accuracies as the larger variance-filtered model. Thus, for simplicity moving forward, we use and focus primarily on the initially proposed variance-filtering procedure as it is less computationally expensive than the model with twice as many features and maintains similarly high accuracy.
To summarize, after this preprocessing, we have 370 cell lines with data across the four molecular profiles of interest with 734 miRNAs (log-transformed), 5000 genes (log-transformed), 4000 TSS, and 214 proteins and pharmacological data, measured via the AUC drug response scores, for 24 anticancer compounds. We provide a visual summary of the preprocessed data and plot the overall distribution of features in the four molecular profiles as well as the distribution of the 24 drug responses in Figure 3.
Appendix B Prediction Models
Like in data preprocessing, human judgment calls play a significant role in the modeling stage, including the decision of which methods to fit. Ideally, the chosen methods should have some justified connection to the biological problem at hand, but in our case, it is unclear which models or assumptions best fit the biological drug response mechanism a priori. Nevertheless, we have reasons to believe that the Lasso, elastic net, RF, and kernel ridge regression are particularly appealing fits for this problem.
First, the Lasso assumes a sparse linear model, meaning that the effect of each feature is additive and only a sparse number of the features contribute to the drug sensitivity. The simplicity and interpretability of the Lasso makes it a popular tool for bioinformatics prediction tasks, so we choose to use the Lasso as a baseline model for our analysis. The elastic net is perhaps even more popular than the Lasso in drug response prediction studies [18, 4]. Similar to the Lasso, the elastic net assumes linearity and some sparsity but is also able to better handle correlated features. Beyond linearity, kernel ridge regression with a Gaussian kernel allows for more flexible, but less interpretable, functional relationships that are not necessarily linear. Kernel methods have been applied in previous case studies with great success [10] and are hence promising candidates for our study as well. Lastly, random forest can be viewed as a collection of localized, non-linear thresholded decisions rules (like on-off switches), which are well-suited for many biological processes that match the combinatorial thresholding (or switch-like) behavior of decision trees [27]. Random forests are also invariant to the scale of the data. This is especially advantageous for integrating different data sets with varying scales and domain types (e.g., count-valued RNASeq expression, proportion-valued methylation data, continuous-valued protein expression).
In addition to fitting the aforementioned methods on each of the molecular profiles separately, we also tried fitting various data integration methods since incorporating multiple sources of -omics data can sometimes result in more accurate predictions than models built using only a single -omics sources [10, 15, 32]. The most natural integration idea is to concatenate the -omics data sets together and to fit a single model (e.g., the elastic net) on the concatenated data. When fitting models like the Lasso, elastic net, and kernel ridge regression which are not scale-invariant, the molecular profiles are scaled to have columns with mean and variance to allow for fair comparisons between molecular types. We refer to this method as the concatenated data approach and use this as a baseline for evaluating data integration methods. More sophisticated methodology has also been proposed to integrate -omics data, including recent work using the X-VAE, a variational autoencoder for cancer data integration [32], and the BMTMKL, a Bayesian multitask multiple kernel learning method which won the NCI-DREAM 7 challenge [10].
Note that though an alternative approach would have been to develop new methodology, we instead leverage these existing machine learning methods that have been rigorously vetted and have been shown to work well in many related problems. In fact, by examining the stable properties across these existing methods, we obtain high-quality scientific findings, as made evident by the abundance of supporting literature (see Table 1).
B.1 Model hyperparameters
To select hyperparameters in each of these methods, we use 5-fold cross validation, where the folds are stratified by tumor type. We also investigate using the estimation stability cross validation (ESCV) metric for selecting the Lasso’s hyperparameter. This ESCV metric combines a stability measure within the cross-validation framework to yield more stable estimation properties with minimal loss of accuracy when using the Lasso [21].
For the X-VAE model, we adapt an X-shaped network architecture to train a variation autoencoder that learns joint representation of the RNAseq and protein data. In particular, we take the 2,000 RNAseq features with highest variance, since the number of cell lines is too small compared with the original number of RNAseq features. In our experiment, both the encoder and the encoder have one hidden layer. There are 128 neurons corresponding to the RNAseq protein in the hidden layer of the encoder and the decoder, and 32 neurons corresponding to the protein features. The latent representation has a dimension of 32. The dimension of the hidden layers and the latent representation are based on the recommendation of [32], and are not tuned. We used ELU activation and employed batch normalization and a dropout component with rate 0.2, as recommended by [32]. The models were trained for 500 epochs using an Adam optimizer with a learning rate of 0.001.
B.2 Evaluation metrics
We primarily consider two evaluation metrics for prediction accuracy as each captures a different aspect of prediction - 1) value and 2) probabilistic concordance-index (PC-index). is defined as , where denotes the variance of the observed responses, and denotes the mean sum of squared errors between the predicted responses and observed responses . is a rescaling of the MSE that accounts for the amount of variation in the observed response and thus allows us to easily compare accuracies between drug response models with different amounts of variation in the observed response, but as with the MSE, can be heavily influenced by outliers. PC-index is a measure of how well the predicted rankings agree with the true responses. This metric takes into account the variance of the drug responses but it also assumes that the drug responses follow a Gaussian distribution, which may not be true in some cases. We consider this metric because it is the primary method of evaluation in the NCI-DREAM 7 competition [10]. Given the large scale and breadth of this challenge, we compare our results to this work. For further details on the PC-index, we refer to [10].
In each of the evaluation metrics above, we receive a separate score for each of the 24 drug response models. It may also be beneficial to aggregate the 24 scores into a single number for concrete evaluation. In particular, [10] used a weighted average of the PC-indices to compare various models and referred to this evaluation metric as the weighted PC-index (WPC-index). To compare our results with the benchmark in [10], we also consider the WPC-index in evaluating our models.
B.3 Prediction results
| Validation Set WPC-Index | Validation Set | |||||||||
| Methyl. | miRNA | Protein | RNASeq | Integrated | Methyl. | miRNA | Protein | RNASeq | Integrated | |
| Kernel Ridge | 0.600 | 0.603 | 0.617 | 0.631 | 0.624 | 0.111 | 0.104 | 0.168 | 0.231 | 0.200 |
| Elastic Net | 0.602 | 0.606 | 0.608 | 0.626 | 0.625 | 0.102 | 0.124 | 0.126 | 0.183 | 0.162 |
| Lasso | 0.597 | 0.605 | 0.609 | 0.620 | 0.620 | 0.117 | 0.105 | 0.121 | 0.172 | 0.176 |
| Lasso (ESCV) | 0.600 | 0.601 | 0.609 | 0.623 | 0.618 | 0.114 | 0.113 | 0.129 | 0.195 | 0.141 |
| RF | 0.599 | 0.594 | 0.606 | 0.626 | 0.622 | 0.124 | 0.088 | 0.123 | 0.214 | 0.196 |
| X-VAE | – | – | – | – | 0.617 | – | – | – | – | 0.188 |
| BMTMKL | – | – | – | – | 0.613 | – | – | – | – | 0.179 |
In Table 2, for various methods, we summarize the validation accuracy across all 24 drugs as measured by the average value and WPC-index. In Tables 3 and 4, we provide additional insights into the drug response prediction accuracies at the individual drug level. In Table 3, we see that the best model depends on the particular drug, but the kernel ridge regression model works best on average. In Table 4, we show the test errors from the kernel ridge regression fit for each drug separately.
| Methyl. | miRNA | Protein | RNASeq | Integrated | |
| Kernel Ridge | 7 | 5 | 16 | 12 | 6 |
| RF | 9 | 5 | 2 | 6 | 5 |
| Elastic Net | 1 | 8 | 1 | 1 | 2 |
| Lasso (ESCV) | 4 | 4 | 3 | 4 | 0 |
| Lasso | 3 | 2 | 2 | 1 | 5 |
| X-VAE | – | – | – | – | 2 |
| BMTMKL | – | – | – | – | 2 |
| Drug | PC-Index | |
| 17-AAG | 0.000 | 0.574 |
| AEW541 | 0.034 | 0.558 |
| AZD0530 | 0.037 | 0.560 |
| AZD6244 | 0.425 | 0.675 |
| Erlotinib | 0.254 | 0.615 |
| Irinotecan | 0.307 | 0.644 |
| L-685458 | 0.210 | 0.624 |
| LBW242 | -0.001 | 0.511 |
| Lapatinib | 0.208 | 0.607 |
| Nilotinib | 0.258 | 0.590 |
| Nutlin-3 | 0.022 | 0.549 |
| PD-0325901 | 0.543 | 0.701 |
| PD-0332991 | 0.218 | 0.596 |
| PF2341066 | 0.091 | 0.564 |
| PHA-665752 | 0.115 | 0.559 |
| PLX4720 | 0.305 | 0.585 |
| Paclitaxel | 0.369 | 0.670 |
| Panobinostat | 0.446 | 0.679 |
| RAF265 | 0.215 | 0.625 |
| Sorafenib | 0.242 | 0.567 |
| TAE684 | 0.024 | 0.576 |
| TKI258 | 0.183 | 0.585 |
| Topotecan | 0.240 | 0.630 |
| ZD-6474 | 0.155 | 0.591 |
Appendix C PCS Inference
C.1 Detailed description on the computation of stability scores
We next describe in detail how to compute the stability scores in the PCS-driven disease signature identification pipeline. Note that the following procedure is repeated for each of the 24 drugs.
We randomly draw bootstrap samples from the training data. Then, for each bootstrap sample, we fit (1) an elastic net with tuning parameter selected by CV (2) a Lasso with tuning parameter selected by ESCV and (3) a random forest. Each model is fitted using the protein and RNAseq data separately since the integration approaches did not improve the prediction accuracy over simply using the RNASeq data only (see Table 2). Next, for each feature from either the protein or RNAseq data set, let be defined in the following way: for the Lasso and elastic net, if the coefficient of is non-zero, and otherwise; for the random forest, is the MDI feature importance of . We then define the stability score of each feature as and rank the proteins and genes separately by the stability scores of the features.
| Drug name | Protein signature | RNAseq Signature |
|---|---|---|
| 17-AAG | Bax, p53, Caspase-7, eIF4E | CTD, AP2S1, BZW2 |
| AEW541 | Akt, Smad1, p27, PTEN, RAD51 | B4GALT3, SEMA3B |
| AZD0530 | p38, c-Kit | HPGD |
| AZD6244 | PI3K-p85, TFRC, Bax | SPRY2, RP11, LYZ, DUSP6, PRSS57 |
| Erlotinib | EGFR, Beclin, P-Cadherin | PIP4K2C, SEC61G |
| Irinotecan | MDMX_MDM4, Src | |
| L-685458 | YAP, VEGFR2, Src | |
| LBW242 | ASNS | MRPL24 |
| Lapatinib | HER2, HER3, EGFR, Rab25, Heregulin | STARD3 |
| Nilotinib | STAT5, c-Kit, SHP-2, Src, p27 | |
| Nutlin.3 | Bcl-2, Bax | |
| PD-0325901 | MEK1, Bax, TFRC, PI3k | SPRY2, DUSP6, ETV4 |
| PD-0332991 | Bcl-2, MDMX_MDM4, Src | |
| PF2341066 | c-Met | CAPZA2 |
| PHA-665752 | MEK1, c-Met | FMNL1 |
| PLX4720 | MEK1, Bax, PREX1, Beclin | FABP7 |
| Paclitaxel | Src, beta-Catenin | ORMDL2 |
| Panobinostat | VEGFR2, Src | |
| RAF265 | PI3K-p85, FOXO3a, eEF2K | RETN |
| Sorafenib | Bcl-2, Src | |
| TAE684 | PTEN, Akt, p70S6K, Bcl-2 | H1FX |
| TKI258 | CD49b, C-Raf | |
| Topotecan | c-Met | OSGIN1 |
| ZD.6474 | c-Kit, STAT5-alpha |
C.2 Discussion on the disease signatures identified by the PCS pipeline
In Table 5, we list the proteins and genes which we found to be stable and among the top 10 features for all three methods. Among these stable features, we list them in decreasing order by the sum of stability score rankings. Though we identify fewer stable genes, this is most likely due to two reasons. First, there are 5000 genes in the model, compared to only 214 proteins, so thresholding at the top 10 genes is extremely conservative. Secondly, the average correlation between genes is higher than that between proteins, adding to the instability.
With regards to the identified protein signatures, we can roughly classify them into three categories. The first category contains those that are known targets of the corresponding target therapy drugs. For example, Erlotinib is a medication used to treat non-small cell lung cancer (NSCLC) and pancreatic cancer. It is an EGFR inhibitor and is specifically used for NSCLC patients with tumors positive for EGFR exon 19 deletions (del19) or exon 21 (L858R) substitution mutations. Correspondingly, EGFR is ranked in the top ten stable proteins in all three models. Other such examples include the drug Lapatinib and its target HER2, PD-0325901 and its target MEK, PHA-665752 and its target c-Met, and ZD-6474 and its target c-Kit.
The second category contains those that are not known to be direct targets of the drug but have been shown in preclinical studies to be potential therapeutic targets or are associated with drug resistance. For example, [22] identified a potential application of the drug Irinotecan as an MdmX inhibitor for targeted therapies, and in our pipeline, MdmX had the highest stability score for all three models. As another instance, we identified MEK1 as a top protein signature, ranked by stability score, for the drug PLX4720 while [13] showed that MEK1 mutations confer resistance to PLX4720.
| Drug | Protein | Supporting Literature | Drug | Protein | Supporting Literature |
| 17-AAG | p53 | Naito et al. [26] | PD-0332991 | Bcl-xL | Chen and Pan [9] |
| AEW541 | Akt | Attias-Geva et al. [1] | PF2341066 | PEA15 | – |
| AZD0530 | p38 | Yang et al. [38] | PHA-665752 | MEK1 | – |
| AZD6244 | CD20 | – | PLX4720 | MEK1 | Emery et al. [13] |
| Erlotinib | P-Cadherin | – | Paclitaxel | Src | Le and Bast [20] |
| Irinotecan | RAD51 | Shao et al. [31] | Panobinostat | Src | – |
| L-685458 | VEGFR2 | – | RAF265 | PI3K-p85 | Mordant et al. [25] |
| LBW242 | Caspase-7 | – | Sorafenib | 14-3-3 epsilon | Wu et al. [37] |
| Lapatinib | HER2 | Esteva et al. [14] | TAE684 | Akt | – |
| Nilotinib | p27 | Liu et al. [23] | TKI258 | 14-3-3 epsilon | – |
| Nutlin.3 | Bcl-2 | Drakos et al. [11] | Topotecan | 14-3-3 epsilon | – |
| PD-0325901 | MEK1 | Henderson et al. [17] | ZD-6474 | c-Kit | Nishioka et al. [28] |
The third category are proteins that do not belong to the two categories above. Still, these biomarkers are predictive of the drug response under various model and data perturbations. Given the evidence in the scientific literature that supports many of our identified features, the proteins in this category may be potential candidates for future preclinical investigation.
Among the list of overlapping stable features in Table 5, we list in Table 1 the one with the highest stability score ranking along with recent biomedical publications, supporting the association between the protein and the drug. The procedure of this literature search is as follows: we first searched for papers where the protein and the drug co-occurs. Then for each paper, we read the introduction section to understand their main conclusions. Each of the 18 papers listed in Table 1 includes sentences such as “our findings suggest that the over-expression of this protein will increase drug sensitivity/resistance” or “this protein is a potential (or known) therapeutic target for the drug”. Out of the 24 predictive protein signatures that we identify as most stable, 18 of them have existing preclinical studies that confirm the effectiveness of our stability analysis.
In Table 6, we list the protein with the highest stability score when fitting an elastic net to 100 bootstrap samples of the training data for each of the 24 drugs. This approach of finding predictive -omics features was previously used in [4, 18]. Compared with staDRIP, which searches for stable features across different models, this approach only uses a single model (i.e, an elastic net) for feature selection. We repeat the same literature search procedure as we did for our findings and found that among the 24 most stable protein features identified by elastic net, only 14 are known from previous clinical studies. For 10 drugs, the most stable protein from elastic net and that from staDRIP is the same, and among these 10 proteins, 9 are implicated in the existing literature. For the other 14 drugs, 5 proteins identified by elastic net are implicated in the existing literature, while 9 protein features identified by staDRIP are implicated in the existing literature.