Evidence for bond-disproportionation in LiNiO2 from x-ray absorption spectroscopy
Abstract
The electronic structure of LiNiO2, a promising Li-ion battery cathode material, has remained a challenge to understand due to its highly covalent yet correlated nature. Here we elucidate the electronic structure in LiNiO2 and the related compound NaNiO2 using x-ray absorption spectra (XAS) and quantum many-body calculations. Notably, we use inverse partial fluorescence yield to correctly measure the Ni -edge XAS, which is inaccurate using conventional methods. We show that the XAS are indicative of a strong Jahn-Teller effect in NaNiO2 and a bond disproportionated state in LiNiO2, supporting a theory of a high-entropy, glassy disproportionated state that stabilizes charging cycles in LiNiO2.
LiNiO2 is most well known as a potential cathode material for Li-ion batteries.Liu et al. (2015) However, despite extensive study, the microscopic electronic structure of LiNiO2 remains unresolved. LiNiO2 and its relative NaNiO2 both consist of layers of edge-sharing NiO6 octahedra arranged on a triangular lattice with Li or Na residing in-between the NiO2 layers. In these compounds Ni is in a formally Ni3+ 3 configuration, with a large octahedral crystal/ligand field yielding a low-spin configuration. Since the configuration is susceptible to a Jahn-Teller (JT) distortion, it is expected that the octahedra are distorted in a manner that lifts the degeneracy of the states. In NaNiO2 a cooperative Jahn-Teller distortion indeed occurs, resulting in both ferro-orbital ordering of states below 460 K and eventual anti-ferromagnetic ordering of spins.Borgers and Enz (1966); Mostovoy and Khomskii (2002); Lewis et al. (2005); Meskine and Satpathy (2005) In contrast, LiNiO2 does not exhibit long-range order to the lowest observable temperatures.Arai et al. (1995); Chung et al. (2005) Rather, EXAFS and neutron pair distribution function measurements have shown evidence for some local Jahn-Teller distortions of NiO6 octahedra, without long-range ordering of the distortions.Rougier et al. (1995); Chung et al. (2005)
The reason for the lack of ordering in LiNiO2 is unresolved. LiNiO2 may be an example of an antiferromagnet on a triangular lattice, which is a candidate for a frustrated spin liquid. However, LiNiO2 also exhibits Li:Ni cross-substitution, with Li on the Ni site, and vice-versa, that may introduce sufficient disorder to inhibit long range JT and anti-ferromagnetic order.Petit et al. (2006) In addition, recent work has indicated that LiNiO2 may be a charge and bond disproportionated glass.Chen et al. (2011); Foyevtsova et al. (2019) Density functional theory calculations reveal a large number of nearly degenerate ground states that involve local Jahn Teller distortions and both bond and charge disproportionation.Foyevtsova et al. (2019) The bond disproportionations in such a state are similar to those found in the perovskite rare-earth nickelates, NiO3.Mizokawa et al. (2000); Mazin et al. (2007); Park et al. (2012); Johnston et al. (2014); Lau and Millis (2013); Subedi et al. (2015); Green et al. (2016)
Like NaNiO2 and LiNiO2, a key feature of NiO3 is the high 3+ formal oxidation state of Ni. The Ni3+ is uncommon, with the electronegativity of Ni typically yielding a valence closer to , as in NiO. In NiO3, it is proposed that this high oxidation state leads to these compounds having a negative charge-transfer energyGreen et al. (2016); Sawatzky and Green (2016) in the Zaanan-Sawatzky-Allen (ZSA) classification scheme.Mizokawa et al. (1995); Zaanen et al. (1985) In this model, the actual Ni valence is close to 2+, with the excess holes present on the neighbouring oxygen. Evidence for the negative charge transfer energy has come from resonant inelastic x-ray scattering.Bisogni et al. (2016) Additionally, a successful description of both the XAS and resonant x-ray scattering in NiO3 is achieved in a model that includes hybridization between neighbouring NiO6 clusters and bond-disproportionation, wherein the hybridization of O states on one NiO6 differs from that of its neighbour.Green et al. (2016)
Evidence that LiNiO2 is also a negative-charge-transfer system, similar to NiO3, has come from x-ray absorption measurements at the O edge in LixNi2-xO2. These measurements show a large oxygen pre-peak that grows with Li content, indicative of a large hole content in O states,Kuiper et al. (1989) reminiscent of hole doped cuprates.Chen et al. (1991) Moreover, the spectrum of NaNiO2 vanVeenendaal and Sawatzky (1994) appears similar to that of NiO3.Piamonteze et al. (2005); Bodenthin et al. (2011); Freeland et al. (2016) However, measurements of the Ni edge of LiNiO2 have often indicated a local electronic configuration of Ni similar Ni2+ in NiO or an admixture of Ni2+ and Ni3+ rather than negative charge transfer Ni3+,Abbate et al. (1991); Montoro et al. (1999); Kang et al. (2007) leading to uncertainty in the overall electronic structure of this compound.
One of the challenges of interpreting the XAS of NaNiO2 and LiNiO2 (as well as AgNiO2)Kang et al. (2007) is that the x-ray absorption can be difficult to measure correctly. Both NaNiO2 and LiNiO2 are hydroscopic, exhibiting Ni2+ on their surfaces after exposure to air. Accordingly, surface sensitive total electron yield (TEY) measurements of XAS, having a probing depth of order 50 Å, may inadvertently probe a contaminated surface that forms a more stable oxide and is not characteristic of the bulk. To circumvent this surface sensitivity, bulk sensitive total fluorescence yield (TFY) measurements of XAS may be employed. However, at the Ni edge in systems such as LiNiO2 where Ni makes the largest contribution to the total absorption cross-section, TFY spectra are heavily distorted by self-absorption effectsEisebitt et al. (1993); Achkar et al. (2011a, b) and inherent non-linearities in the scattering process.de Groot et al. (1994); Kurian et al. (2012); Green et al. (2014) In contrast, since O is a smaller contributor to the total absorption co-efficient, TFY measurements at the O edge remain reasonably accurate. Here we utilize inverse partial fluorescence yield spectroscopy (IPFY)Achkar et al. (2011a, b) to provide a bulk sensitive and distortion free measurement of XAS at the Ni edge.
X-ray absorption measurements were performed on polycrystalline powder samples of LiNiO2 and NaNiO2 at the SGM beamline at the Canadian Light Source. The samples were prepared with different surface treatments, either as powder samples that have been exposed to air and pressed onto carbon tape or sintered powders that are either fractured or scraped in vacuum to reveal material that has not been previously exposed to air. For LiNiO2 the latter procedure produced samples with less surface contamination. However, for NaNiO2, sintering appeared to change the bulk of the sample relative to the initial powders. TEY measurements were performed by measuring the sample drain current. TFY and IPFY were measured using an energy resolved silicon drift detector.Achkar et al. (2011a, b) IPFY uses the O x-ray emission, the inverse of which has been shown to be proportional to the x-ray absorption co-efficient plus an approximately energy independent offset, providing a measure of the absorption co-efficient that is more bulk sensitive than TEY, like TFY, but does not suffer from self-absorption effects that can be prominent in concentrated systems such as LiNiO2.Achkar et al. (2011a, b)
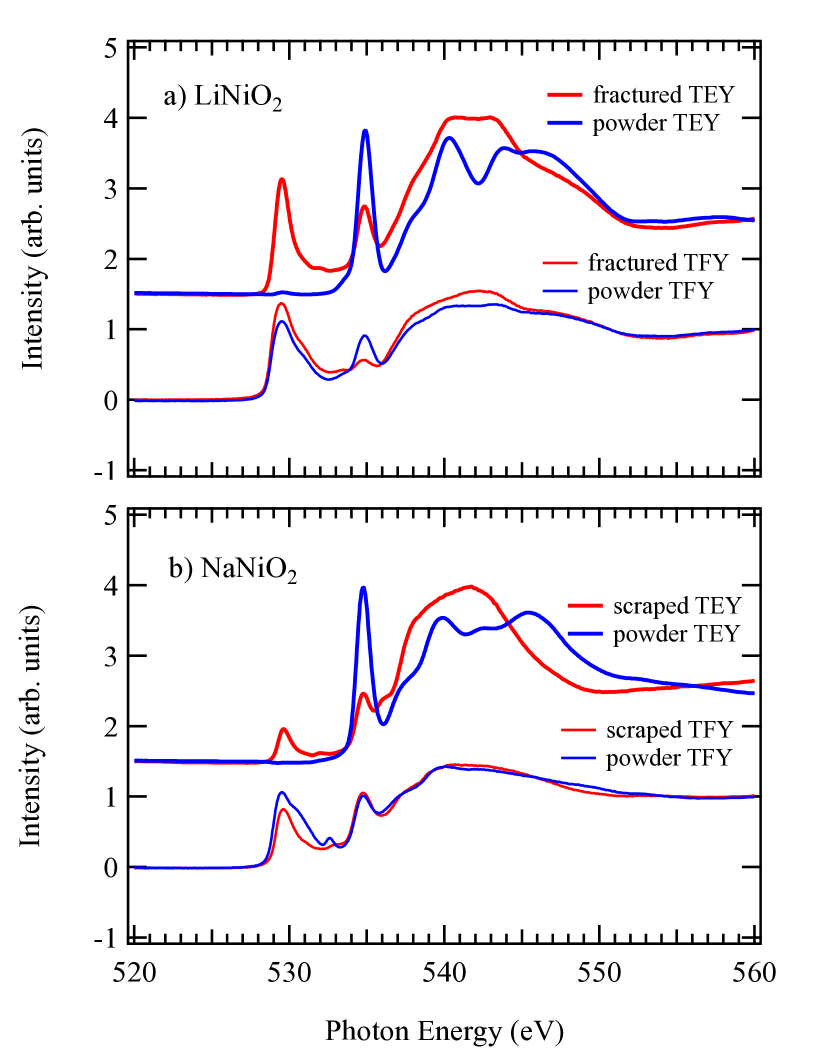
Figure 1 presents O edge measurements of LiNiO2 and NaNiO2. Similar to previous measurements,Kuiper et al. (1989) a large pre-peak is observed (at 529.5 eV), indicative of a large hole content in O 2 states. Similar intensities of the O prepeak are observed in both NaNiO2 and LiNiO2. Note these measurements also indicate the role of surface oxidation in LiNiO2. Surface sensitive TEY measurements exhibit a pronounced prepeak in a sample that is sintered and fractured in vacuum, whereas a powder sample exposed to air exhibits a negligible prepeak at 529 eV and a larger peak at 535 eV, which we associate with surface reduction. Kuiper et. al. associate this 535 eV peak with Li2O.Kuiper et al. (1989) We note, however, that a peak at approximately the same energy is also observed in the TEY of NaNiO2 powder, suggesting an alternate origin.
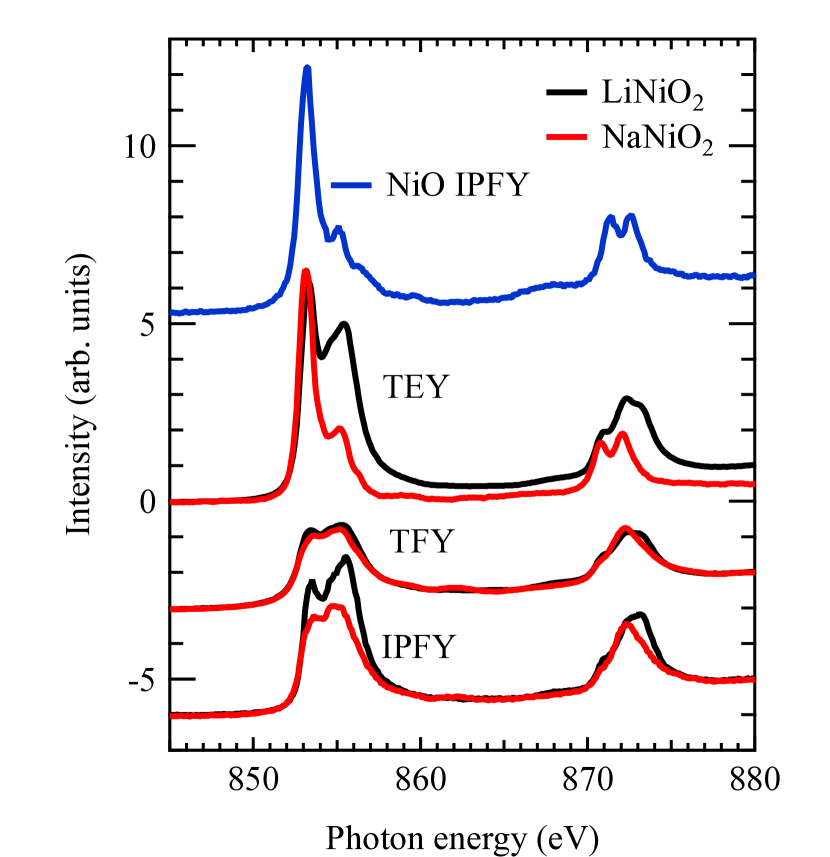
Measurements of the Ni edge are shown in Fig. 2. For LiNiO2, the surface sensitive TEY spectrum is similar to that of NiO. The NaNiO2 TEY spectrum also exhibits a prominent peak at 853 eV indicative of Ni2+ on the surface, although the effect is less dramatic than LiNiO2. In contrast, the more bulk sensitive TFY and IPFY measurements do not exhibit a NiO like lineshape. The IPFY and TFY spectra have similar lineshapes. However, the TFY spectra suffer from a prominent self-absorption effect that reduces the intensity of the peak relative to the peak, limiting possible comparisons between materials as well as with theory. The IPFY spectra, which do not suffer from self-absorption effects, are expected to provide a more accurate measure of the energy dependence of the absorption co-efficient.
Coarsely, the resulting the Ni -edge spectra are similar for NaNiO2 and LiNiO2 and, despite having edge sharing instead of corner sharing octahedra, are also similar to that of NiO3 compounds.Piamonteze et al. (2005); Bodenthin et al. (2011); Freeland et al. (2016) However, the detailed lineshape of the spectra exhibit key differences for NaNiO2 and LiNiO2 that are signatures of Jahn Teller distortions and bond disproportionation. The latter exhibits a more pronounced peak splitting at the edge and a more distinct shoulder on the low energy side of the edge. These features have been shown to arise due to strong Ni-Ni interactions in these covalent materials and are enhanced by bond disproportionation.Green et al. (2016) Adapting the full-multiplet, nickelate double cluster model of Ref. Green et al., 2016 to the present case, we can examine the differences in the XAS of NaNiO2 and LiNiO2 in more detail. In figure 3(a) we show calculations of the Ni edge XAS using the double cluster model, with and without a tetragonal Jahn-Teller effect.111For the Jahn-Teller case, our hopping integrals are , , , . All other parameters are the same as in Ref. Green et al., 2016, unless otherwise noted in the text. The Jahn-Teller effect is introduced via tetragonal distortions to the Ni-O hopping integrals using Harrison’s formulae.Wills and Harrison (1983) The introduction of the Jahn-Teller effect captures the main differences in the spectra of NaNiO2 and LiNiO2. In the absence of Jahn-Teller, the edge exhibits a robust peak splitting and the edge a pronounced low energy shoulder, similar to the spectrum of LiNiO2. Upon the introduction of the Jahn-Teller effect these features are suppressed, similar to NaNiO2.
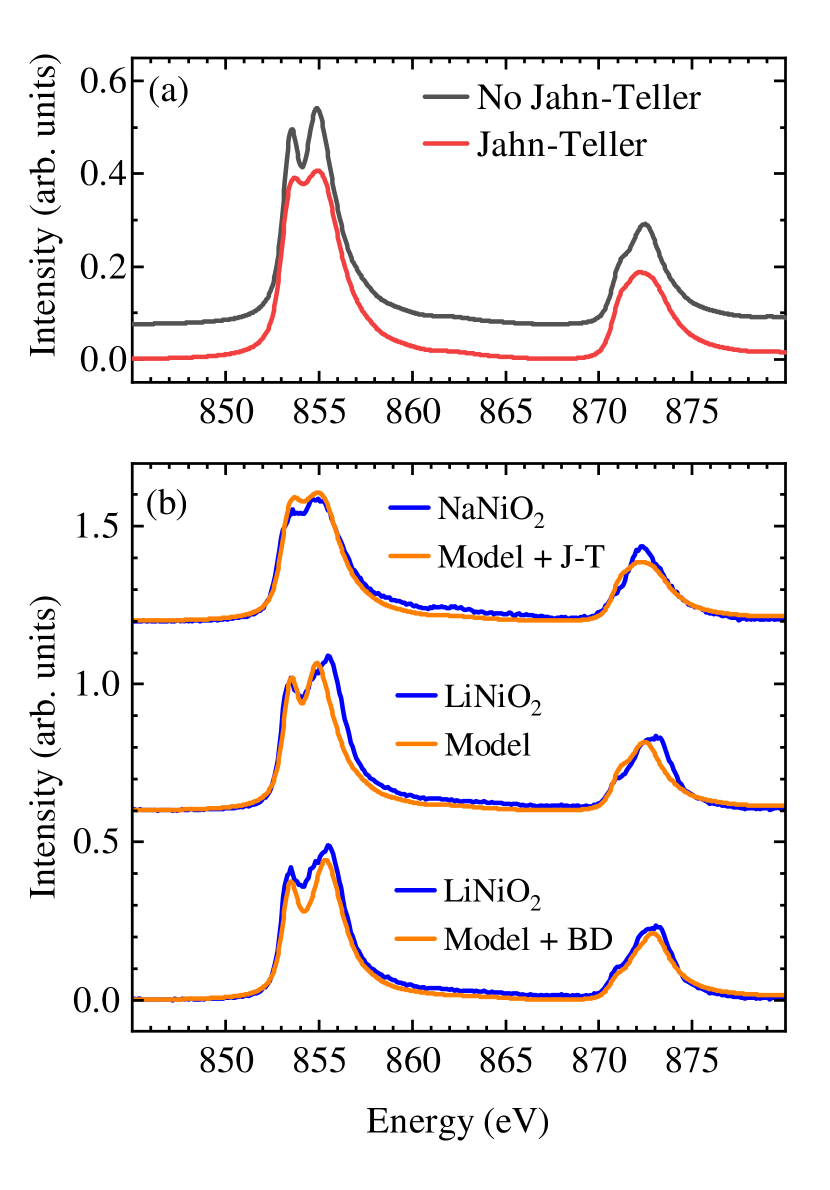
In Fig. 3(b) we present a closer comparison of the model calculations and background-subtracted experimental XAS spectra. The calculation with the Jahn-Teller effect is shown to agree remarkably well with that of NaNiO2. However, for the calculation without the Jahn-Teller effect, there are some slight discrepencies with the spectrum of LiNiO2. In particular, the peak splitting is stronger in experiment. As discussed above, this peak splitting is driven in part by Ni-Ni intersite interactions and can be enhanced by bond disproportionation.Green et al. (2016) Given the similar structures of the two compounds, and the agreement of the calculation with the spectrum of NaNiO2, an appropriate level of Ni-Ni intersite interaction is expected to be present in the calculation for LiNiO2. This suggests that the slight disagreement is due to the presence of bond disproportionation in the experiment that must be accounted for in the model. Upon the inclusion of bond disproportionation (in a manner shown to be reliable for the perovskite nickelates Green et al. (2016) but with a slightly larger value of ), the agreement between calculation and experiment improves drastically, as shown in Fig. 3(b). This result provides strong support for the existence of bond disproportionation in LiNiO2, as recently theorized.Foyevtsova et al. (2019)
Our IPFY data of NaNiO2 and LiNiO2 provide some of the most accurate XAS measurements of these compounds to date. The strong similarity of the spectra to those of perovskite nickelates shows the present materials to be negative charge transfer compounds. Using a quantum many body double cluster model, we confirm the existence of a global Jahn-Teller distortion in NaNiO2, and find evidence for a lack of significant Jahn-Teller effects in LiNiO2. Instead, the calculation results provide evidence for a significant degree of bond disproportionation in LiNiO2. Such a finding provides support for recent theoretical work predicting the existence of a high-entropy, electronic glassy-like disproportionated state in LiNiO2 which is responsible for its strong stability under repeated charge/discharge cycles.
Acknowledgments: This work was supported by the Natural Sciences and Engineering Research Council of Canada (NSERC), the Stewart Blusson Quantum Matter Institute and the Canada First Research Excellence Fund, Quantum Materials and Future Technologies and Transformative Quantum Technologies Programs. Research described in this paper was performed at the Canadian Light Source, which is funded by the CFI, the NSERC, the National Research Council Canada, the Canadian Institutes of Health Research, the Government of Saskatchewan, Western Economic Diversification Canada, and the University of Saskatchewan. B.D.G. acknowledges support from the CIFAR as a CIFAR Fellow.
References
- Liu et al. (2015) W. Liu, P. Oh, X. Liu, M.-J. Lee, W. Cho, S. Chae, Y. Kim, and J. Cho, Angew. Chem. Int. Ed. 54, 4440 (2015).
- Borgers and Enz (1966) P. Borgers and U. Enz, Solid State Communications 4, 153 (1966).
- Mostovoy and Khomskii (2002) M. V. Mostovoy and D. I. Khomskii, Phys. Rev. Lett. 89, 227203 (2002).
- Lewis et al. (2005) M. J. Lewis, B. D. Gaulin, L. Filion, C. Kallin, A. J. Berlinsky, H. A. Dabkowska, Y. Qiu, and J. R. D. Copley, Phys. Rev. B 72, 014408 (2005).
- Meskine and Satpathy (2005) H. Meskine and S. Satpathy, Journal of Applied Physics 97, 10A314 (2005).
- Arai et al. (1995) H. Arai, S. Okada, H. Ohtsuka, M. Ichimura, and J. Yamaki, Solid State Ionics 80, 261 (1995).
- Chung et al. (2005) J.-H. Chung, T. Proffen, S. Shamoto, A. M. Ghorayeb, L. Croguennec, W. Tian, B. C. Sales, R. Jin, D. Mandrus, and T. Egami, Phys. Rev. B 71, 064410 (2005).
- Rougier et al. (1995) A. Rougier, C. Delmas, and A. V. Chadwick, Solid State Communications 94, 123 (1995).
- Petit et al. (2006) L. Petit, G. M. Stocks, T. Egami, Z. Szotek, and W. M. Temmerman, Physical Review Letters 97, 146405 (2006).
- Chen et al. (2011) H. Chen, C. L. Freeman, and J. H. Harding, Phys. Rev. B 84, 085108 (2011).
- Foyevtsova et al. (2019) K. Foyevtsova, I. Elfimov, J. Rottler, and G. A. Sawatzky, Phys. Rev. B 100, 165104 (2019).
- Mizokawa et al. (2000) T. Mizokawa, D. I. Khomskii, and G. A. Sawatzky, Phys. Rev. B 61, 11263 (2000).
- Mazin et al. (2007) I. I. Mazin, D. I. Khomskii, R. Lengsdorf, J. A. Alonso, W. G. Marshall, R. M. Ibberson, A. Podlesnyak, M. J. Martínez-Lope, and M. M. Abd-Elmeguid, Phys. Rev. Lett. 98, 176406 (2007).
- Park et al. (2012) H. Park, A. J. Millis, and C. A. Marianetti, Phys. Rev. Lett. 109, 156402 (2012).
- Johnston et al. (2014) S. Johnston, A. Mukherjee, I. Elfimov, M. Berciu, and G. A. Sawatzky, Phys. Rev. Lett. 112, 106404 (2014).
- Lau and Millis (2013) B. Lau and A. J. Millis, Phys. Rev. Lett. 110, 126404 (2013).
- Subedi et al. (2015) A. Subedi, O. E. Peil, and A. Georges, Phys. Rev. B 91, 075128 (2015).
- Green et al. (2016) R. J. Green, M. W. Haverkort, and G. A. Sawatzky, Physical Review B 94, 195127 (2016).
- Sawatzky and Green (2016) G. Sawatzky and R. Green, in Quantum Materials: Experiments and Theory, Modeling and Simulation, Vol. 6, edited by E. Pavarini, E. Koch, J. van den Brink, and G. Sawatzky (Forschungszentrum Jülich, Jülich, 2016) pp. 1.1–1.35.
- Mizokawa et al. (1995) T. Mizokawa, A. Fujimori, T. Arima, Y. Tokura, N. Mōri, and J. Akimitsu, Phys. Rev. B 52, 13865 (1995).
- Zaanen et al. (1985) J. Zaanen, G. A. Sawatzky, and J. W. Allen, Physical Review Letters 55, 418 (1985).
- Bisogni et al. (2016) V. Bisogni, S. Catalano, R. J. Green, M. Gibert, R. Scherwitzl, Y. Huang, V. N. Strocov, P. Zubko, S. Balandeh, J.-M. Triscone, G. Sawatzky, and T. Schmitt, Nature Communications 7, 13017 (2016).
- Kuiper et al. (1989) P. Kuiper, G. Kruizinga, J. Ghijsen, G. A. Sawatzky, and H. Verweij, Physical Review Letters 62, 221 (1989).
- Chen et al. (1991) C. T. Chen, F. Sette, Y. Ma, M. S. Hybertsen, E. B. Stechel, W. M. C. Foulkes, M. Schulter, S. W. Cheong, A. S. Cooper, L. W. Rupp, B. Batlogg, Y. L. Soo, Z. H. Ming, A. Krol, and Y. H. Kao, Physical Review Letters 66, 104 (1991).
- vanVeenendaal and Sawatzky (1994) M. A. vanVeenendaal and G. A. Sawatzky, Physical Review B 50, 11326 (1994).
- Piamonteze et al. (2005) C. Piamonteze, F. M. F. de Groot, H. C. N. Tolentino, A. Y. Ramos, N. E. Massa, J. A. Alonso, and M. J. Martínez-Lope, Physical Review B 71, 020406(R) (2005).
- Bodenthin et al. (2011) Y. Bodenthin, U. Staub, C. Piamonteze, M. García-Fernández, M. J. Martínez-Lope, and J. A. Alonso, Journal of Physics: Condensed Matter 23, 036002 (2011).
- Freeland et al. (2016) J. W. Freeland, M. Van Veenendaal, and J. Chakhalian, Journal of Electron Spectroscopy and Related Phenomena 208, 56 (2016).
- Abbate et al. (1991) M. Abbate, F. M. F. de Groot, J. C. Fuggle, A. Fujimori, Y. Tokura, Y. Fujishima, O. Strebel, M. Domke, G. Kaindl, J. Van Elp, B. T. Thole, G. A. Sawatzky, M. Sacchi, and N. Tsuda, Physical Review B 44, 5419 (1991).
- Montoro et al. (1999) L. A. Montoro, M. Abbate, E. C. Almeida, and J. M. Rosolen, Chemical Physics Letters 309, 14 (1999).
- Kang et al. (2007) J.-S. Kang, S. S. Lee, G. Kim, H. J. Lee, H. K. Song, Y. J. Shin, S. W. Han, C. Hwang, M. C. Jung, H. J. Shin, B. H. Kim, S. K. Kwon, and B. I. Min, Physical Review B 76, 195122 (2007).
- Eisebitt et al. (1993) S. Eisebitt, T. Boske, J. E. Rubensson, and W. Eberhardt, Physical Review B 47, 14103 (1993).
- Achkar et al. (2011a) A. J. Achkar, T. Z. Regier, H. Wadati, Y.-J. Kim, H. Zhang, and D. G. Hawthorn, Physical Review B 83, 081106(R) (2011a).
- Achkar et al. (2011b) A. J. Achkar, T. Z. Regier, E. J. Monkman, K. M. Shen, and D. G. Hawthorn, Scientific Reports 1, 0182 (2011b).
- de Groot et al. (1994) F. de Groot, M. Arrio, P. Sainctavit, C. Cartier, and C. Chen, Solid State Communications 92, 991 (1994).
- Kurian et al. (2012) R. Kurian, K. Kunnus, P. Wernet, S. M. Butorin, P. Glatzel, and F. M. F. de Groot, Journal of Physics: Condensed Matter 24, 452201 (2012).
- Green et al. (2014) R. J. Green, D. Peak, A. J. Achkar, J. S. Tse, A. Moewes, D. G. Hawthorn, and T. Z. Regier, Phys. Rev. Lett. 112, 129301 (2014).
- Note (1) For the Jahn-Teller case, our hopping integrals are , , , . All other parameters are the same as in Ref. \rev@citealpGreen2016, unless otherwise noted in the text.
- Wills and Harrison (1983) J. M. Wills and W. A. Harrison, Phys. Rev. B 28, 4363 (1983).