Yet another test of Radial Acceleration Relation for galaxy clusters
Abstract
We carry out a test of the radial acceleration relation (RAR) for galaxy clusters from two different catalogs compiled in literature, as an independent cross-check of two recent analyses, which reached opposite conclusions. The datasets we considered include a Chandra sample of 12 clusters and the X-COP sample of 12 clusters. For both the samples, we find that the residual scatter is small (0.11-0.14 dex), although the best-fit values for the Chandra sample have large error bars. Therefore, we argue that at least one of these cluster samples (X-COP) obeys the radial acceleration relation. However, since the best-fit parameters are discrepant with each other as well as the previous estimates, we argue that the RAR is not universal. For both the catalogs, the acceleration scale, which we obtain is about an order of magnitude larger than that obtained for galaxies, and is agreement with both the recent estimates.
I Introduction
Recently, two independent groups Chan and Del Popolo (2020); Tian et al. (2020a) carried out a test of the correlation between baryonic and total acceleration for two different cluster samples. This was motivated by the discovery of a strong deterministic relation, between the baryonic () and total acceleration () using 2693 data points from 153 rotationally supported spiral galaxies of different sizes and morphology, with a small scatter of 0.13 dex McGaugh et al. (2016); Lelli et al. (2016). This scatter is dominated by uncertainties in galaxy distance, disk inclination and the stellar mass-to-light ratio. Once these are marginalized over, the residuals around the fits have negligible scatter (of about 0.057 dex) Li et al. (2018). Note however that this aforementioned scatter was obtained by assuming that every galaxy obeys the mean RAR, followed by doing a separate fit for each of the 175 galaxies, followed by marginalizing over the aforementioned uncertainties. A similar relation has also been recently found for elliptical galaxies (Chae et al., 2020). This relation has been dubbed as the radial acceleration relation (RAR) and can be written as follows:
| (1) |
where McGaugh et al. (2016). This equation is closely related to the Mass Discrepancy-Acceleration relation McGaugh (2004), and is a trivial consequence of the MOND paradigm Famaey and McGaugh (2012); Milgrom (2016), and also subsumes the baryonic Tully-Fisher relation Lelli et al. (2017a); Wheeler et al. (2019). We note that a few groups have have questioned the existence of a fundamental acceleration scale in the same data Rodrigues et al. (2018a); Zobnina and Zasov (2020); Marra et al. (2020); Zhou et al. (2020). Although, some of these criticisms have been countered McGaugh et al. (2018); Kroupa et al. (2018), the debate is still on-going on some of these issues Rodrigues et al. (2018b); Rodrigues et al. (2020). There are mixed claims in the literature on whether this relation can be easily postdicted using the standard CDM paradigm Desmond (2017); Navarro et al. (2017); Dai and Lu (2017); Keller and Wadsley (2017); Garaldi et al. (2018); Ludlow et al. (2017); Stone and Courteau (2019), with the same negligible scatter as observed for real data. This relation can also be reproduced using alternative models such as Self-Interacting Dark matter Ren et al. (2019), superfluid dark matter Berezhiani et al. (2018), Moffat’s MOG Green and Moffat (2019), conformal gravity O’Brien et al. (2018), but is in tension with Verlinde’s entropic gravity Lelli et al. (2017b).
Motivated by these considerations, two independent groups Chan and Del Popolo (2020); Tian et al. (2020a) carried out a systematic observational test of the RAR using galaxy clusters. Galaxy clusters are the most massive collapsed objects in the universe, and have proved to be a wonderful laboratory for a wide range of topics from cosmology, tests of modified gravity, fundamental Physics (such as constraining neutrino and graviton mass) to galaxy evolution Voit (2005); Vikhlinin et al. (2014); Allen et al. (2011); Desai (2018). However, it has been known since a long time, that MOND does not work well for both relaxed as well as merging galaxy clusters The and White (1988); Gerbal et al. (1992); Aguirre et al. (2001); Sanders (2003); Pointecouteau and Silk (2005); Angus et al. (2008); Natarajan and Zhao (2008), and is also at odds with shape of the matter power spectrum Dodelson (2011). Many relativistic theories of MOND are also in tension due to the coincident gravitational wave and electro-magnetic observations from GW170817 (Boran et al., 2018).
Nevertheless, there was no detailed characterization of the RAR for clusters, prior to the two works Chan and Del Popolo (2020); Tian et al. (2020a). Despite the failures of MOND on cluster scales, a detailed characterization of the RAR for a large ensemble of galaxy clusters would be an acid test for some of the myriad models used to explain the same relation for galaxies. However, there are also no clear cut predictions for whether the RAR should be satisfied or not for galaxy clusters, except for a few works Famaey et al. (2018); Navarro et al. (2017), which predict that this relation should not be seen for galaxy clusters. We briefly discuss the results from these two observational tests of RAR for clusters.
Chan and Del Popolo Chan and Del Popolo (2020) (CDP20, hereafter) considered 52 non-cool-core clusters in hydrostatic equilibrium from the HIFLUGCS X-ray sample, based on ROSAT and ASCA observations Chen et al. (2007), with core-radius () greater than 100 kpc. The density of the hot gas was modeled using a single- profile Cavaliere and Fusco-Femiano (1978) and a constant temperature profile was assumed. Then assuming hydrostatic equilibrium, the total mass was calculated assuming spherical symmetry Allen et al. (2011). From the total mass, the total acceleration was estimated assuming Newtonian gravity Chan and Del Popolo (2020). Similarly, the baryonic acceleration was obtained from the baryonic mass (estimated by integrating the gas density profile). We note that the stellar mass was not included in their baryonic mass budget. CDP20 then checked for a correlation between the baryonic and total acceleration at four different positions (, , , ) for their sample. They found that the best-fit value for was , about ten times higher than the same found for spiral galaxies. Furthermore, their estimated residual scatter which they obtained when compared to the RAR is about 0.18 dex, and much higher than that for galaxies.
Around the same time, Tian et al Tian et al. (2020a) (T20, hereafter) tested this relation for a sample of 20 high-mass clusters from the CLASH survey Postman et al. (2012). These clusters have a combination of strong-lensing, weak lensing shear, and magnification data using HST and Suprime-Cam observations Umetsu et al. (2016); and gas temperatures and density profiles from both Chandra and XMM observations Donahue et al. (2014). The total mass was modeled as a sum of four distinct components: the total dark matter, X-ray emitting gas, non-BCG stellar mass and BCG stellar mass. The baryonic mass was obtained from the sum of the last three components. The dark matter mass was obtained from the NFW Navarro et al. (1997) density profile and mass-concentration relations from Umetsu et al. (2016). The X-ray gas mass was obtained from Donahue et al. (2014). The non-BCG stellar mass was obtained from the stellar mass fraction derived using the SPT sample Chiu et al. (2018). The BCG stellar mass was estimated by assuming an Hernquist profile Hernquist (1990) for the stellar mass distribution and assuming the the stellar mass estimates from Ref. Cooke et al. (2016). They looked for RAR by transforming and into log-log space, thereby converting it to a linear regression problem. They obtained an extremely tight scaling relation between the total and baryonic acceleration, with an intrinsic scatter of about 14%. This is comparable to the scatter obtained for the SPARC sample McGaugh et al. (2016). However, the best-fit value for was , about 20 times higher. They also explained the observed scatter using a semi-analytic galaxy formation model within CDM Olamaie et al. (2012). Therefore, although both of these works get about the same value for the acceleration scale, they disagree on whether the RAR exists for galaxy clusters with negligible scatter. We note that most recently, this group has also found evidence for a tight Baryonic Faber-Jackson relation for the HIFLUGCS cluster sample Tian et al. (2020b)
Given the contradictory findings between the two groups, we carry out a similar test of the RAR for two different cluster samples. The first dataset we analyze is a sample of 12 galaxy clusters with pointed Chandra and archival ROSAT observations which were carefully studied by Vikhlinin et al. (2005, 2006). This dataset has been used for testing a plethora of modified gravity theories (Rahvar and Mashhoon, 2014; Hodson and Zhao, 2017; Hodson et al., 2017; Edmonds et al., 2018, 2017; Bernal et al., 2017). We have also previously used this sample to constrain the graviton mass, test of constant halo surface density, and GR corrections to hydrostatic masses Gupta and Desai (2019, 2020); Gopika and Desai (2020).
We now provide a brief clarification of what we mean by a test of RAR for clusters. Although the moniker “RAR” (for spiral galaxies) usually refers to the empirical relation in Eq. 1 with the same value of as found in McGaugh et al. (2016), one can get very similar deterministic relations between and for other proposed MOND interpolating functions Famaey and McGaugh (2012). A test of these relations for spiral galaxies would also yield a very tight scatter, although the difference between these different functions could be discerned using the Halo Acceleration relation (Tian and Ko, 2019). Similarly, it is possible that for galaxy clusters, Eq. 1 could fit the data, albeit with a higher value for , similar to the value for found in the first ever test of MOND with clusters The and White (1988). To carry out a generic model-independent test, we note that Eq. 1 can be re-written as a linear regression equation between the logarithm of the total and baryonic acceleration (cf. Eq. 9). This is the same fit done in T20. Therefore, for the rest of this manuscript by “test of RAR”, implies a test of whether there exists a tight empirical scaling relation between the baryonic and total accelerations in logarithmic space, throughout the galaxy cluster. We shall also characterize the scatter in the residuals between the two accelerations, as well as determine the intrinsic scatter in the scaling relations. A separate question is whether this relation is universal, or in other words the different cluster samples yield the same best-fit values. We shall also test for the universality of this relation for our cluster samples.
II Basic considerations
We review the Physics, common to all galaxy cluster samples, needed to estimate the total acceleration as well as the baryonic acceleration.
In the first step, we calculate the total mass from equation of hydrostatic equilibrium, which can be applied if the clusters are relaxed. The systematic uncertainty in this assumption is about 15-20% Biffi et al. (2016). If the parametric forms for the gas temperature and gas density profiles are given, the total acceleration at given radius from the cluster center can be derived from positing an ideal gas equation of state Allen et al. (2011):
| (2) |
where denotes the gas mass density, is the cluster temperature, is the mass of the proton, and is the mean molecular weight of the cluster in a.m.u. and is approximately equal to 0.6 Vikhlinin et al. (2005); Rahvar and Mashhoon (2014). Alternately, if the total total mass () is known, then the total acceleration is given by:
| (3) |
In order to obtain the baryonic acceleration, we need to estimate the total mass in baryons, which consists of hot diffuse gas in the intra-cluster medium and stars. The gas mass is obtained by integrating the gas density profile:
| (4) |
We note that the aforementioned estimates of gas mass and the total mass assume spherical symmetry. Errors due to this assumption can be upto 5% Gopika and Desai (2020). There are multiple methods to obtain the star mass in galaxy clusters Lin et al. (2012); Chiu et al. (2018). We use the method in Lin et al. (2012). This entails calculating the total mass () within a radius with an overdensity of 500, called . We then use the following empirical relation to obtain the star mass at Lin et al. (2012).
| (5) |
This equation yields the star mass at . The star mass at any other radius can be obtained by assuming an isothermal profile Rahvar and Mashhoon (2014). We note that since the stellar mass contribution is negligible, errors due to stellar mass estimate should not dominate the total budget and are neglected.
The baryonic acceleration is then given by
| (6) |
III Chandra X-ray cluster sample
Vikhlinin et al Vikhlinin et al. (2005, 2006) provided gas density and temperature profiles for 13 different clusters, using measurements from the pointed or archival observations with the Chandra and ROSAT X-ray satellites. For our analysis we use 12 of these clusters, viz. A133, A262, A383, A478, A907, A1413, A1795, A1991, A2029, A2390, MKW4, RXJ1159+55531, since errors for one of them were not available. The redshifts of these clusters range approximately upto . These measurements extended up to very large radii of about for some of the clusters. The typical exposure times ranged from 30-130 ksecs. The temperatures span the range between 1 and 10 keV and masses from . More details of the observations, data reduction, and estimation of temperature and density profiles have been discussed in Vikhlinin et al. (2006). This dataset has been used for testing a plethora of modified gravity theories (Rahvar and Mashhoon, 2014; Hodson and Zhao, 2017; Hodson et al., 2017; Edmonds et al., 2018, 2017; Bernal et al., 2017; Gupta and Desai, 2019). We note that although the first test of RAR for this sample was done in Edmonds et al. (2018), no error analysis in the observed accelerations was taken into account in that analysis. They considered 250 radii points starting at 10 pc and extending to 2.5 kpc in increments of 10 pc (D. Edmonds, private communication). Also the stellar mass was not included in their estimation of baryonic mass. Based on a visual inspection of the scatter plot between and , Edmonds et al. (2018) asserted that there is a large scatter about the RAR. However, since no error bars were included in that work, no quantitative estimate of the intrinsic scatter was done.
The gas density () model used for this sample is the double-beta profile Vikhlinin et al. (2006) and is equal to , where is the proton mass and the product of electron and proton densities () is given by the double- profile:
| (7) |
The explanation and values for each of the terms in Eq. 7 can be found in the original works by Vikhlinin Vikhlinin et al. (2009). The temperature profile is given by:
| (8) |
where . The physical explanation of the eight free parameters and their values for the clusters can be found in Vikhlinin et al. (2006); Rahvar and Mashhoon (2014). The observed values of along with their error bars at various points from the cluster center were provided for the 12 clusters by A. Vikhlinin (private communication).
We now plug in the values for and from Eqns. 7 and 8 respectively in Eq. 2 to calculate the total acceleration . The errors were obtained by propagating the errors provided in V06. We then estimate the baryonic mass from the sum of gas mass (obtained from Eq. 4) and star mass (obtained from Eq. 5).
Therefore, from Eqns. 2 and 6, and can be calculated at any distance from the cluster center. As mentioned earlier, CDP20 have done this test at different radii for the various clusters at integer multiples of , whereas T20 have stacked data from the CLASH cluster sample (of about 10-18 clusters) at four different radii, with a total of 64 datapoints.
Here, we do a joint fit to the RAR using the data for and using data at three different radii: 200 kpc, 500 kpc, and 1000 kpc . Similar to T20, we do a fit in log-acceleration space by doing a linear regression to the relation:
| (9) |
where and . We then maximize a log-likelihood given by :
| (10) | |||||
| (11) |
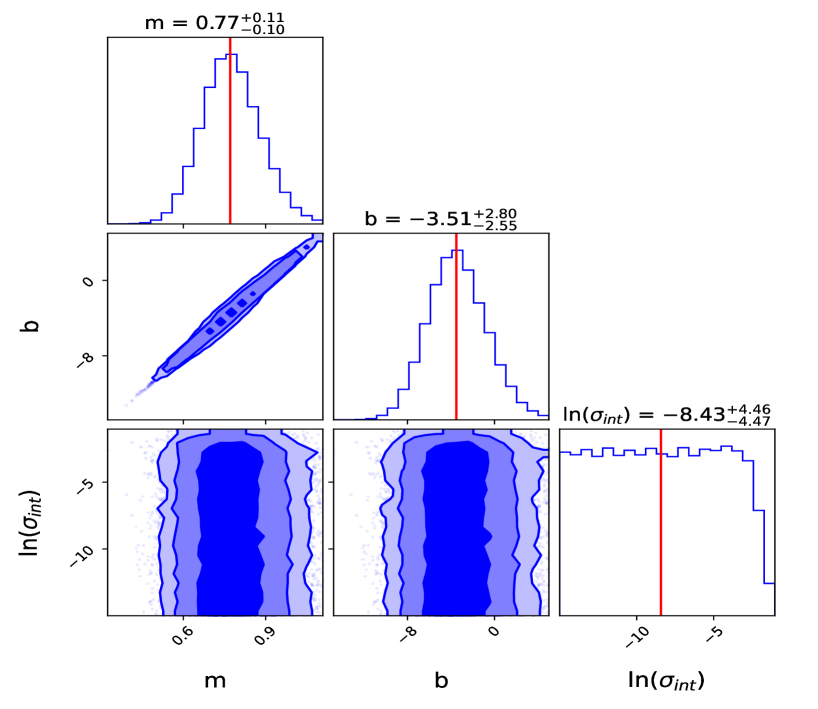
Here, and denote the errors in and respectively; is the intrinsic scatter for our linear relation between the logarithms of the accelerations, which is a free parameter. We used the emcee MCMC sampler Foreman-Mackey et al. (2013) to maximize Eq. 10. Our best-fit values for and are shown in Table 1, along with the corresponding fits from CDP20 and T20. The 68%, 90% and 99% marginalized confidence intervals for , , and can be found in Fig. 2. Although the intrinsic scatter is small, the error on the intercept is quite large. As we can see, the 1-D marginalized credible interval for remains flat. We also verified that alternate samplers such as Nestle111http://kylebarbary.com/nestle/ and analytical optimizaion routines return the same best-fit as emcee to within error bars, as well as similar credible intervals. As the contribution to the total scatter from the best-fit value of is negligible, smaller values for will not change the likelihood. That explains the flatness of the marginalized distribution of . Our slope and intercept are discrepant compared to T20 at about and respectively.
In order to compare the tightness of our RAR relation for this sample, we also calculate the residual scatter in dex to directly compare with the results in CDP20 and T20 (and also McGaugh et al. (2016); Li et al. (2018)), who used a similar procedure to characterize the scatter. The residuals are given by , where is the expected total acceleration obtained from the best-fit RAR. These binned residuals (using four bins) are then fitted to a Gaussian and the standard deviation of this Gaussian distribution gives the residual scatter in dex. When we fit these residuals for the Chandra sample to a Gaussian distribution, we get dex. However, we find that the residuals are asymmetric with longer tails at negative values for the residuals. Therefore, instead of the Gaussian , we use the scale parameter obtained using the normalized median absolute deviation, , (computed using the astropy Astropy Collaboration et al. (2018) library) to parametrize the residual scatter. This value is given by . Therefore, the residual scatter for the Chandra sample is equal to 0.14 dex.
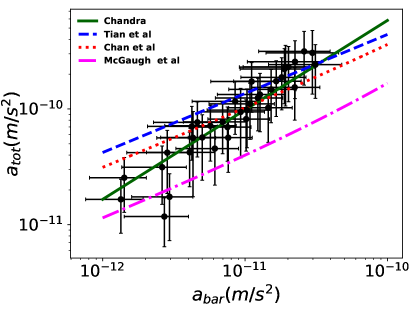
We overlay our best-fit values along with the same from T20 and CDP20, as well as the RAR found from the SPARC sample McGaugh et al. (2016) in Fig. 1. Because of the large errors, both T20 and CDP20 fits pass through the data points. However, despite the large errors, the RAR obtained from SPARC sample is below most of the data points.
To determine the acceleration scale , similar to T20, we fix the slope in the regression relation in Eq. 9 to be equal to 0.5. This way the RAR relation (Eq. 1) in the low acceleration limit becomes . From this relation it is trivial to derive the Baryonic Tully-Fisher or Faber-Jackson relations Famaey and McGaugh (2012). The resulting value of is equal to . Therefore, similar to T20 and CDP20, the value of is about an order of magnitude larger than obtained using galaxies McGaugh et al. (2016). Our estimated value for agrees within our errors with the estimate in CDP20.
IV X-COP sample
X-COP (XMM-Newton Cluster Outskirts Project) (PI: D.Eckert) is a very large program on XMM-Newton dedicated to studying X-ray emission in cluster outskirts. The X-COP project targeted a sample of massive 12 galaxy clusters () in the redshift range of selected from the Planck all-sky Sunyaev-Zel’dovich (SZ) catalog Planck Collaboration et al. (2014). These selected clusters had a signal-to-noise ratio cutoff of 12. The detailed cluster selection criterion is outlined in Ghirardini et al. (2019). The final clusters included in this project are - A85, A644, A1644, A1795, A2029, A2142, A2255, A2319, A3158, A3266, RXC1825, and ZW1215. Eckert et al. (2017). The main goal of this project is to reconstruct the ICM properties upto . More details on the XCOP sample and associated science results using this sample can be found in Ettori et al. (2019); Ghirardini et al. (2019, 2018); Ettori et al. (2020); Ghizzardi et al. (2020a). This cluster sample has also been used to test modified theories of gravity, which dispense with dark matter such as MOND and Verlinde’s emergent gravity Ettori et al. (2019).
For all the clusters in the X-COP sample, the gas density has been obtained from the deprojected XMM surface brightness profile. The temperature is obtained from the deprojected XMM spectral estimates. The SZ (Sunyaev-Zel’dovich) Sunyaev and Zeldovich (1970) effect provides a direct measurement of the thermal electron pressure integrated along the line of sight. The pressure profile is recovered from the SZ signal measured in the all-sky survey by the Planck SZ survey. Planck Collaboration et al. (2016); Ghirardini et al. (2018). The gas pressure has a smooth spatial distribution along the azimuth except for the clusters which are undergoing a merger. From the ideal gas relation, one can deduce the pressure of the gas, when only spectral measurements are available. Similarly the temperature can be obtained using pressure obtained from deconvolution of Planck measurements, when spectral measurements are not available Ghirardini et al. (2019). Parametric temperature and pressure profiles for the XCOP samples can be found in Ghirardini et al. (2019).
Mass profiles have been calculated using multiple methods for the X-COP sample, as documented in Ghirardini et al. (2018). The total mass and gas mass profiles, obtained using the backward method (with NFW model as reference), can be downloaded from the web, and are readily available in .fits files for all the clusters222X-COP Data: https://dominiqueeckert.wixsite.com/xcop/data. The relative errors in mass measurements were less than 8% Ettori et al. (2019). For our work, these were used to obtain the total mass. To obtain the gas mass, the data in the files on the aforementioned website titled Gas mass and gas fraction profile were used. The gas density can be obtained from using , with Ettori et al. (2019); Eckert et al. (2019). The electron number density (), as mentioned earlier has been estimated from the deprojected XMM surface brightness profile.
The stellar mass profiles are available for seven of the galaxy clusters Ghizzardi et al. (2020b). Accordingly, we used them for these seven clusters, whereas for the remaining five clusters, Eq. 5 has been used to obtain the stellar mass. In order to obtain the (baryonic as well as total) mass estimates at any arbitrary radius, we interpolate the different quantities using quadratic spline interpolations, and then calculated their values at 100, 200, 400, and 1000 kpc. Then, is obtained using Eq. 6 and is obtained using Eq. 3. The XCOP website also provides errors for all the measurements, which we include for our analysis. We note that these errors do not account for non-thermal contributions to gas pressure and departures from spherical symmetry and hydrostatic equilibrium Ettori et al. (2019).
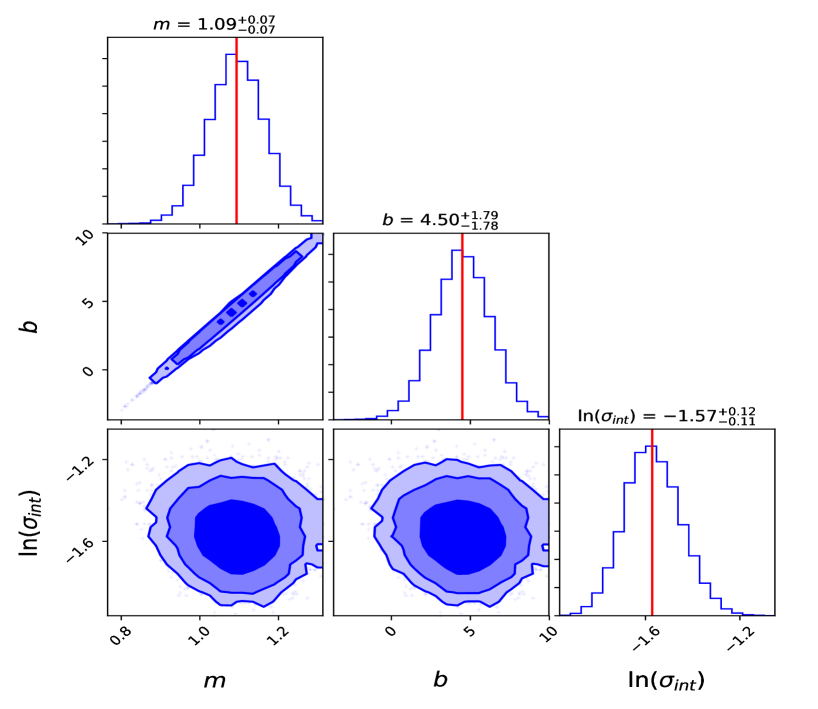
To find the best-fit values for the linear regression relation between and , we maximize the same likelihood as in Eq 10. Our best-fit values are shown in Table 1. The 68%, 90%, and 99% confidence intervals for the slope, intercept, and natural log of intrinsic scatter are shown in Fig. 4. Both the slope and intercept differ from T20 by about . We find an intrinsic scatter of about 21%, which is of the same order of magnitude as found in T20. We also computed the residual scatter using the same method as in Sect. III, by fitting a Gaussian distribution to difference in of the total and baryonic accelerations and computing its standard deviation. For computation of the residual scatter for XCOP clusters, we binned the residuals into four bins. Then, residual scatter was calculated as the standard deviation of the best fit gaussian to the binned residuals. We find that residual scatter computed using this method is equal to 0.11 dex, which is also comparable to T20. Therefore, we find that the X-COP sample obeys the RAR.
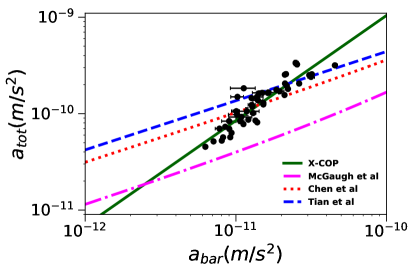
The best-fit RAR for our cluster sample along with those found in T20 and C20 are shown in Fig. 3. We also show that the RAR found using the cluster sample. If we fix the slope to 0.5, the best-fit value of is equal to . This value is mid-way between the estimates in CDP20 and T20, and is also about an order of magnitude larger than that for galaxies.
| Cluster Sample | Slope | Intercept | Intrinsic Scatter | Residual Scatter (dex) | |
|---|---|---|---|---|---|
| Chandra (this work) | ()% | 0.14 | |||
| X-COP (this work) | 0.11 | ||||
| CLASH Tian et al. (2020a) | 0.11 | ||||
| HIFLUGCS | 0.13 |
V Comparison of results
In Sects. III and IV, we carried out a test of RAR in the same way as in T20 for the Chandra and X-COP cluster samples, respectively by fitting to Eq. 9. We have already compared our results for the slope and intercept of these samples to those for the CLASH sample obtained in T20. However, a direct comparison of our results with the analysis in CDP20 cannot be trivially done, since CDP20 used the original RAR relation for spiral galaxies (Eq. 1), instead of Eq. 9.
Therefore, in order to bring the results from all the cluster samples to a common footing, we reanalyze the same dataset as in CDP20, using the same procedure as for the other samples. We select a sample of 52 non-cool core clusters from the dataset analyzed in Chen et al. (2007), by applying the condition that the cooling time, Gyr (Chen et al., 2007) and , similar to CDP20. For the baryonic mass, we also included the stellar mass using Eq. 5. Then, we evaluated and at 100, 200, 400, and 1000 kpc. The best-fit slope, intercept, and intrinsic scatter were then determined using Eq. 9. Our best-fit values for the slope, intercept, and intrinsic scatter for this sample are shown in Table 1. The residual scatter, which we get for this sample is 0.13 dex. Note however that in this table for this sample is the same as the estimate in CDP20. We get an intrinsic scatter of about 27%. Our slope and intercept for the Chandra sample is consistent with the HIFLUGCS sample to within . However, the X-COP slope and intercept are discrepant with respect to our re-estimate of the HIFLUGCS sample at about 4 and 4.3 respectively.
Therefore, we find that the X-COP sample and the CLASH sample analyzed in T20 show comparable scatter, indicating that RAR is obeyed for the X-COP sample. However, the HIFLUGS sample (analyzed in CDP20) and the Chandra samples (analyzed in this work) either show a high intrinsic scatter in the RAR, or have large error bars for the slope and the intercept. However the slopes and intercepts for the X-COP and HIFLUGS sample are discrepant with respect to each other, which implies that RAR is not universal for clusters.
We now discuss, if the discrepancy between the CDP20 result and the other analyses could be attributed to different assumptions. CDP20 did not include the stellar mass in the baryonic mass budget. However, our re-analysis of CDP20, which includes the stellar mass contributions shows a residual scatter comparable to the CLASH and X-COP sample. Another difference between the T20 and the other three analyses is that T20 included the BCG stellar mass contribution. However, the contribution of BCG stellar mass is dominant only at distances close to the cluster center, whereas the RAR analysis for the other three samples is done at distances far from the center, where the BCG stellar mass contribution is less than 1% (Tian et al., 2020a; Umetsu et al., 2016).
Nevertheless, T20 have found that the total stellar mass is important for the CLASH cluster sample within 200 kpc. If only the gas mass is used for their analysis, then the slope of the RAR is different from the estimated baryonic acceleration and the scatter will also be larger (Yong Tian, private communication). To investigate the effect of stellar mass, we redid our analysis for the X-COP sample (as it had smaller errors), without including the contribution of stellar mass to the total baryonic mass budget. We find that the new slope is given by and , which is about (slope) and (intercept) different, compared to the inclusion of stellar mass. Without stellar mass, the intrinsic scatter which we obtain is 39% and the residual scatter is 0.17 dex. Therefore, both the scatters are also increased if the stellar mass contribution is not included. We also computed the residual scatter in our re-analysis of HIFLUGS data, by excluding the stellar mass contribution. Upon doing that, we get a residual scatter of 0.15 dex, based on the Gaussian standard deviation, which is larger than the 0.13 dex residual scatter which we obtain after inclusion of stellar mass. Therefore, we can conclude that excluding the stellar mass does increase the scatter and could be one of the reasons for the large scatter in CDP20.
VI Conclusions
Recently, two independent groups (CDP20 and T20) carried out a systematic test of a possible deterministic relation between the baryonic and total acceleration for galaxy clusters, known in the astrophysical literature as RAR. This was motivated by the very tight scatter found from a similar test done for spiral galaxies using the SPARC sample McGaugh et al. (2016). T20 did this test with the CLASH cluster sample using a combination of strong lensing, weak lensing and X-ray measurements, whereas CDP20 used the hydrostatic masses of the non-cool core clusters from the ROSAT dataset. T20 found a tight empirical correlation between the two, with a slope consistent with the low-acceleration limit found for galaxies. However, they find an acceleration scale about ten times higher than for galaxies. However, CDP20 found a large residual scatter about the RAR of about 0.18 dex, and a higher acceleration scale about 4-10 times larger. Therefore, the CDP20 analysis shows that galaxy clusters do not obey the RAR.
Given the somewhat contradictory nature of the two results, we carry out an independent test of the same relation using two different cluster samples. The first sample is a dataset of 12 clusters imaged using Chandra telescope by Vikhlinin et al. The second sample which we use is the X-COP sample, in which a subset of 12 Planck-SZ clusters with a high SNR were imaged using the XMM-Newton telescope. For both these samples, we carry out a linear regression relation between the natural log of baryonic and the same for total acceleration. We also re-analyzed the HIFLUGCS cluster sample used in CDP20, using the same regression relation used for the Chandra and X-COP sample, and also by including the stellar mass contribution in the baryonic mass budget. We characterize the tightness of the RAR by computing both the intrinsic scatter and the residual scatter (in dex).
For the Chandra sample, we find that the slope and intercept disagree with the estimates in T20 at about 2.2. However, they agree with the sample analyzed in CDP20 to within 1. The residual scatter which we get is about 0.14 dex. The X-COP sample (which has much smaller mass errors compared to the Chandra sample) disagrees with the estimates for both the slope and intercept, when compared to the T20 and CDP20 estimates at about and , respectively. The residual scatter which we get for this sample is about the same as T20 (0.11 dex). The intrinsic scatter which we obtain for the X-COP sample is about 20%, which is about the same as that obtained in T20
Therefore, we conclude that the X-COP sample obeys the RAR in agreement with the conclusions of T20. The best-fit errors for the Chandra sample are somewhat large, and hence a decisive statement cannot be made for this sample.
However, given the differences in the best fits for the slopes and intercepts between the different cluster samples, we find that this relation is not universal for clusters.
We also find that exclusion of stellar mass changes the intercept and slope by about , and also increases both the residual and intrinsic scatter. This may explain the high residual scatter seen in CDP20.
If we assume that the total acceleration scales as the square root of the baryonic acceleration, then the characteristic acceleration scale we obtain is about the same order of magnitude as that obtained in T20 and CDP20, which is about an order of magnitude larger than what found using the SPARC sample.
Looking to the future, a more definitive test should soon be possible with the recent launch of the eROSITA X-ray satellite Predehl et al. (2020), which should provide X-ray measurements for about 100,000 clusters, along with lensing and other mass estimates from follow-up programs, which would allow high precision measurements of both the baryonic as well as the total mass.
Acknowledgements.
We are grateful to Stefano Ettori and Dominik Eckert for providing the data and answering all our questions regarding the X-COP sample; Alexey Vikhlinin for the same regarding the Chandra sample; Doug Edmonds, Yong Tian, Man-Ho Chan, and Antonio Del Popolo for helpful correspondence. The work of Sajal Gupta was supported by a DST-INSPIRE fellowship. We also thank the anonymous referee for several constructive comments on our manuscript.References
- Chan and Del Popolo (2020) M. H. Chan and A. Del Popolo, Mon. Not. R. Astron. Soc. p. 218 (2020), eprint 2001.06141.
- Tian et al. (2020a) Y. Tian, K. Umetsu, C.-M. Ko, M. Donahue, and I. N. Chiu, Astrophys. J. 896, 70 (2020a), eprint 2001.08340.
- McGaugh et al. (2016) S. S. McGaugh, F. Lelli, and J. M. Schombert, Phys. Rev. Lett. 117, 201101 (2016), eprint 1609.05917.
- Lelli et al. (2016) F. Lelli, S. S. McGaugh, and J. M. Schombert, Astron. J. 152, 157 (2016), eprint 1606.09251.
- Li et al. (2018) P. Li, F. Lelli, S. McGaugh, and J. Schombert, Astron. & Astrophys. 615, A3 (2018), eprint 1803.00022.
- Chae et al. (2020) K.-H. Chae, M. Bernardi, H. Dominguez Sanchez, and R. K. Sheth, arXiv e-prints arXiv:2010.10779 (2020), eprint 2010.10779.
- McGaugh (2004) S. S. McGaugh, Astrophys. J. 609, 652 (2004), eprint astro-ph/0403610.
- Famaey and McGaugh (2012) B. Famaey and S. S. McGaugh, Living Reviews in Relativity 15, 10 (2012), eprint 1112.3960.
- Milgrom (2016) M. Milgrom, arXiv e-prints arXiv:1609.06642 (2016), eprint 1609.06642.
- Lelli et al. (2017a) F. Lelli, S. S. McGaugh, J. M. Schombert, and M. S. Pawlowski, Astrophys. J. 836, 152 (2017a), eprint 1610.08981.
- Wheeler et al. (2019) C. Wheeler, P. F. Hopkins, and O. Doré, Astrophys. J. 882, 46 (2019), eprint 1803.01849.
- Rodrigues et al. (2018a) D. C. Rodrigues, V. Marra, A. del Popolo, and Z. Davari, Nature Astronomy 2, 668 (2018a), eprint 1806.06803.
- Zobnina and Zasov (2020) D. I. Zobnina and A. V. Zasov, Astronomy Reports 64, 295 (2020), eprint 2003.08845.
- Marra et al. (2020) V. Marra, D. C. Rodrigues, and Á. O. F. de Almeida, Mon. Not. R. Astron. Soc. 494, 2875 (2020), eprint 2002.03946.
- Zhou et al. (2020) Y. Zhou, A. Del Popolo, and Z. Chang, Physics of the Dark Universe 28, 100468 (2020), eprint 2008.04065.
- McGaugh et al. (2018) S. S. McGaugh, P. Li, F. Lelli, and J. M. Schombert, Nature Astronomy 2, 924 (2018).
- Kroupa et al. (2018) P. Kroupa, I. Banik, H. Haghi, A. H. Zonoozi, J. Dabringhausen, B. Javanmardi, O. Müller, X. Wu, and H. Zhao, Nature Astronomy 2, 925 (2018), eprint 1811.11754.
- Rodrigues et al. (2018b) D. C. Rodrigues, V. Marra, A. Del Popolo, and Z. Davari, Nature Astronomy 2, 927 (2018b), eprint 1811.05882.
- Rodrigues et al. (2020) D. C. Rodrigues, V. Marra, A. Del Popolo, and Z. Davari, Nature Astronomy 4, 134 (2020), eprint 2002.01970.
- Desmond (2017) H. Desmond, Mon. Not. R. Astron. Soc. 464, 4160 (2017), eprint 1607.01800.
- Navarro et al. (2017) J. F. Navarro, A. Benítez-Llambay, A. Fattahi, C. S. Frenk, A. D. Ludlow, K. A. Oman, M. Schaller, and T. Theuns, Mon. Not. R. Astron. Soc. 471, 1841 (2017), eprint 1612.06329.
- Dai and Lu (2017) D.-C. Dai and C. Lu, Phys. Rev. D 96, 124016 (2017), eprint 1712.01654.
- Keller and Wadsley (2017) B. W. Keller and J. W. Wadsley, Astrophys. J. Lett. 835, L17 (2017), eprint 1610.06183.
- Garaldi et al. (2018) E. Garaldi, E. Romano-Díaz, C. Porciani, and M. S. Pawlowski, Phys. Rev. Lett. 120, 261301 (2018), eprint 1712.04448.
- Ludlow et al. (2017) A. D. Ludlow, A. Benítez-Llambay, M. Schaller, T. Theuns, C. S. Frenk, R. Bower, J. Schaye, R. A. Crain, J. F. Navarro, A. Fattahi, et al., Phys. Rev. Lett. 118, 161103 (2017), eprint 1610.07663.
- Stone and Courteau (2019) C. Stone and S. Courteau, Astrophys. J. 882, 6 (2019), eprint 1908.06105.
- Ren et al. (2019) T. Ren, A. Kwa, M. Kaplinghat, and H.-B. Yu, Physical Review X 9, 031020 (2019), eprint 1808.05695.
- Berezhiani et al. (2018) L. Berezhiani, B. Famaey, and J. Khoury, JCAP 2018, 021 (2018), eprint 1711.05748.
- Green and Moffat (2019) M. A. Green and J. W. Moffat, Physics of the Dark Universe 25, 100323 (2019), eprint 1905.09476.
- O’Brien et al. (2018) J. G. O’Brien, T. L. Chiarelli, and P. D. Mannheim, Physics Letters B 782, 433 (2018), eprint 1704.03921.
- Lelli et al. (2017b) F. Lelli, S. S. McGaugh, and J. M. Schombert, Mon. Not. R. Astron. Soc. 468, L68 (2017b), eprint 1702.04355.
- Voit (2005) G. M. Voit, Reviews of Modern Physics 77, 207 (2005), eprint astro-ph/0410173.
- Vikhlinin et al. (2014) A. A. Vikhlinin, A. V. Kravtsov, M. L. Markevich, R. A. Sunyaev, and E. M. Churazov, Physics Uspekhi 57, 317-341 (2014).
- Allen et al. (2011) S. W. Allen, A. E. Evrard, and A. B. Mantz, Ann. Rev. Astron. Astrophys. 49, 409 (2011), eprint 1103.4829.
- Desai (2018) S. Desai, Physics Letters B 778, 325 (2018), eprint 1708.06502.
- The and White (1988) L. S. The and S. D. M. White, Astron. J. 95, 1642 (1988).
- Gerbal et al. (1992) D. Gerbal, F. Durret, M. Lachieze-Rey, and G. Lima-Neto, Astron. & Astrophys. 262, 395 (1992).
- Aguirre et al. (2001) A. Aguirre, J. Schaye, and E. Quataert, Astrophys. J. 561, 550 (2001), eprint astro-ph/0105184.
- Sanders (2003) R. H. Sanders, Mon. Not. R. Astron. Soc. 342, 901 (2003), eprint astro-ph/0212293.
- Pointecouteau and Silk (2005) E. Pointecouteau and J. Silk, Mon. Not. R. Astron. Soc. 364, 654 (2005), eprint astro-ph/0505017.
- Angus et al. (2008) G. W. Angus, B. Famaey, and D. A. Buote, Mon. Not. R. Astron. Soc. 387, 1470 (2008), eprint 0709.0108.
- Natarajan and Zhao (2008) P. Natarajan and H. Zhao, Mon. Not. R. Astron. Soc. 389, 250 (2008), eprint 0806.3080.
- Dodelson (2011) S. Dodelson, International Journal of Modern Physics D 20, 2749 (2011), eprint 1112.1320.
- Boran et al. (2018) S. Boran, S. Desai, E. O. Kahya, and R. P. Woodard, Phys. Rev. D 97, 041501 (2018), eprint 1710.06168.
- Famaey et al. (2018) B. Famaey, J. Khoury, and R. Penco, JCAP 2018, 038 (2018), eprint 1712.01316.
- Chen et al. (2007) Y. Chen, T. H. Reiprich, H. Böhringer, Y. Ikebe, and Y. Y. Zhang, Astron. & Astrophys. 466, 805 (2007), eprint astro-ph/0702482.
- Cavaliere and Fusco-Femiano (1978) A. Cavaliere and R. Fusco-Femiano, Astron. & Astrophys. 70, 677 (1978).
- Postman et al. (2012) M. Postman, D. Coe, N. Benítez, L. Bradley, T. Broadhurst, M. Donahue, H. Ford, O. Graur, G. Graves, S. Jouvel, et al., Astrophys. J. Suppl. Ser. 199, 25 (2012), eprint 1106.3328.
- Umetsu et al. (2016) K. Umetsu, A. Zitrin, D. Gruen, J. Merten, M. Donahue, and M. Postman, Astrophys. J. 821, 116 (2016), eprint 1507.04385.
- Donahue et al. (2014) M. Donahue, G. M. Voit, A. Mahdavi, K. Umetsu, S. Ettori, J. Merten, M. Postman, A. Hoffer, A. Baldi, D. Coe, et al., Astrophys. J. 794, 136 (2014), eprint 1405.7876.
- Navarro et al. (1997) J. F. Navarro, C. S. Frenk, and S. D. M. White, Astrophys. J. 490, 493 (1997), eprint astro-ph/9611107.
- Chiu et al. (2018) I. Chiu, J. J. Mohr, M. McDonald, S. Bocquet, S. Desai, M. Klein, H. Israel, M. L. N. Ashby, A. Stanford, B. A. Benson, et al., Mon. Not. R. Astron. Soc. 478, 3072 (2018), eprint 1711.00917.
- Hernquist (1990) L. Hernquist, Astrophys. J. 356, 359 (1990).
- Cooke et al. (2016) K. C. Cooke, C. P. O’Dea, S. A. Baum, G. R. Tremblay, I. G. Cox, and M. Gladders, Astrophys. J. 833, 224 (2016), eprint 1610.05310.
- Olamaie et al. (2012) M. Olamaie, M. P. Hobson, and K. J. B. Grainge, Mon. Not. R. Astron. Soc. 423, 1534 (2012), eprint 1109.2834.
- Tian et al. (2020b) Y. Tian, P.-C. Yu, P. Li, S. S. McGaugh, and C.-M. Ko, arXiv e-prints arXiv:2010.00992 (2020b), eprint 2010.00992.
- Vikhlinin et al. (2005) A. Vikhlinin, M. Markevitch, S. S. Murray, C. Jones, W. Forman, and L. Van Speybroeck, Astrophys. J. 628, 655 (2005), eprint astro-ph/0412306.
- Vikhlinin et al. (2006) A. Vikhlinin, A. Kravtsov, W. Forman, C. Jones, M. Markevitch, S. S. Murray, and L. Van Speybroeck, Astrophys. J. 640, 691 (2006), eprint astro-ph/0507092.
- Rahvar and Mashhoon (2014) S. Rahvar and B. Mashhoon, Phys. Rev. D 89, 104011 (2014), eprint 1401.4819.
- Hodson and Zhao (2017) A. O. Hodson and H. Zhao, Astron. & Astrophys. 598, A127 (2017), eprint 1701.03369.
- Hodson et al. (2017) A. O. Hodson, H. Zhao, J. Khoury, and B. Famaey, Astron. & Astrophys. 607, A108 (2017), eprint 1611.05876.
- Edmonds et al. (2018) D. Edmonds, D. Farrah, D. Minic, Y. J. Ng, and T. Takeuchi, International Journal of Modern Physics D 27, 1830001-296 (2018), eprint 1709.04388.
- Edmonds et al. (2017) D. Edmonds, D. Farrah, C. M. Ho, D. Minic, Y. J. Ng, and T. Takeuchi, International Journal of Modern Physics A 32, 1750108 (2017), eprint 1601.00662.
- Bernal et al. (2017) T. Bernal, V. H. Robles, and T. Matos, Mon. Not. R. Astron. Soc. 468, 3135 (2017), eprint 1609.08644.
- Gupta and Desai (2019) S. Gupta and S. Desai, Classical and Quantum Gravity 36, 105001 (2019), eprint 1811.09378.
- Gupta and Desai (2020) S. Gupta and S. Desai, Physics of the Dark Universe 28, 100499 (2020), eprint 1909.07408.
- Gopika and Desai (2020) K. Gopika and S. Desai, Physics of the Dark Universe 30, 100707 (2020), eprint 2006.12320.
- Tian and Ko (2019) Y. Tian and C.-M. Ko, Mon. Not. R. Astron. Soc. 488, L41 (2019), eprint 1907.04501.
- Biffi et al. (2016) V. Biffi, S. Borgani, G. Murante, E. Rasia, S. Planelles, G. L. Granato, C. Ragone-Figueroa, A. M. Beck, M. Gaspari, and K. Dolag, Astrophys. J. 827, 112 (2016), eprint 1606.02293.
- Lin et al. (2012) Y.-T. Lin, S. A. Stanford, P. R. M. Eisenhardt, A. Vikhlinin, B. J. Maughan, and A. Kravtsov, Astrophys. J. Lett. 745, L3 (2012), eprint 1112.1705.
- Vikhlinin et al. (2009) A. Vikhlinin, R. A. Burenin, H. Ebeling, W. R. Forman, A. Hornstrup, C. Jones, A. V. Kravtsov, S. S. Murray, D. Nagai, H. Quintana, et al., Astrophys. J. 692, 1033 (2009), eprint 0805.2207.
- Foreman-Mackey et al. (2013) D. Foreman-Mackey, D. W. Hogg, D. Lang, and J. Goodman, Publ. Astron. Soc. Pac. 125, 306 (2013), eprint 1202.3665.
- Astropy Collaboration et al. (2018) Astropy Collaboration, A. M. Price-Whelan, B. M. Sipőcz, H. M. Günther, P. L. Lim, S. M. Crawford, S. Conseil, D. L. Shupe, M. W. Craig, N. Dencheva, et al., Astron. J. 156, 123 (2018), eprint 1801.02634.
- Planck Collaboration et al. (2014) Planck Collaboration, P. A. R. Ade, N. Aghanim, C. Armitage-Caplan, M. Arnaud, M. Ashdown, F. Atrio-Barand ela, J. Aumont, H. Aussel, C. Baccigalupi, et al., Astron. & Astrophys. 571, A29 (2014), eprint 1303.5089.
- Ghirardini et al. (2019) V. Ghirardini, D. Eckert, S. Ettori, E. Pointecouteau, S. Molendi, M. Gaspari, M. Rossetti, S. De Grandi, M. Roncarelli, H. Bourdin, et al., Astron. & Astrophys. 621, A41 (2019), eprint 1805.00042.
- Eckert et al. (2017) D. Eckert, S. Ettori, E. Pointecouteau, S. Molendi, S. Paltani, and C. Tchernin, Astronomische Nachrichten 338, 293 (2017), eprint 1611.05051.
- Ettori et al. (2019) S. Ettori, V. Ghirardini, D. Eckert, E. Pointecouteau, F. Gastaldello, M. Sereno, M. Gaspari, S. Ghizzardi, M. Roncarelli, and M. Rossetti, Astron. & Astrophys. 621, A39 (2019), eprint 1805.00035.
- Ghirardini et al. (2018) V. Ghirardini, S. Ettori, D. Eckert, S. Molendi, F. Gastaldello, E. Pointecouteau, G. Hurier, and H. Bourdin, Astron. & Astrophys. 614, A7 (2018), eprint 1708.02954.
- Ettori et al. (2020) S. Ettori, V. Ghirardini, and D. Eckert, Astronomische Nachrichten 341, 210 (2020), eprint 1911.05039.
- Ghizzardi et al. (2020a) S. Ghizzardi, S. Molendi, R. van der Burg, S. De Grandi, I. Bartalucci, F. Gastaldello, M. Rossetti, V. Biffi, S. Borgani, D. Eckert, et al., arXiv e-prints arXiv:2007.01084 (2020a), eprint 2007.01084.
- Sunyaev and Zeldovich (1970) R. A. Sunyaev and Y. B. Zeldovich, Astrophysics & Space Sciences 7, 3 (1970).
- Planck Collaboration et al. (2016) Planck Collaboration, P. A. R. Ade, N. Aghanim, M. Arnaud, M. Ashdown, J. Aumont, C. Baccigalupi, A. J. Banday, R. B. Barreiro, R. Barrena, et al., Astron. & Astrophys. 594, A27 (2016), eprint 1502.01598.
- Eckert et al. (2019) D. Eckert, V. Ghirardini, S. Ettori, E. Rasia, V. Biffi, E. Pointecouteau, M. Rossetti, S. Molendi, F. Vazza, F. Gastaldello, et al., Astron. & Astrophys. 621, A40 (2019), eprint 1805.00034.
- Ghizzardi et al. (2020b) S. Ghizzardi, S. Molendi, R. van der Burg, S. De Grandi, I. Bartalucci, F. Gastaldello, M. Rossetti, V. Biffi, S. Borgani, D. Eckert, et al., arXiv e-prints arXiv:2007.01084 (2020b), eprint 2007.01084.
- Predehl et al. (2020) P. Predehl, R. Andritschke, V. Arefiev, V. Babyshkin, O. Batanov, W. Becker, H. Böhringer, A. Bogomolov, T. Boller, K. Borm, et al., arXiv e-prints arXiv:2010.03477 (2020), eprint 2010.03477.