Vol.0 (20xx) No.0, 000–000
22institutetext: School of Astronomy and Space Sciences,University of Science and Technology of China, Hefei 230026,China
33institutetext: Indian Institute of Astrophysics, Koramangala, Bangalore 560034, India
44institutetext: Aryabhatta Research Institute of Observational Sciences, Manora Peak, Nainital 263001, India
55institutetext: Korea Astronomy and Space Science Institute, 776 Daedeokdae-ro, Yuseong-gu, Daejeon 34055, Republic of Korea
66institutetext: Institute of Astrophysics and Space Sciences (IA), Rua das Estrelas, 4150-762 Porto, Portugal
77institutetext: School of Chemistry and Physics, University of KwaZulu-Natal, Westville Campus, Private Bag X54001, Durban, 4000, South Africa
88institutetext: NAOC-UKZN Computational Astrophysics Centre (NUCAC), University of KwaZulu-Natal, Durban, 4000, South Africa
\vs\noReceived 20xx month day; accepted 20xx month day
Interacting system NGC 7805/6 (Arp 112) and its tidal dwarf galaxy candidate
Abstract
We present results from our Giant Metrewave Radio Telescope (GMRT) H i , Himalayan Chandra Telescope (HCT) H, 1m Sampurnanand Telescope (ST) and 1.3m Devasthal Fast Optical Telescope (DFOT) deep optical observations of NGC 7805/6 (Arp 112) system to test KUG 2359+311’s tidal dwarf galaxy (TDG) candidacy and explore the properties of the interacting system. Our GMRT H i map shows no H i detection associated with KUG 2359+311, nor any H i tail or bridge-like structure connecting KUG 2359+311 to the NGC 7805/6 system. Our HCT Hα image on the other hand, shows strong detections in KUG 2359+311, with net SFR 0.035. The H data constrains the redshift of KUG 2359+311 to , compared to the redshift of NGC 7806 of . TDGs detected to date have all been H i rich, and displayed H i, ionised gas and stellar tidal debris trails (bridges or tails) linking them to their parent systems. But neither our H i data nor our optical images, while three magnitudes deeper than SDSS, reveal tidal trail connecting KUG 2359+311 to NGC 7805/6. Lack of H i , presence of an old stellar population, ongoing star formation, reasonably high SFR compared to normal dwarf galaxies suggest that KUG 2359+311 may not be an Arp 112 TDG. It is most likely a case of a regular gas-rich dwarf galaxy undergoing a morphological transformation after having lost its entire gas content to an interaction with the Arp 112 system. Redshift and metallicity from future spectroscopic observations of KUG 2359+311 would help clarify the nature of this enigmatic structure.
1 Introduction
Tidal interactions between galaxies, where at least one of them is gas-rich, can result in tidal stripping of large amounts of H i from the parent galaxy(s). This stripped gas then evolves and may form temporary structures which are likely to eventually fall back into one or the other of the interacting galaxies. If the gas mass and densities are sufficient and environmental conditions are favourable, self-gravitating bodies with masses typical of dwarf galaxies, called Tidal Dwarf Galaxies (TDG), may form within the tidally stripped gas (Duc & Mirabel 1999; Duc et al. 2000). To date, TDG candidates have been found almost exclusively within tidal debris of interacting galaxies. However, there remain significant unanswered questions about their independent existence as dwarf galaxies, their star formation (SF) properties and dark matter (DM) content. Atomic and molecular gas observations of TDGs provide information for determining the conditions under which star formation is triggered within the tidally stripped gas, the role of gas in the formation of stars and the influence of dark matter in galaxy formation.
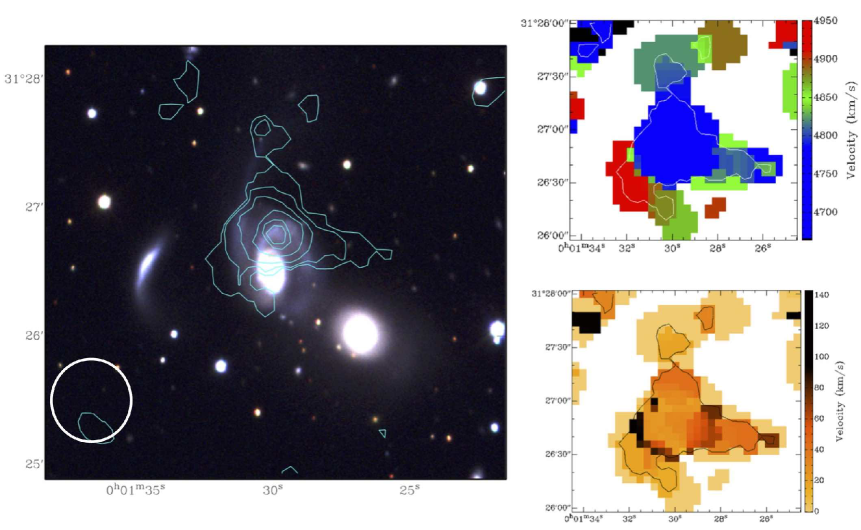
To address the issue of in–situ star and TDG formation in tidal debris, a multi-wavelength study of a sample of Arp interacting galaxies, Spirals, Bridges, and Tails (SB&T), was carried out (Smith et al. 2007, 2010). GALEX, Spitzer and H observations of SB&T systems provided evidence of in–situ star formation and TDG candidates, including in the Arp 112 interacting pair. Arp 112 consisting of the galaxies NGC 7805 and NGC 7806 (radial velocities 4811 and 4768 respectively) display signatures of a recent tidal interaction. Additionally, a smaller arc-like structure, KUG 2359+311, is projected 1 arcmin (20 kpc) east of the principal pair (Figure 1). No spectroscopic data is available for KUG 2359+311 and thus it is not sure whether the structure is associated with Arp 112 or not. If KUG 2359+311 is associated with Arp 112 system, then it could be a candidate TDG or remnant of a ring structure formed as a result of NGC 7805/6 collision (Smith et al. 2010). NGC 7806 has an optical tail extending northward which contains two UV-bright clumps. These clumps are also potential TDG candidates or star-forming regions, but to date, neither clump has a published redshift (Smith et al. 2010).
We present here results from our Giant Metrewave Radio Telescope (GMRT) H i line, Himalayan Chandra Telescope (HCT) H, 1m Sampurnanand Telescope (ST) and 1.3m Devasthal Fast Optical Telescope (DFOT) deep optical observations of Arp 112 system with an aim to test KUG 2359+311’s TDG candidacy and explore the properties of the interacting system. Using the average heliocentric velocity of the two principal galaxies from NASA Extragalactic Database (NED), assuming (Planck Collaboration et al. 2018), we adopt a distance of 70 Mpc to Arp 112. At this distance the spatial scale translates to .
2 Observations and Data Analysis
2.1 GMRT H i line observations
The 21 cm H i line observations of Arp 112 were carried out with the GMRT on February 1st, 2015. The baseband bandwidth for the observations was 16 MHz resulting in a velocity resolution 7km/s. Further details of the observations are given in Table 1. The Astronomical Image Processing System (aips) software package was used to reduce the UV data. Bad data from malfunctioning antennas and radio frequency interference (RFI) were flagged. The flux density calibration scale used was Baars et al. (1977), with flux density uncertainties 5%. After calibration, the continuum subtraction was carried out using the aips task uvlin. The task imagr was applied to the visibilities to transform them into the final H i image cubes. The integrated H i , H i velocity field and velocity dispersion maps were made applying the task momnt on the H i cubes. Further details of the final map, presented in this paper, are given in Table 1.
| Rest frequency | 1420.4057 MHz |
|---|---|
| Observation Date | 1st February, 2015 |
| Integration time | 12.0 hrs |
| Primary beam | 24\arcmin at 1420.4057 MHz |
| Map resolution (beam–FWHP) | 36.6′′ 36.0′′, PA = -67.9∘ |
| Map rms per channel | 1.0 mJy beam-1 |
| RA (pointing centre) | 00h 01m 28.4s |
| DEC (pointing centre) | 31∘ 26′ 16.0′′ |
2.2 HCT Hα and optical broadband observations
Hα+[Nii] observations of Arp 112 system were obtained from 2m–Himalayan Chandra Telescope (HCT), installed at Indian Astronomical Observatory (IAO), Hanle and remotely controlled at CREST, Indian Institute of Astrophysics, Bengaluru. The data were obtained on July 4th, 2016 using the Himalaya Faint Object Spectrograph Camera (HFOSC), equipped with a 2K 4K SITe CCD chip, but only the central 2K 2K region (field of view of 10 10 arcmin2) was used for imaging. The plate scale is 0.296 arcsec pixel-1. Images were obtained using a broad Hα filter with a bandwidth of 500Å. At the redshift of Arp 112, the emission lines [N II] 6549.9Å, [N II] 6585.3Å and H 6564.6Å all fell within the bandwidth of this filter. band observations were also obtained and used to subtract the continuum from the Hα images. Several calibration frames, like the bias frames were obtained throughout the night and flat field frames for correcting pixel-to-pixel variation of CCD, were taken during morning and evening twilight. A spectrophotometric standard star, Feige 110, was also observed on the same night to flux calibrate the images.
The data obtained from HCT were processed using iraf111Image Reduction and Analysis Facility (IRAF) is distributed by the National Optical Astronomy Observatory, which is operated by the Association of Universities for Research in Astronomy (AURA) under a cooperative agreement with the National Science Foundation. software following the standard procedures. The standard steps involved in data reduction are bias-subtraction, flat-field correction and alignment of the frames using iraf tasks geomap and geotran. The point spread function (PSF) of the H+[Nii] image was matched to that of the R-band image using the gauss task. The full width at half-maximum of the PSF, estimated from the stars in the –band image, is 6 pixels (1.8 arcsec). As noted by James et al. (2004), scaled R-band exposures give excellent continuum subtraction for observations made during nights. The multiple exposures were then summed to achieve a better signal-to-noise ratio (SNR) for the and H frames. The total on-target integration time achieved in –band was 600s and in the H band 3000s. The sky background in individual target frames was estimated from regions away from the galaxies and not affected by stars, which were then subtracted as a constant count from the frames. The frames were also divided by the total integration time to obtain per second images. The Hα+[Nii] line image was obtained after subtracting the PSF matched and scaled –band image, which also includes some line emission, from the H+[Nii] image as described in Scott et al. (2018) and references therein. Using Feige 110 (Oke 1990), the flux conversion factor was estimated to be / (count sec-1) similar to the values obtained by Scott et al. (2018), Ramya et al. (2007, 2009).
2.3 ARIES ST and DFOT deep optical observations
Observations of Arp 112 were initiated in October, 2014 and continued through to January, 2015 using the 1m Sampurnanand Telescope (ST) and the 1.3m Devasthal Fast Optical Telescope (DFOT) of the Aryabhatta Research Institute of Observational Sciences (ARIES), India. Observations of Arp 112 were made with these telescopes using B, V, R and I broadband filters. Pre-processing of the images acquired with these two telescopes were carried out using standard tasks in iraf. Images were aligned in respective bands to achieve a high SNR. We used the python module alipy to align the images and the iraf task imcombine to combine them. The effective exposure time in each band is given in Table 2.
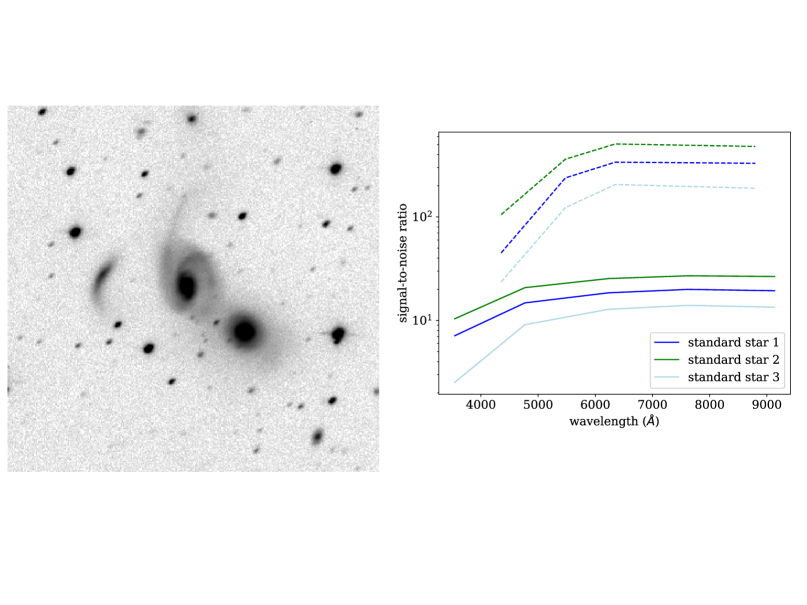
A photometrically non-variable source was required to compare observations at different epochs. None of the existing standard star catalogues had an entry within a 30 arcmin radius of the Arp 112. Hence, the SDSS images from DR12 (Alam et al. 2015) were used to find the standard stars. Aperture photometry was performed over all sources present in the SDSS images in all five filters (u, g, r, i, z). The source flux F obtained from aperture photometry was converted to instrumental magnitudes using the expression, , where t is the exposure time in SDSS frame 54 seconds. The offset between each instrumental magnitude and it’s respective SDSS magnitude was compared to find any sources that behaved inconsistently in each band. 1 clipping was done iteratively to remove the outlier sources, and three sources were selected randomly to compare our observations with those from SDSS. These three sources were considered in our observation as well as SDSS frames to derive SNRs. The calculated SNR for the three sources is shown in Figure 2, with our observations having a better SNR in all the observed wavelength bands compared to SDSS. For longer wavelengths (6500Å) the images obtained using the Aries telescopes were 3 magnitudes deeper than the SDSS images.
| Filter | Central wavelength (Å) | Exposures (sec) | Effective exposure time (sec.) |
|---|---|---|---|
| B | 4361 | 300 23 | 6900 |
| V | 5448 | 300 73 | 21900 |
| R | 6407 | 300 4 | 1200 |
| I | 7980 | 300 36 | 10800 |
3 Results and Discussion
3.1 NGC 7085/6 system
Figure 1 shows the H i column density contours from the GMRT (36.6 36.0′′, PA -67.9∘) integrated H i map for the Arp 112 field overlaid on an SDSS optical image. The entire H i emission detected in the system is associated with NGC 7806. The deep optical image of NGC 7806 in Figure 2 shows a faint tidal tail which extends to the north beyond the optical disk. Additionally, the northern disk of NGC 7806 hosts UV bright clumps identified in GALEX images (Smith et al. 2010). The H i column density maxima are projected on this UV bright section of the NGC 7806 northern disk (Figure 1) and offset by 25′′ (8 kpc) from the optical centre. NGC 7805, on the other hand, is devoid of H i . This H i displacement in NGC 7806 is common in strongly interacting pairs. Even larger displacements of the bulk of a pair’s H i has been observed other Arp interacting pairs, e.g. Arp 181 and Arp 65 (Sengupta et al. 2013, 2015). Arp 112 has been observed using the Arecibo 305m single-dish telescope (FWHM beam ) and an H i flux density of 1.25 Jy was reported in Sulentic & Arp (1983). At the distance of the Arp 112, this translates to an H i mass of . Using GMRT spectrum, we measured the H i flux density to be 1.0 Jy and the corresponding H i mass to be . Given that uncertainties on these estimates are 10%, this indicated that almost all of the H i flux was recovered by the GMRT interferometric observations.
Since NGC 7805 is an S0 type galaxy and NGC 7806 is an Sbc spiral, and all the detected H i is associated to NGC 7806, it can reasonably be assumed that NGC 7806 contained most of the pair’s H i before they started interacting. The velocity of the detected H i (4751 ) is closer to the optical radial velocity of NGC 7806 (4768 ) compared to NGC 7805 (4811 ), confirming the bulk of the detected H i is most likely to have originated in NGC 7806. We attempt here to determine whether NGC 7806 shows signs of H i loss due to the interaction. A field galaxy of the same size and morphology as NGC 7806, is expected to have an H i content of (Haynes & Giovanelli 1984). However, the measured total H i mass for NGC 7806 is only giving an H i deficiency of 0.41. This H i deficiency value suggests, that the NGC 7805/06 interaction has removed a significant quantity of the NGC 7806 H i content. But it should be noted that the uncertainties for the expected H i content of a single galaxy are high (Haynes & Giovanelli 1984). Therefore we must be cautious with our conclusion about H i deficiency of NGC 7806 and can only comment that it is likely that a significant H i loss has occurred during the interaction.
Figure 1 – right panel, shows the H i velocity field with velocities per the colour bar to the right. The black contour represents the lowest H i column density contour of the total intensity map. The black contour has been used to show the outline of the velocity field for the H i total intensity map. The H i velocity field does not show any systematic velocity pattern, i.e. no sign of any systematic rotation. There are signs of irregular velocity gradients in the H i but since the H i velocity field is intensity weighted, the velocity gradient towards the low column density regions is not significant enough to be trusted. The unmasked velocity field map further demonstrates the poor signal to noise ratio which prohibits us from drawing any conclusion about NGC 7806’s kinematics. The interaction with NGC 7805 appears to have destroyed the regular kinematics of the NGC 7806’s H i disk and the remnant H i is now detected with its column density maxima at 8 kpc north of the NGC 7806 optical centre.
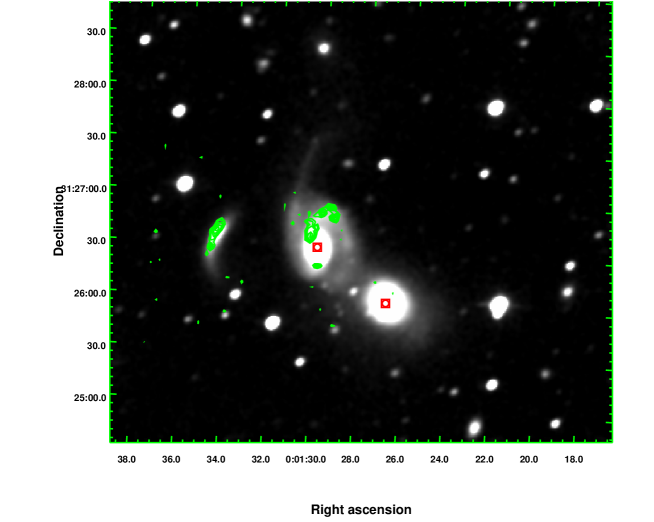
Figure 3 shows the H detection on the NGC 7805/6 system as well as in KUG 2359+311. NGC 7806 and NGC 7805 optical centres are marked with red squares and the H detections are shown with green contours. NGC 7806, which is an Sbc galaxy shows at least 4 knots of star formation numbered from 4 to 7. No H detection is seen from NGC 7805, an S0 galaxy. Following Ramya et al. (2007, 2009), we selected the emission boundary based on the criteria that the emission is centrally peaked and the boundary of the region is set where the flux falls to 1 of the background (i.e. ). H+[Nii] fluxes, luminosities and star formation rates (SFR) for each of these knots are estimated and tabulated in Table 3. The fluxes are in the range - and luminosities are in the range as shown in the Table 3. The SFR values are based on the formula from Kennicutt (1998) for galaxies with solar abundances and assuming Salpeter initial mass function with stellar masses ranging from -. For individual star-forming knots in NGC 7806, SFRs are in the range - . The positions of these star-forming H clumps match well the UV bright zones in the northern disk of NGC 7806, reported in Smith et al. (2010). Interestingly the H i mass observed in NGC 7806 also has its column density peak projected at the position of these clumps. This suggests that this star formation could be triggered by the interaction of NGC 7806 and NGC 7805.
| Knots | Diameter | F(H) | L(H) | SFR(H) |
|---|---|---|---|---|
| kpc | ||||
| 1 | 2.2 | 0.870.67 | 0.590.39 | |
| 2 | 2.2 | 2.611.11 | 1.530.65 | |
| 3 | 3.0 | 4.181.41 | 2.450.83 | |
| SFR (KUG 2359+311) | ||||
| 4 | 2.2 | 2.461.08 | 1.440.64 | |
| 5 | 2.2 | 2.851.16 | 1.670.68 | |
| 6 | 2.2 | 2.621.12 | 1.540.66 | |
| 7 | 2.6 | 5.191.58 | 3.050.93 | |
| SFR (NGC 7806) | ||||
3.2 KUG 2359+311, a TDG candidate?
KUG 2359+311 is projected 1 arcmin (20 kpc) east of the NGC 7805/6 pair and has been proposed as a TDG candidate for Arp 112 (Smith et al. 2010). To date no spectroscopic redshift has been published for KUG 2359+311 and thus it is not confirmed that the structure is associated with Arp 112. While KUG 2359+311 is clearly visible in the GALEX image (Smith et al. 2010), it also stood out as one of the redest TDG canidates in the Smith et al. (2010) sample. The system seemed interesting for an H i imaging study because TDGs in systems involving an early type parent galaxy are rare. Usually most TDGs are found in pairs of interacting gas-rich large spirals.
Our GMRT H i map shows no H i detection associated with KUG 2359+311, nor any H i tail or bridge-like structure was detected connecting KUG 2359+311 to the NGC 7805/6 system. A search across the usable bandwidth of this observation, covering an approximate redshift range of 0.0116 z 0.0214, yeilded no reliable H i signal on or around the position of KUG 2359+311. Assuming it to be at the same redshift as Arp 112, a 5 upper limit to its H i mass would approximately be 1.2108 . Our HCT Hα image (Figures 3 and 4) on the other hand, show strong detections in KUG 2359+311. Unfortunately, this H detection provides only a broad constraint on KUG 2359+311’s redshift as the Hα filter used covers a relatively large redshift range between and , compared to the redshift of NGC 7806 of 0.015. So while we have been able to put a constraint on its redshift, whether KUG 2359+311 is associated with Arp 112, will require spectroscopic redshift confirmation. In the absence of unambiguous evidence that KUG 2359+311 is a TDG associated with Arp 112, we studied the properties of KUG 2359+311 from the available optical data and compared it with known dwarf galaxy properties.
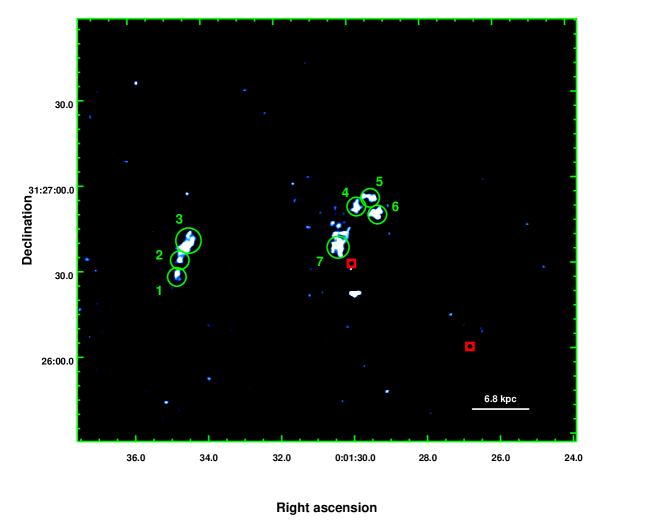
The H+[Nii] emission from KUG 2359+311 shows three knots of star formation numbered as 1, 2 and 3 in Figure 4. The SFRs estimated for individual SF regions of KUG 2359+311 from the H clumps are between to . The total SFR for KUG 2359+311 is estimated to be . Following Kennicutt (1998), the SFR derived from FUV magnitude for KUG 2359+311 system (Smith et al. 2010) is matches well within the range of errors to the SFR estimated from our H observations. This SFR range is normal for a star-forming dwarf galaxy (Rosenberg et al. 2006). Assuming KUG 2359+311 to be at the distance of Arp 112, the estimated size of the KUG 2359+311 optical and Hα extent would be 12 kpc and 7.5 kpc respectively. Using SDSS colours and MLCR relation from Roediger & Courteau (2015), the estimated stellar mass for KUG 2359+311 at the distance of Arp 112 is . Under these assumptions, if KUG 2359+311 were to be at the same redshift as Arp 112, its optical mass, H disk extent and SFR of KUG 2359+311 are characteristic of a star-forming gas deficient dwarf galaxy rather than a recently formed TDG. Also, no sign of any diffuse tidal or stellar remnants or bridges were found in the deep optical image from the ARIES telescopes.
TDGs detected to date have all been H i rich, and display H i, ionised gas and/or stellar tidal debris trails (bridges or tails) linking them to their parent systems (Duc & Mirabel 1999; Duc et al. 2000; Sengupta et al. 2013, 2014, 2017; Smith et al. 2007, 2010). Moreover, their blue optical colours (B-V =0.3 Duc & Mirabel 1999) are consistent within the bulk of their stars having been formed within the last 0.5 Gyrs (Scott et al. 2018). Although proposed as a TDG candidate by Smith et al. (2010), the lack of evidence linking KUG 2359+311 to the NGC 7805/6 system and its stellar mass, presence of old stellar population, size and SFR (assuming same redshift as Arp 112) raise doubts about whether it is a TDG or not. Until a spectroscopic redshift for KUG 2359+311 is available the possibility that it is a foreground or background galaxy remains open. A further possibility is that it is an ordinary dwarf galaxy caught up in the interaction between the Arp 112 pair, which could explain its unusual crescent morphology. If KUG 2359+311 was a dwarf or small irregular galaxy at the same redshift as Arp 112, its ongoing star formation rate and its complete lack of H i make it an interesting case of a dwarf undergoing a possible morphological transformation. The SFR of KUG 2359+311 estimated from GALEX FUV magnitude (Smith et al. 2010) is and that from the H image is . Within errorbars, they are same, though the absolute numbers suggest a decrease in SFR over time. The error bars on these estimates prevent us from making any strong claim. Still, a possible scenario could be that KUG 2359+311 was a normal dwarf which got caught in the Arp 112 interaction and went through an interaction induced star formation phase with the gradual depletion of H i as well as its SFR. In its current state, it appears to have lost all its H i content to either the IGM or to star formation. It is possible that we are witnessing a dwarf galaxy in a state of morphological transformation and that post this star-forming stage the galaxy may transform into a gas deficient, red early-type dwarf. This scenario seems more plausible as opposed to KUG 2359+311 being a foreground or a background galaxy due to the lack of any larger mass nearby galaxy that can explain its crescent-shaped distorted morphology. The redshift and metallicity from future spectroscopic observations of KUG 2359+311 would help clarify the nature of this enigmatic structure.
4 Conclusion
We present our GMRT H i , HCT H , 1m ST and 1.3m DFOT deep optical observations of an interacting system, Arp 112, involving an S0 galaxy NGC 7805 and an Sbc spiral NGC 7806. Arp 112 was proposed to also contain a TDG candidate KUG 2359+311, although, no spectroscopic data were available to support this. Our observations reveal that the H i in the pair is now projected to the north of NGC 7806 disk with the H i column density maxima located about eight kpc north of the NGC 7806 optical centre near an ongoing star formation region. Assuming that NGC 7806, was the source of the bulk of the detected H i, we conclude NGC 7806 has a H i deficiency of 0.41 suggesting it has lost a substantial fraction of its original H i due to the interaction. No H i was detected in NGC 7805 or KUG 2359+311, the TDG candidate. Our optical imaging, while three magnitudes deeper than SDSS, did not reveal any additional tidal debris. On the other hand, our H observations revealed starforming regions coincident with the highest column density H i in NGC 7806 and along the length of KUG 2359+311 optical structure. The H filter used for the HCT observations provide only a broad constraint (-) on the redshift of KUG 2359+311. As a result of this and our analysis of the optical data for KUG 2359+311 we consider it is prudent to remain open to the possibility that KUG 2359+311 is not an Arp 112 TDG, but is most likely a case of a normal gas-rich dwarf galaxy undergoing a morphological transformation after having lost its entire gas content to an interaction with the Arp 112 system.
5 Acknowledgements
We thank the staff of the GMRT that made these observations possible. GMRT is run by the National Centre for Radio Astrophysics of the Tata Institute of Fundamental Research. We thank the staff of IAO, Hanle and CREST, Hosakote, that made these observations possible. The facilities at IAO and CREST are operated by the Indian Institute of Astrophysics, Bangalore. TS acknowledges support by Fundação para a Ciência e a Tecnologia (FCT) through national funds (UID/FIS/04434/2013), FCT/MCTES through national funds (PIDDAC) by this grant UID/FIS/04434/2019 and by FEDER through COMPETE2020 (POCI-01-0145-FEDER-007672). TS also acknowledges support from DL 57/2016/CP1364/CT0009.This research has made use of the NASA/IPAC Extragalactic Database (NED) which is operated by the Jet Propulsion Laboratory, California Institute of Technology, under contract with the National Aeronautics and Space Administration.This research has made use of the Sloan Digital Sky Survey (SDSS). The SDSS Web Site is http://www.sdss.org/. Y.Z.M. acknowledges the support of NRF with grant no.105925, 109577, 120385, and 120378, and NSFC with grant no. 11828301.
References
- Alam et al. (2015) Alam, S., Albareti, F. D., Allende Prieto, C., et al. 2015, The Astrophysical Journal Supplement Series, 219, 12
- Baars et al. (1977) Baars, J. W. M., Genzel, R., Pauliny-Toth, I. I. K., & Witzel, A. 1977, A&A, 61, 99
- Duc et al. (2000) Duc, P.-A., Brinks, E., Springel, V., et al. 2000, AJ, 120, 1238
- Duc & Mirabel (1999) Duc, P.-A., & Mirabel, I. F. 1999, in IAU Symposium, Vol. 186, Galaxy Interactions at Low and High Redshift, ed. J. E. Barnes & D. B. Sanders, 61
- Haynes & Giovanelli (1984) Haynes, M. P., & Giovanelli, R. 1984, AJ, 89, 758
- James et al. (2004) James, P. A., Shane, N. S., Beckman, J. E., et al. 2004, Astronomy and Astrophysics, 414, 23
- Kennicutt (1998) Kennicutt, Robert C., J. 1998, The Astrophysical Journal, 498, 541
- Oke (1990) Oke, J. B. 1990, The Astronomical Journal, 99, 1621
- Planck Collaboration et al. (2018) Planck Collaboration, Aghanim, N., Akrami, Y., et al. 2018, arXiv e-prints, arXiv:1807.06209
- Ramya et al. (2007) Ramya, S., Sahu, D. K., & Prabhu, T. P. 2007, Monthly Notices of the Royal Astronomical Society, 381, 511
- Ramya et al. (2009) Ramya, S., Sahu, D. K., & Prabhu, T. P. 2009, Monthly Notices of the Royal Astronomical Society, 396, 97
- Roediger & Courteau (2015) Roediger, J. C., & Courteau, S. 2015, Monthly Notices of the Royal Astronomical Society, 452, 3209
- Rosenberg et al. (2006) Rosenberg, J. L., Ashby, M. L. N., Salzer, J. J., & Huang, J.-S. 2006, The Astrophysical Journal, 636, 742
- Scott et al. (2018) Scott, T. C., Lagos, P., Ramya, S., et al. 2018, Monthly Notices of the Royal Astronomical Society, 475, 1148
- Sengupta et al. (2013) Sengupta, C., Dwarakanath, K. S., Saikia, D. J., & Scott, T. C. 2013, MNRAS, 431, L1
- Sengupta et al. (2014) Sengupta, C., Scott, T. C., Dwarakanath, K. S., Saikia, D. J., & Sohn, B. W. 2014, MNRAS, 444, 558
- Sengupta et al. (2017) Sengupta, C., Scott, T. C., Paudel, S., et al. 2017, Monthly Notices of the Royal Astronomical Society, 469, 3629
- Sengupta et al. (2015) Sengupta, C., Scott, T. C., Paudel, S., et al. 2015, Astronomy and Astrophysics, 584, A114
- Smith et al. (2010) Smith, B. J., Giroux, M. L., Struck, C., & Hancock, M. 2010, AJ, 139, 1212
- Smith et al. (2007) Smith, B. J., Struck, C., Hancock, M., et al. 2007, AJ, 133, 791
- Sulentic & Arp (1983) Sulentic, J. W., & Arp, H. 1983, The Astronomical Journal, 88, 489