DSAM: A Distance Shrinking with Angular Marginalizing Loss
for High Performance Vehicle Re-identification
Abstract
Vehicle Re-identification (ReID) is an important yet challenging problem in computer vision. Compared to other visual objects like faces and persons, vehicles simultaneously exhibit much larger intraclass viewpoint variations and interclass visual similarities, making most exiting loss functions designed for face recognition and person ReID unsuitable for vehicle ReID. To obtain a high-performance vehicle ReID model, we present a novel Distance Shrinking with Angular Marginalizing (DSAM) loss function to perform hybrid learning in both the Original Feature Space (OFS) and the Feature Angular Space (FAS) using the local verification and the global identification information. Specifically, it shrinks the distance between samples of the same class locally in the Original Feature Space while keeps samples of different classes far away in the Feature Angular Space. The shrinking and marginalizing operations are performed during each iteration of the training process and are suitable for different SoftMax based loss functions. We evaluate the DSAM loss function on three large vehicle ReID datasets with detailed analyses and extensive comparisons with many competing vehicle ReID methods. Experimental results show that our DSAM loss enhances the SoftMax loss by a large margin on the PKU-VD1-Large dataset: for mAP, for cmc1, and for cmc5. Moreover, the mAP is increased by on the PKU-VehicleID dataset and on the VeRi-776 dataset. Source code will be released to facilitate further studies in this research direction.
Introduction
Vehicle Re-identification (ReID), which aims to match detected vehicle images across multiple non-overlapping cameras and different timestamps, has recently received great attention (Wang et al. 2017b; Yan et al. 2017; Zhou and Shao 2018; Bai et al. 2018; Guo et al. 2018). It is an important computer vision task with many potential applications like intelligent traffic monitoring, intelligent video surveillance, and future smart city systems. It is also a very challenging problem due to factors like the large intraclass variations (e.g., in viewpoints, occlusions, illuminations, etc.), the invisibility of the license plate numbers (esp. when vehicles are of the same model and color), and the lack of large scale labeled training datasets (labeling identifications of vehicles is very difficult for human without using the license plate numbers).


With the fast development of deep neural networks, the performances of many visual recognition tasks have been greatly improved in the last decade, ranging from image classification (Krizhevsky, Sutskever, and Hinton 2012; He et al. 2016a), face recognition (Schroff, Kalenichenko, and Philbin 2015; Zhao et al. 2020), to person ReID (Chen et al. 2019a, b). The dominant approach to recognizing the visual objects’ identifications is adopting some neural network as the backbone model to learn the feature representations using different loss functions. The primary learning objective is to increase the interclass distance while decreasing the intraclass distance. Since there have been plenty of research efforts and achievements on the model architectures (Krizhevsky, Sutskever, and Hinton 2012; Simonyan and Zisserman 2015; He et al. 2016a), given a specified constraint on the backbone model, the main factor that accounts for the ReID performance is the design of the loss function.
The loss functions designed for visual recognition can be roughly classified into two groups. The first group is based on the multi-class classification formulation of the problem, which seeks to distinguish different classes’ identifications as accurately as possible. Typical instances from this group include the original SoftMax loss, the ArcFace loss (Deng et al. 2019), the CosFace loss (Wang et al. 2018b), and the SphereFace loss (Liu et al. 2017a). The other group is based on the metric learning formulation of the problem, which seeks to maximize the interclass distance and intraclass similarity simultaneously. Typical examples in this group include the Triplet loss (Schroff, Kalenichenko, and Philbin 2015) and the Center loss (Wen et al. 2016). The former group of loss functions are primarily designed for face recognition (Sun et al. 2014; Deng et al. 2019; Wang et al. 2018b; Liu et al. 2017a), where mainly the interclass distance is maximized. The latter group considers both interclass maximization and intraclass minimization, and has been widely used for face recognition (Schroff, Kalenichenko, and Philbin 2015; Wen et al. 2016) and person ReID (Hermans, Beyer, and Leibe 2017; Wojke and Bewley 2018).
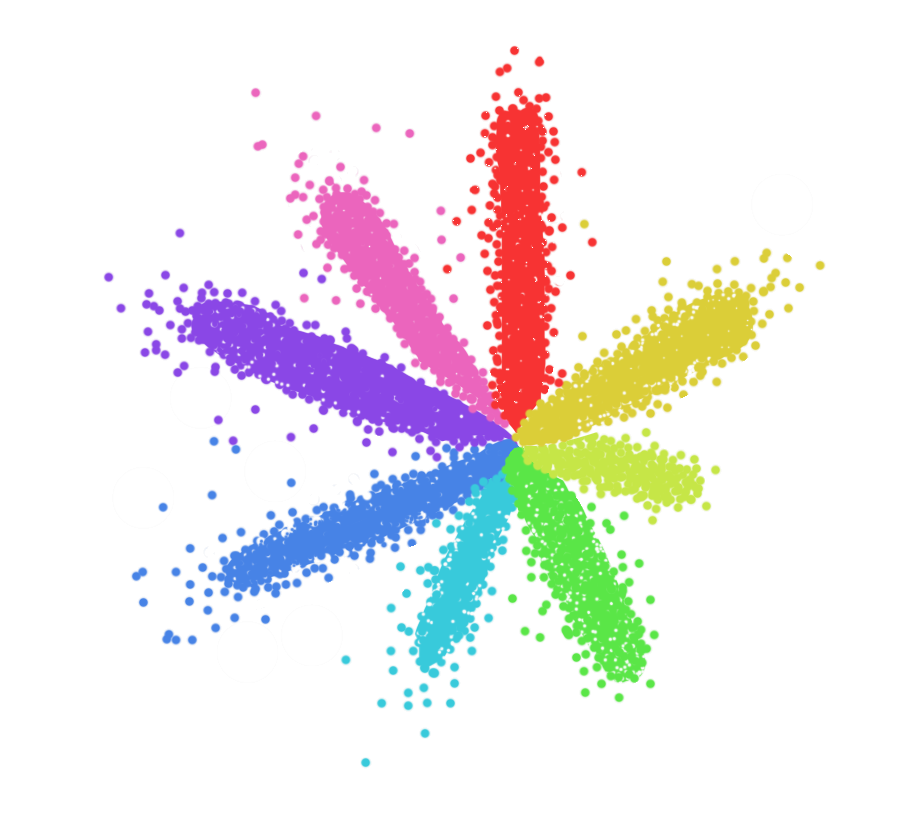
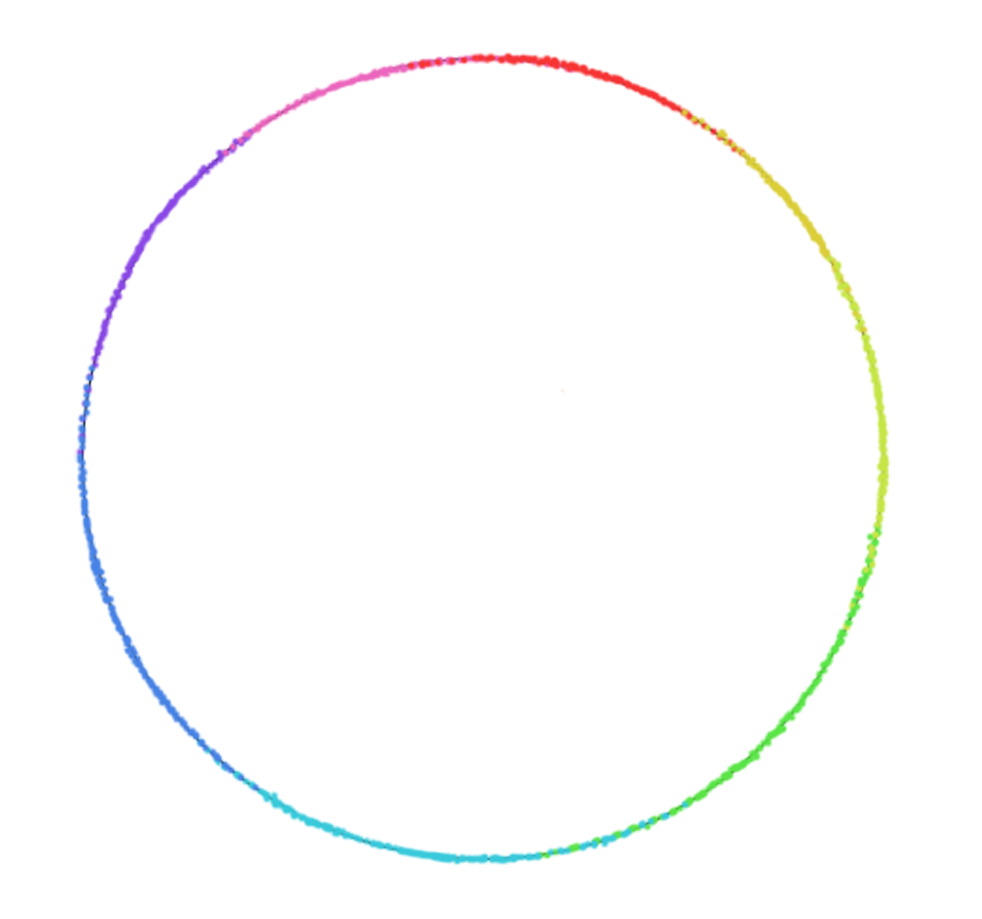
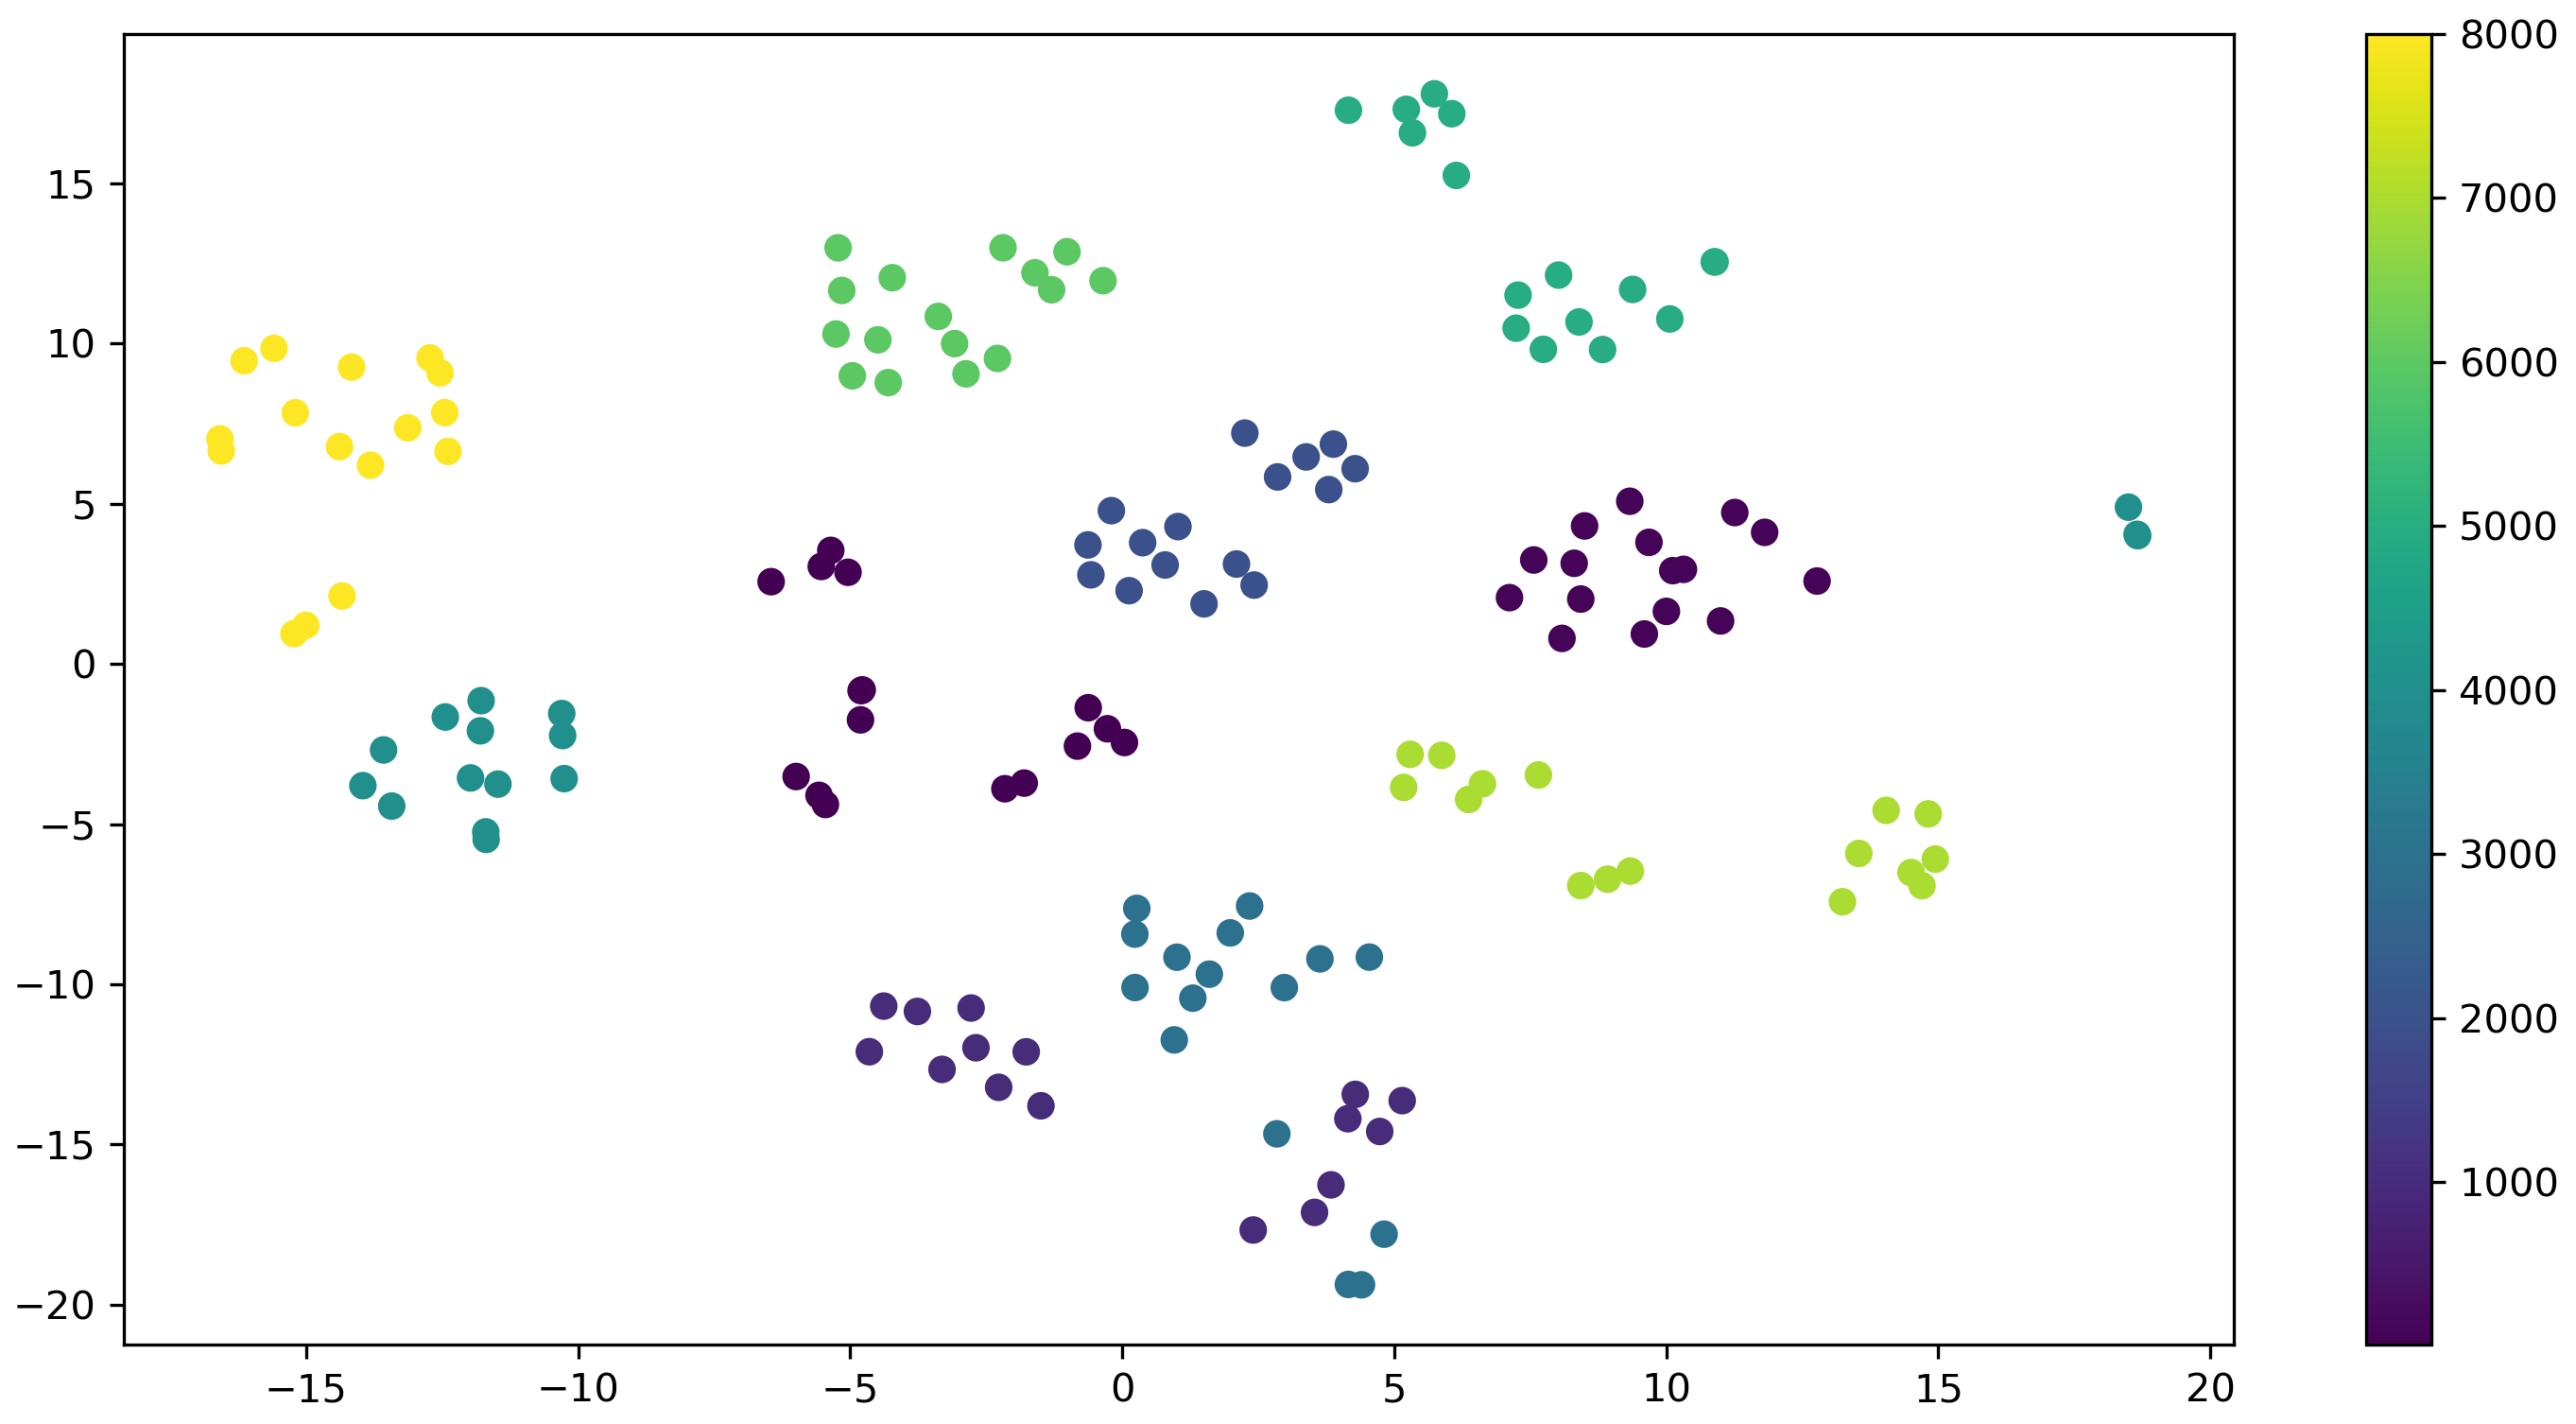
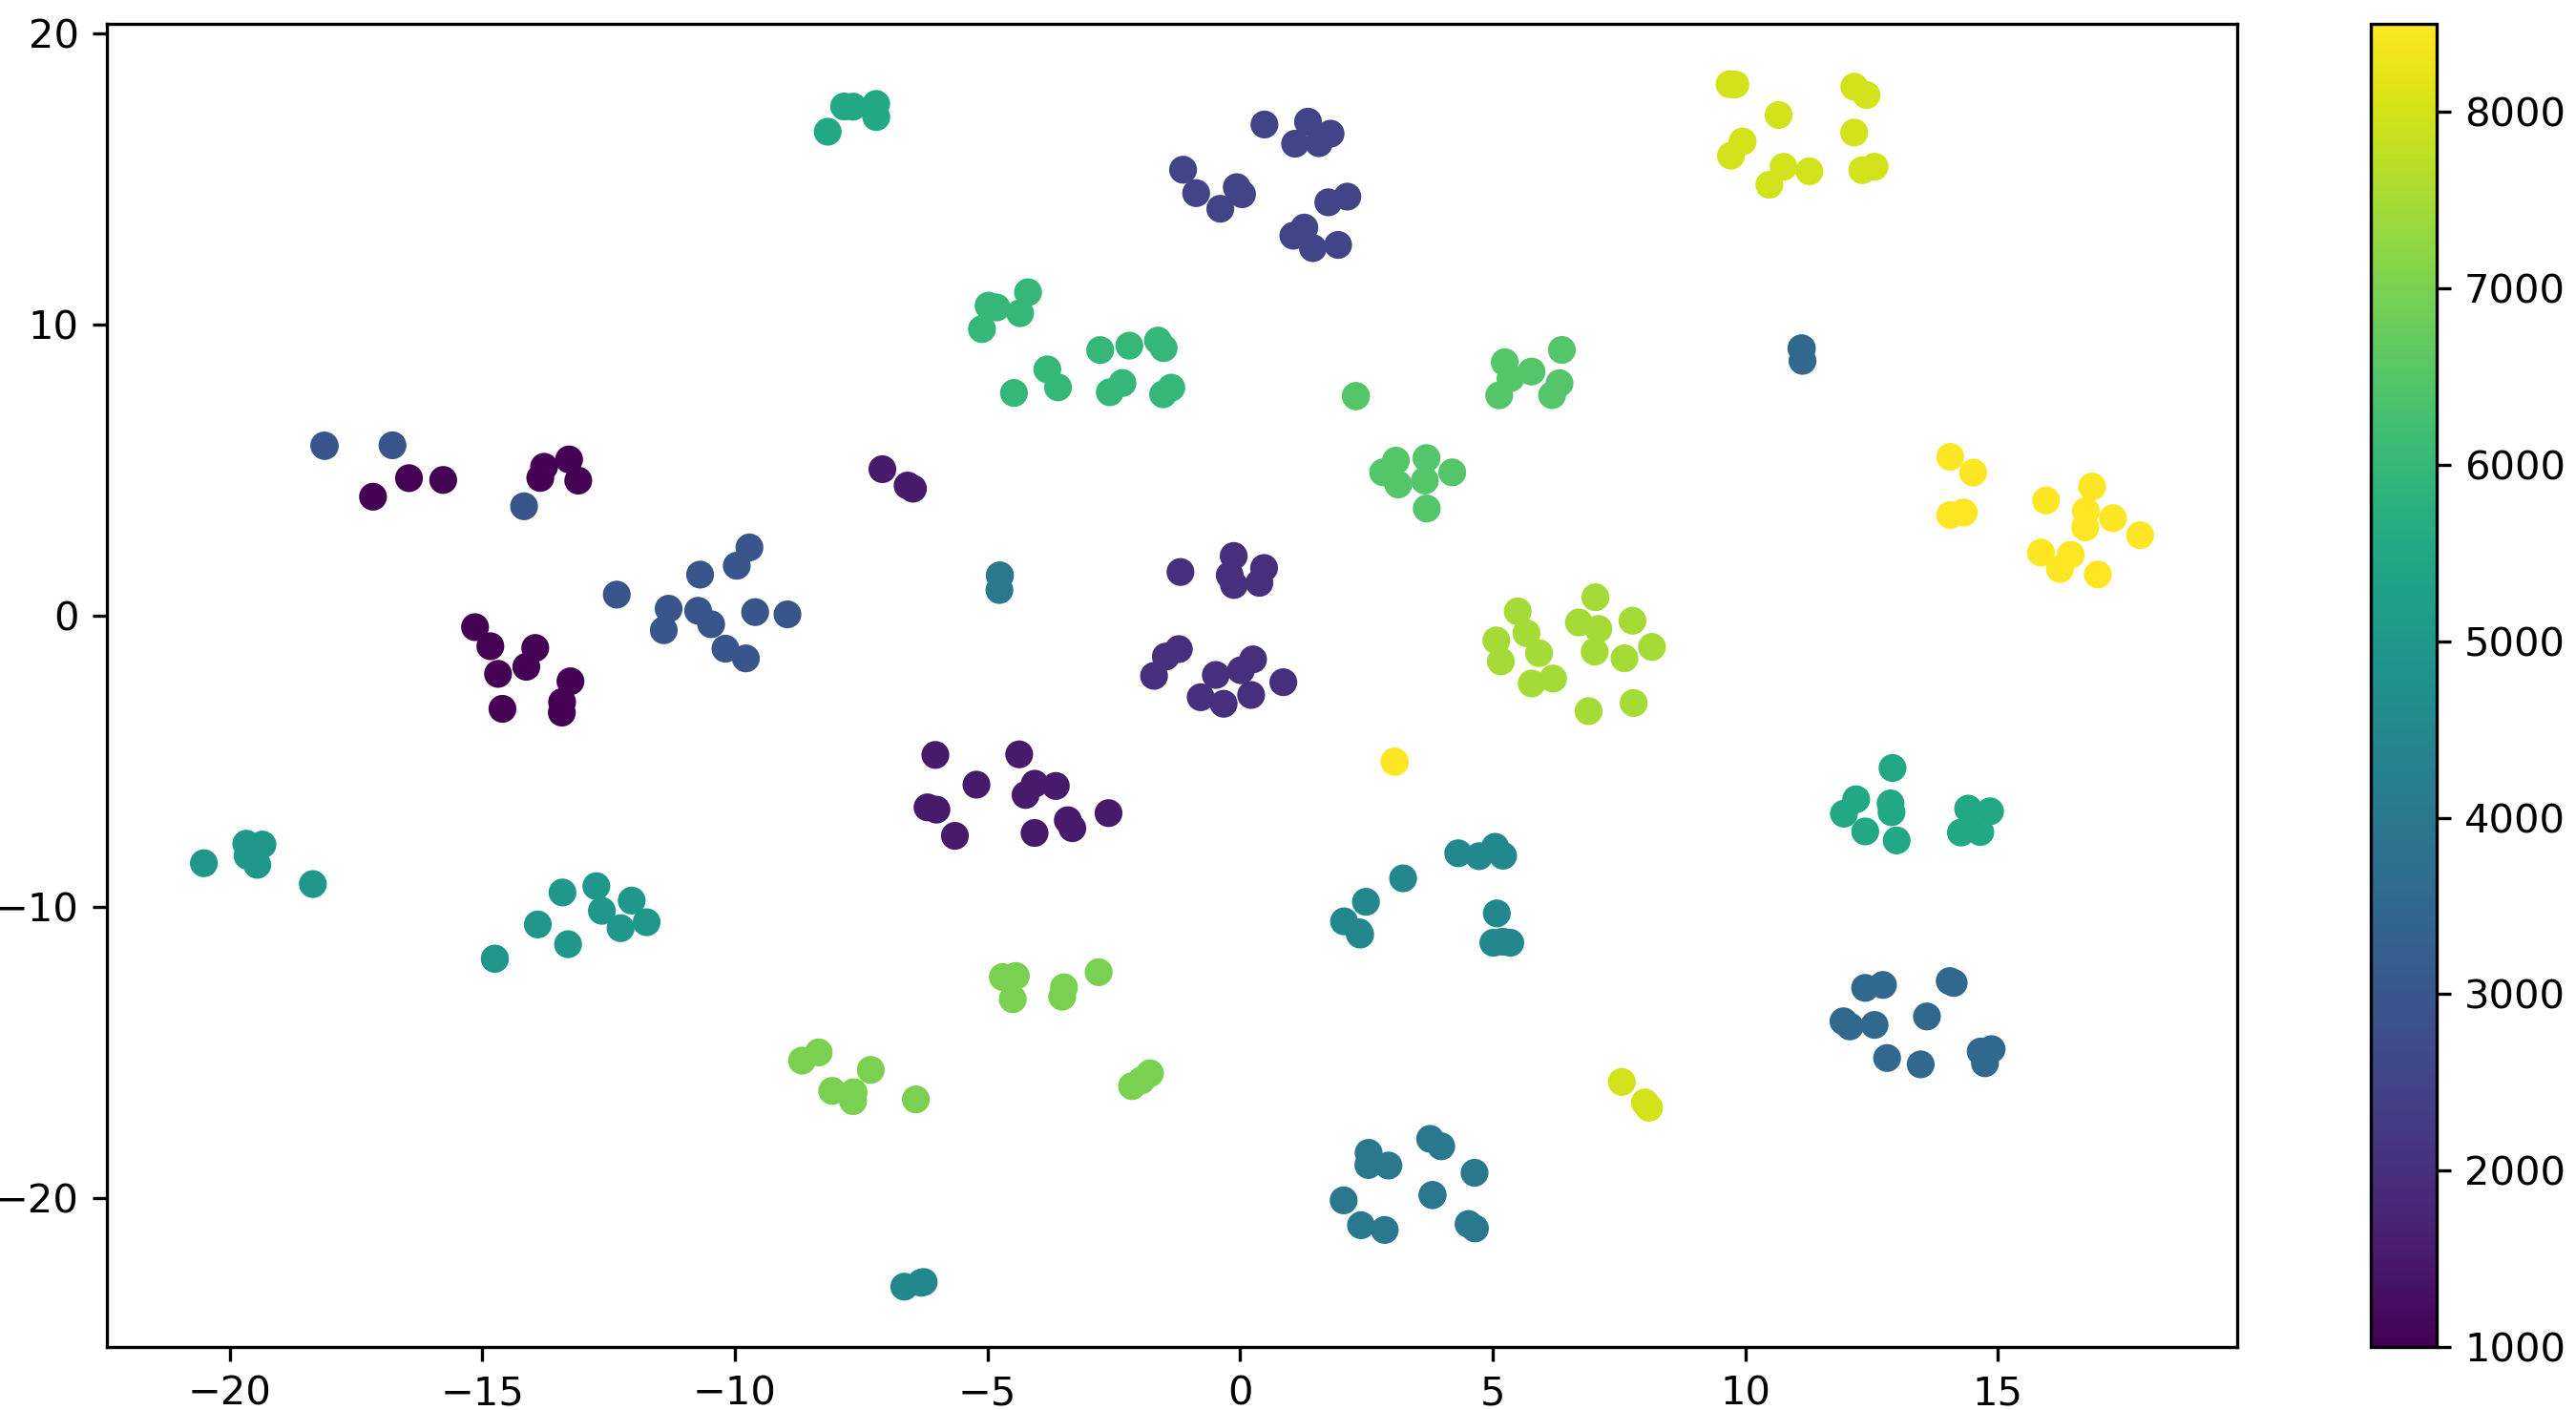
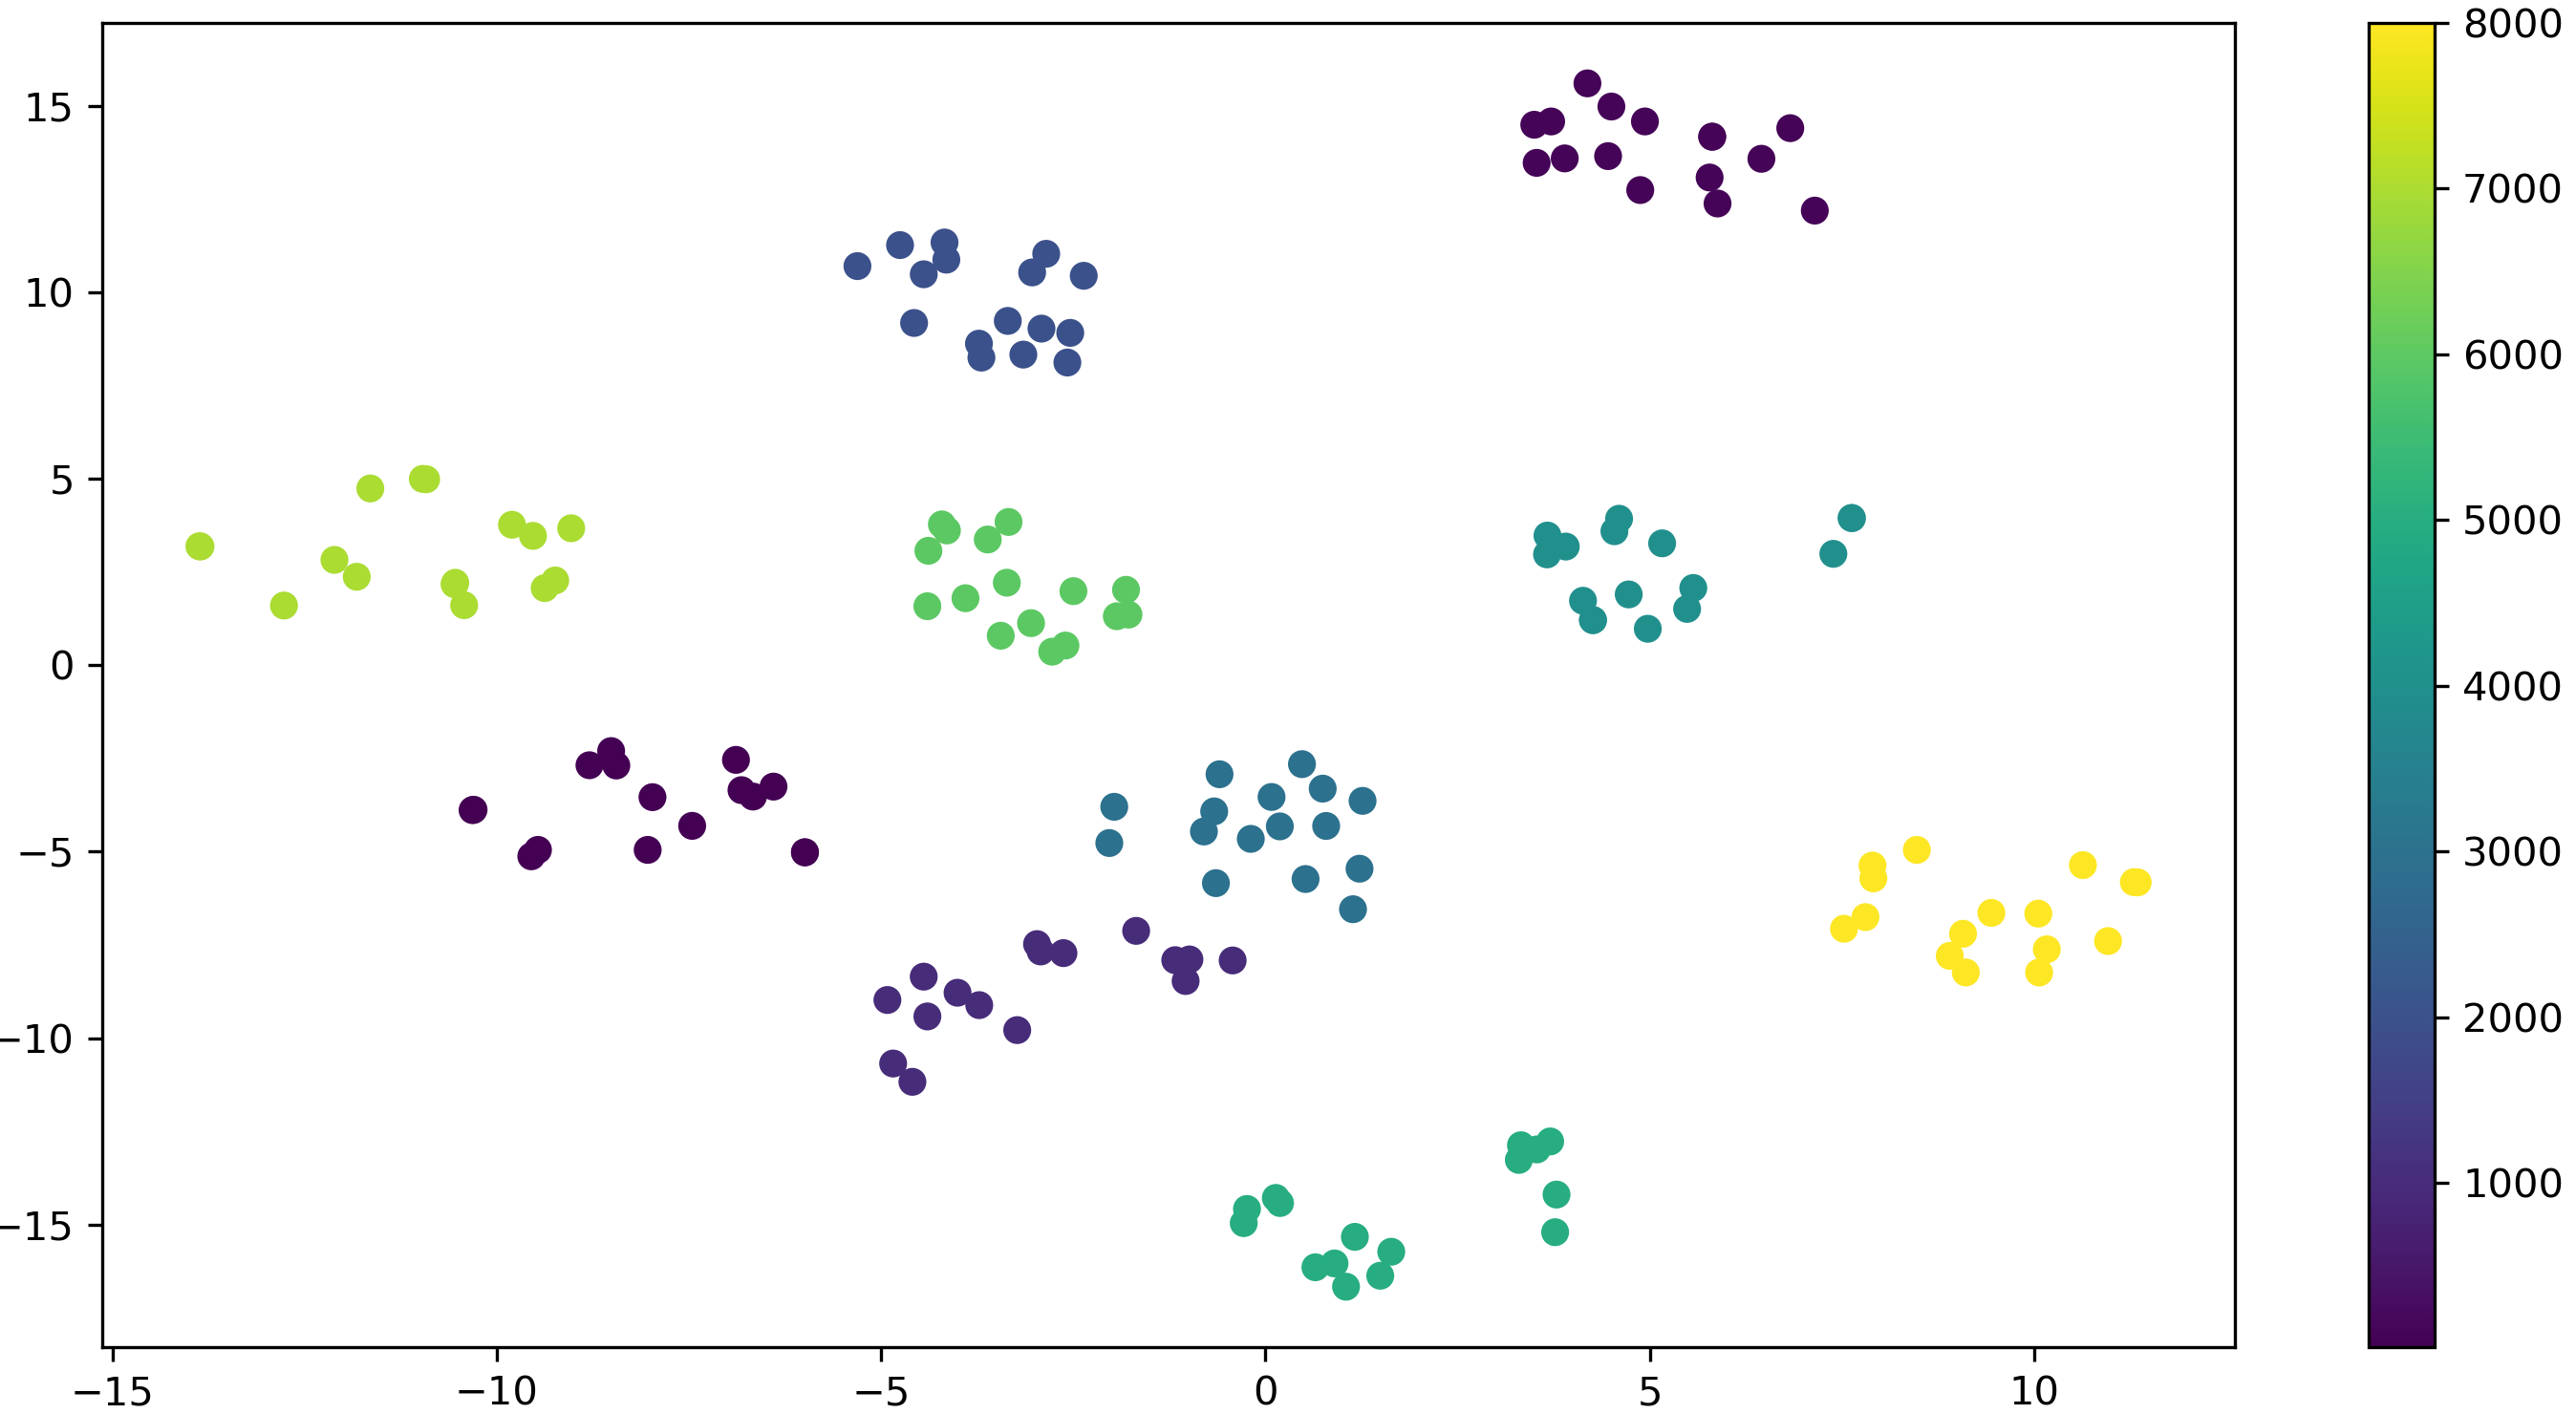
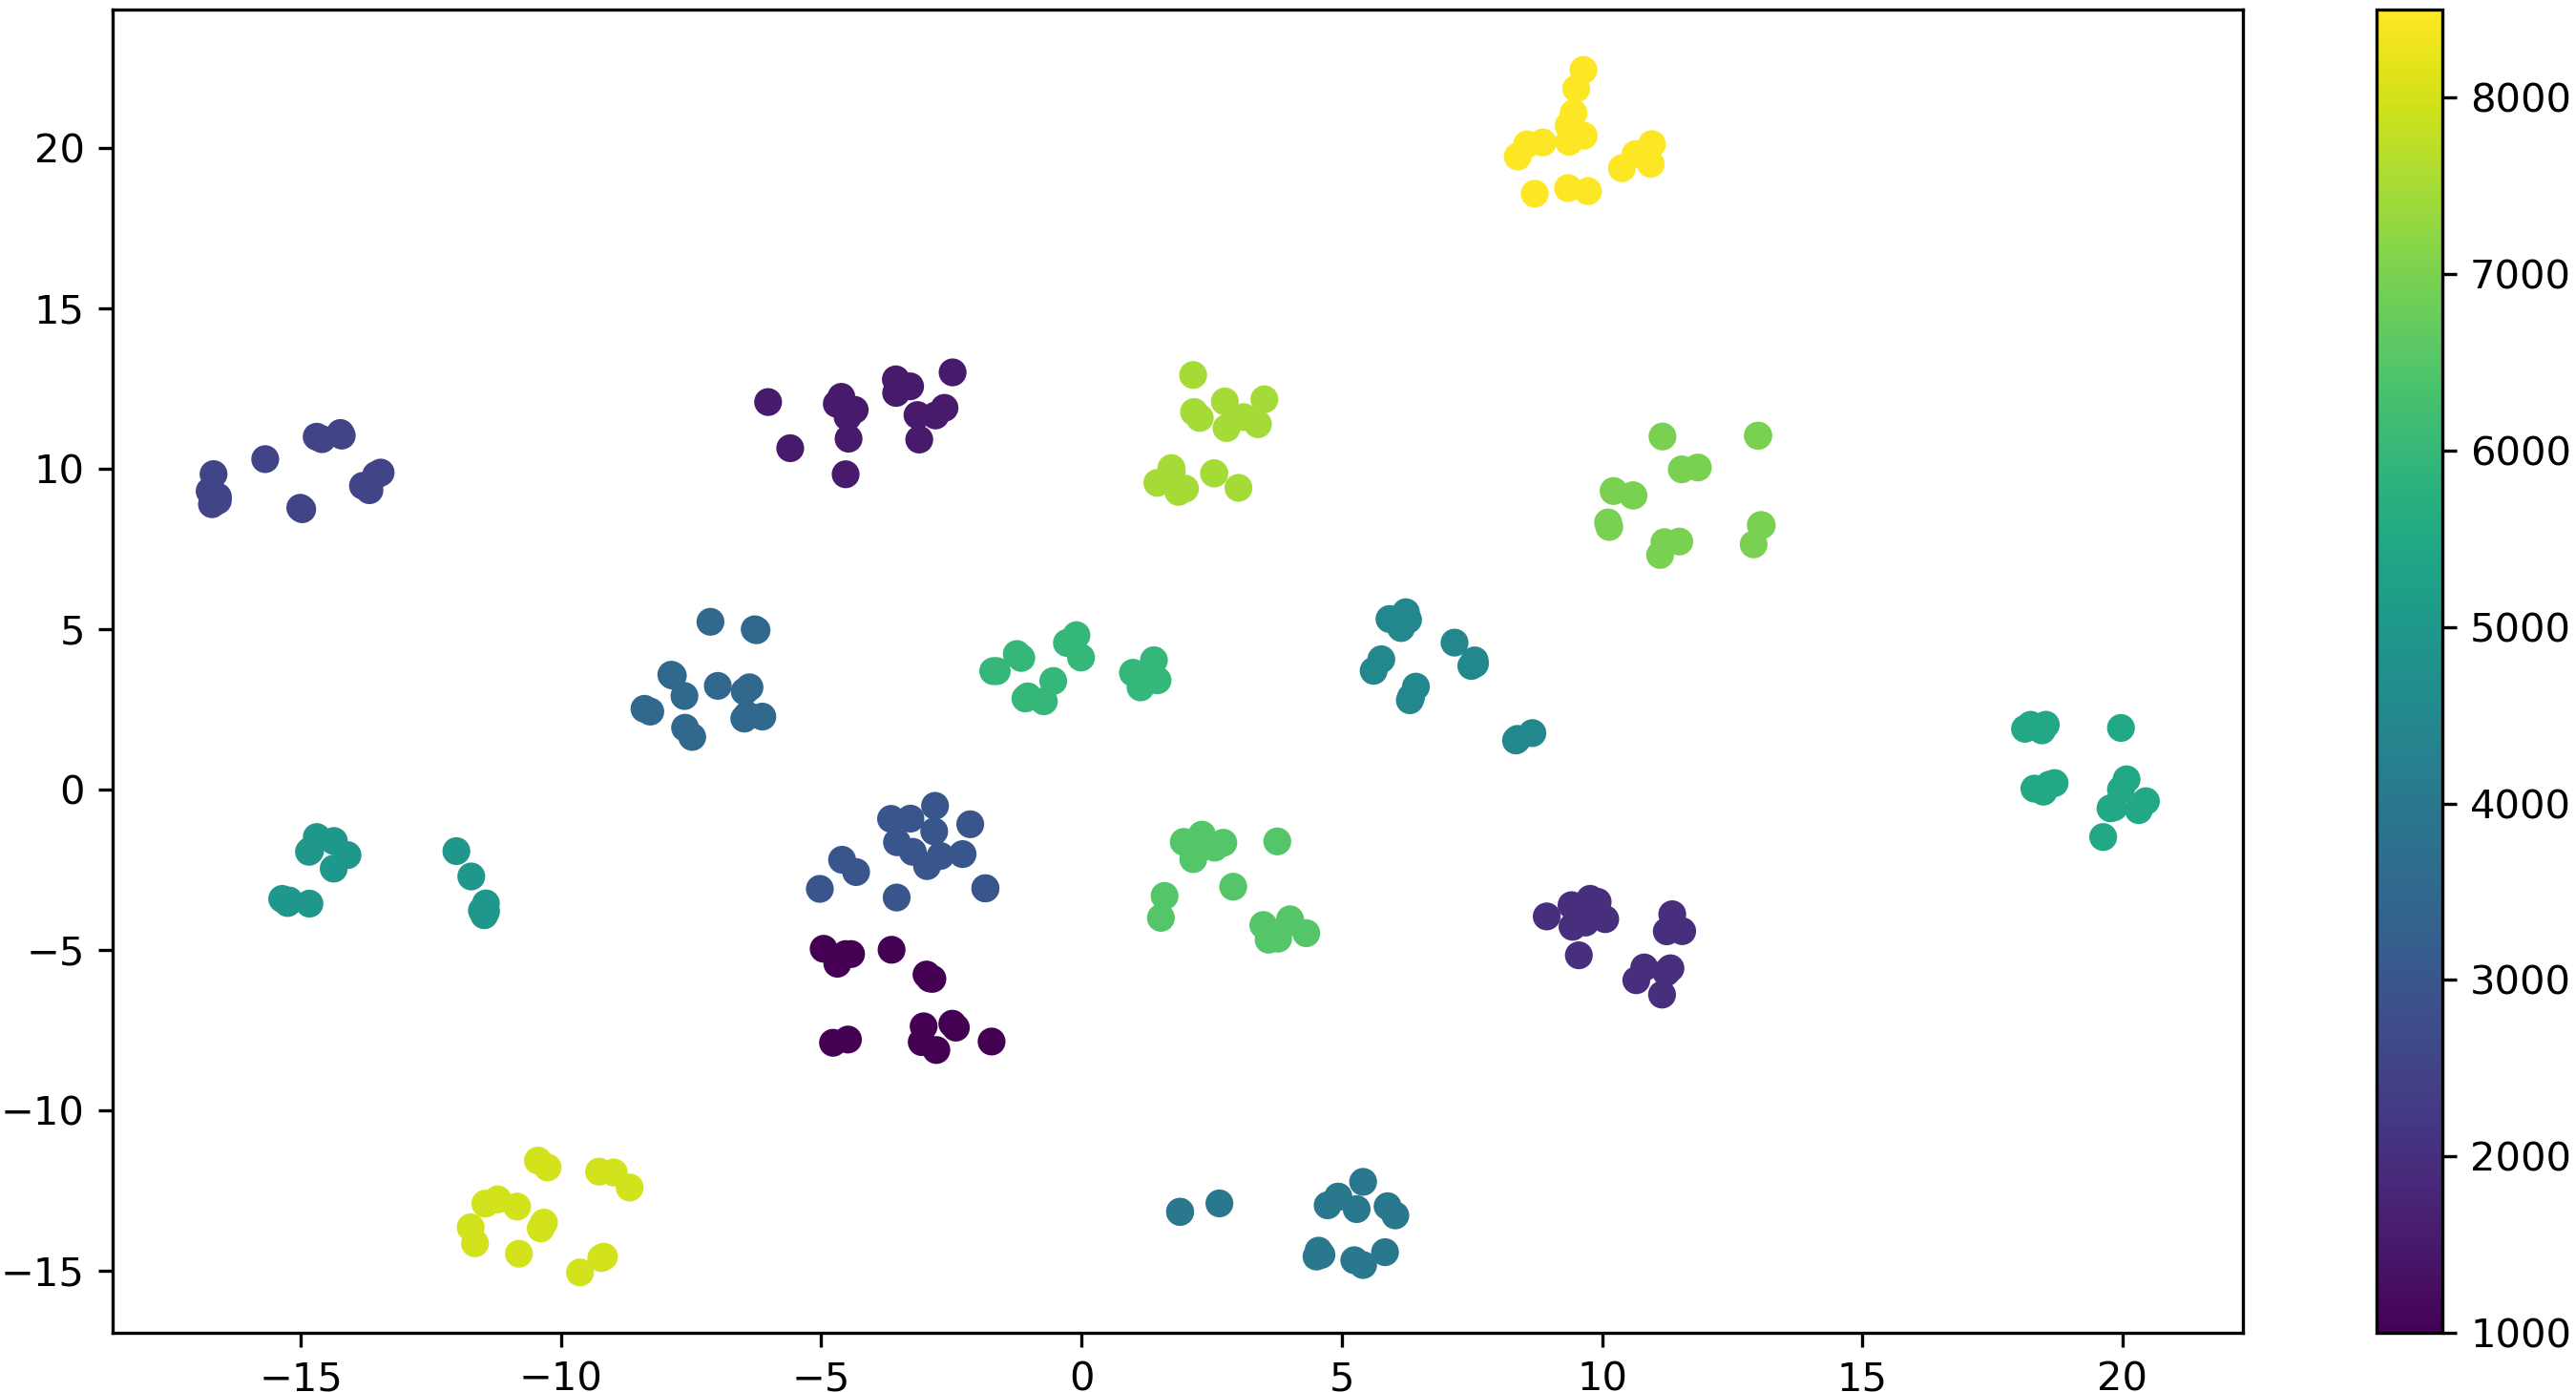
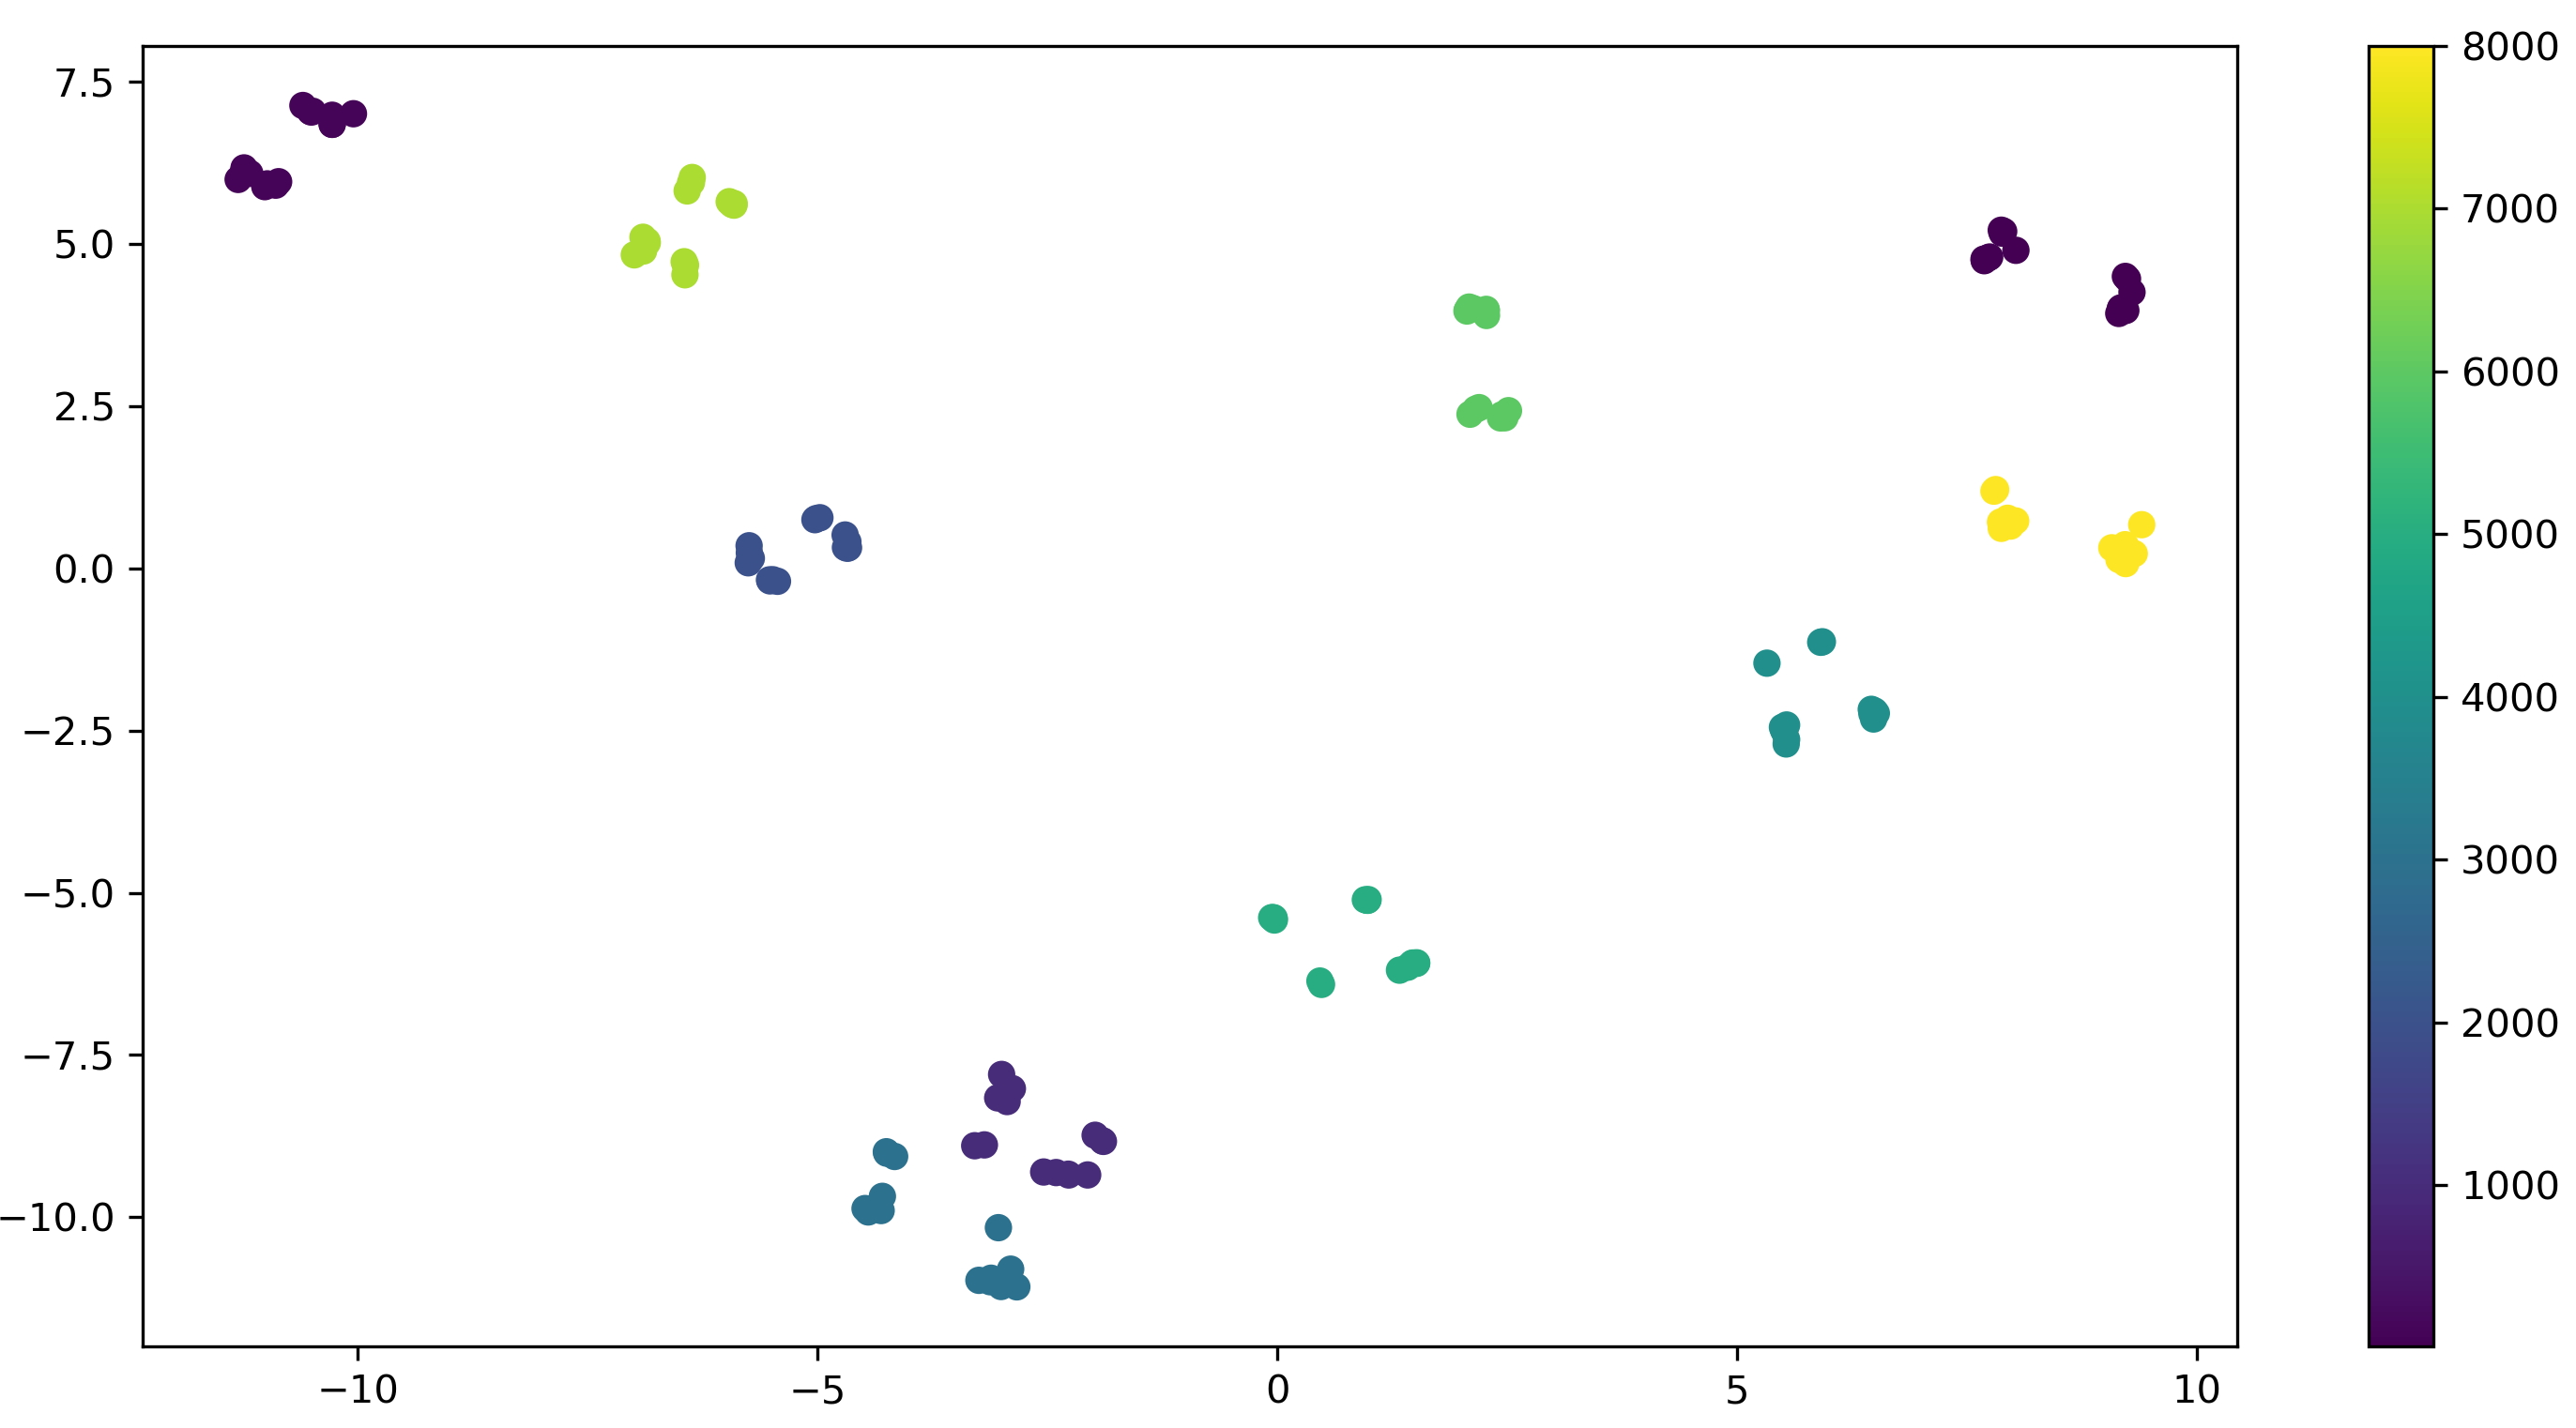
Compared to other visual objects such as faces and pedestrians, vehicles exhibit many distinct challenges to the identification task. The main reasons for these challenges come from the much larger intraclass diversities due to different acquisition viewpoints and the imperceptible interclass differences between the vehicles of the same model type and color. This naturally raises a problem of whether the loss functions designed for face recognition or person ReID work well for the vehicle ReID task. To answer this question, we train two models on an example dataset using the two most common loss functions in face recognition and person ReID, i.e., the original SoftMax loss and the ArcFace loss. As the results shown in Fig. 1, the SoftMax does not work well in both the OFS and FAS, the ArcFace still has a large intraclass distance, which is detrimental to the performance of vehicle ReID. However, it does have a clear margin between different categories. To further improve the loss function, the triple loss (Schroff, Kalenichenko, and Philbin 2015) tries to increase the interclass distance and intraclass similarities for different combinations of the three training samples, two with the same identity, and the other one with a different identity. However, the triplet loss often suffers from slow convergence and poor local optima, partially because the triplet loss employs only one positive/negative example while not interacting with the other positive/negative examples per each update (Sohn 2016).
To develop a more appropriate loss function to deal with the peculiar challenges in the vehicle ReID task, we in this work propose a Distance Shrinking with Angular Marginalizing (DSAM) loss function to improve the performance of deep vehicle ReID models with standard backbone networks. The proposed DSAM loss function performs hybrid learning in both the OFS and the FAS by incorporating the verification and identification signals into the training objective. By shrinking the vehicle training samples with the same identity per training batch online using the local information in the OFS and keeping a static margin between samples with different identities in the FAS from a global perspective, the samples with the same classes will be clustered into the pseudo-class centers automatically. The final distribution of feature representations preserves both a small intraclass distance and a clear boundary between different identities. Moreover, since the shrinking operation is performed in the batch level of the training samples during each training step of the model, it makes full use of local information so that can well suit for the distributions of the current feature representations.
Compared with existing loss functions for recognizing the object identities, the proposed DSAM loss function has the following main advantages:
-
•
It maximizes the interclass distances and intraclass similarities from two feature spaces at the same time and leverages both the local and global information so that it well alleviates the specific challenges in the vehilce ReID problem.
-
•
It incorporates both the identification and verification signals into the learning objective with the iterated execution mechanism during each training step of the model, making it both adaptive and stable, and can speed up the training procedure notably.
-
•
It is straightforward to implement and does not introduce any additional learning parameters for the model, which can be integrated into all the existing SoftMax based loss functions to boost performance.
With the proposed loss function, we have presented a high-performance vehicle ReID model. Extensive experimental analyses and comparisons with many competing methods on three large vehicle ReID benchmarks demonstrate the effectiveness of the proposed loss function. On the PKU-VD1-Large (Yan et al. 2017) dataset, DSAM loss enhances the performance of the SoftMax baseline by a large margin, i.e., for mAP, for cmc1, and for cmc5. On the PKU-VehicleID (Liu et al. 2016a) and VeRi-776 (Liu et al. 2016b, c, 2017b) datasets, the mAP is enhanced by and , respectively. To facilitate further studies in the vehicle ReID problem, the source code, trained models, and all the experimental results will be released.
Related Work
The visual object ReID task aims to find the target object in a large scale gallery with significant progress made in the last decade. Many hand-crafted features are proposed to capture the visual features (Chen et al. 2016; Liao et al. 2015; Shi, Hospedales, and Xiang 2015) and CNN-based features (Cheng et al. 2016; Zhao et al. 2017), significantly improving the person ReID performance. In the following, we mainly discuss the work related to vehicle ReID.
Vehicle ReID. Under unlimited conditions, public large-scale vehicle ReID datasets (Liu et al. 2016b; Guo et al. 2018; Lou et al. 2019a; Liu et al. 2016c, a) with annotation labels and rich attributes are widely collected. These datasets present different challenges in terms of occlusion, lighting, low resolution, and various views. One way to deal with these challenges is to use deep features (Wang et al. 2017b; Liu et al. 2016c) instead of hand-crafted features to describe vehicle images. To learn more powerful features, some methods (Guo et al. 2018; Liu et al. 2016c, 2017b; Wei et al. 2018; Shen et al. 2017) try to explore the details of the vehicle using additional attributes (such as model type, color, space-time information, etc.). Besides, adversarial learning-based methods (Lou et al. 2019b; Zhou and Shao 2017) use a synthetic multi-view vehicle image adversarial network to mitigate the cross-field effect between vehicles. Multi-view learning-based methods (Zhou and Shao 2018; Wang et al. 2017b) implement view-invariant inference by learning the representation of perceptual points.
In addition to learning global vehicle features, a series of part-based methods explicitly utilize discriminative information from multiple vehicle parts. Region-based methods (Liu et al. 2018; Zhu et al. 2019; Chen et al. 2019c) divide the feature map into multiple partitions to extract local feature representations of each region. Attention based (Khorramshahi et al. 2019a; Kanaci et al. 2019; Khorramshahi et al. 2019b) uses key points information to pay more attention to more effective local features.
Loss Functions. In addition to the network structures, the loss functions also play an important role in learning effective feature representations for the ReID task. Different kinds of loss functions have been proposed in the last decades for face recognition and person ReID (Wang et al. 2018c; Chen et al. 2017; Zhu et al. 2020b). Among them, the most widely used loss function is the SoftMax loss (Krizhevsky, Sutskever, and Hinton 2012), which employ the class identification signal from the global perceptive. Following improvements over the SoftMax loss include CosFace (Wang et al. 2018b), ArcFace (Deng et al. 2019), and SphereFace (Liu et al. 2017a), which enhance the global identification signals by adding different constraints in some angular spaces of the feature representations. These loss functions obtain quite good classification results of the object identities. However, it ignores the objects’ local intraclass variations, which impairs the ReID performance, especially for objects with large intraclass variations. The Contrastive loss (Sun et al. 2014) and Triplet loss (Schroff, Kalenichenko, and Philbin 2015) use the verification signal locally to increase the Euclidean margin for better feature embedding. The Center loss (Wen et al. 2016) learns the feature representation center for each identity and uses these centers to reduce the intraclass variations. All the above-discussed loss functions provide excellent insights from a specific perspective for designing effective loss functions. However, they all ignore some factors which will be useful to enhance the loss function further.
In Table 1, we summarize these loss functions by characterizing them from different perspectives, including the use of local and/or global information, the feature space used, the optimization of the interclass and/or intraclass variations. From Table 1, we can observe that the proposed DSAM loss function with SoftMax provides a comprehensive solution with all the factors considered, which optimize the intraclass and interclass variations simultaneously from both the OFS and FAS using the local information and global information at the same time.
| Loss | Local/Global | OFS/FAS | Inter/Intra |
| S | Global | FAS | Inter |
| AF/CF/SF | Global | FAS | Inter |
| T | Local | OFS | Both |
| S-based+T | Both | OFS | Both |
| C | Local | OFS | Inter |
| S-based+C | Both | OFS | Both |
| DSAM | Local | Both | Both |
| S-based+DSAM | Both | Both | Both |
Proposed Approach
Motivation
We started by analyzing different SoftMax based loss functions. The original SoftMax loss is calculated as follows:
| (1) |
where denotes the batch size, is the label of the -th sample, denotes the class number, and are the scores of the -th class and the -th class. The performance of the SoftMax loss function on ReID tasks is not so good since it can not deal with the hard samples well. For example, suppose that the scores are the same for , and the score of the -th class is () times of , then the probability of the -th sample belong to the -th class is calculated as:
| (2) |
The value of tends to approach with large , even for hard samples that have relatively small . In Eq. (3), denotes the -th class’s weight vector, since the value of is very close to for the hard samples, the gradient will vanish:
| (3) |
Based on the above analyses, the model trained by SoftMax loss is easy to get saturated, which results in ambiguous boundaries between different classes since the hard samples near boundaries can contribute little to the training process. In order to obtain clear margins between different categories, the ShpereFace (Liu et al. 2017a), CosFace (Wang et al. 2018b) and ArcFace (Deng et al. 2019) change the original form of the SoftMax loss in an angular margin manner. In ReID tasks, the cosine distance between the probe-gallery pair is used for testing. Thus the angular margin loss, which defines a clear margin in the FAS, often works well:
| (4) |
| (5) |
where denotes the hypersphere scale, and denotes the angular margin penalty between the feature vector and the class weight vector . As Eq. (4), Eq. (5) shows, the angular margin loss normalize and by norm and remove the bias term, so that the loss function can focus on and and use the margin penalty to enlarge the distance between different classes.
However, the angular margin loss is not producing optimal results. The samples within the -th class’s boundary will have a much larger than the other classes’ score since the value is always set to a relatively large value for better convergence (Wang et al. 2017a), the samples located in the marginalized boundary is easy to saturate in terms of . As a result, the gradient will vanish, and no further update will be performed to enhance the intraclass compactness. In order to obtain a more compact distribution with a smaller intraclass distance than the angular margin loss does, we propose our DSAM loss in the next section.
The Proposed DSAM Loss
As deep embedding features always distribute around the weight which can represent the center of features belong to the same ID in the hypersphere (Deng et al. 2019), we can shrink the angle between the weight and the feature to narrow the intraclass distance in angle space. In order to carry out the metric learning scheme, in each batch of training samples, we draw classes and -th class’s samples form a set with the number of samples of , and we define is a set include all samples in per batch.
| (6) |
| (7) |
where and are sets of ’s positive samples and negative samples in per batch, denotes that and belong to the same class and is the anchor feature, and are features with the same label as an anchor in each batch. This loss term aims to minimize the distance between positive samples in the OFS. When the Euclidean distance between the positive samples decreased, samples like , , move towards to which makes approach to . In summary, by minimizing the , the between samples and the can be minimized simultaneously, which will result in the small intraclass distance in both the original and angular space as shown in Fig. 3(b).
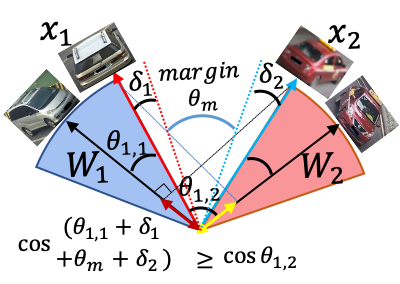
To keep clear boundaries between different classes in the FAS, we deal with it in the FAS directly. We use to denote the difference between and in FAS as:
| (8) |
The is a monotonically increasing function with respect to the angular distance between sample and . Since the hardest sample most likely represents the lower bound of the distance between the negative class and positive class, we use to choose the farthest positive sample for an anchor in each batch and add an additive margin penalty, which is formulated as
| (9) |
where means we only focus on negative samples with different ground-truth labels from the anchor. The loss for negative samples aims to enlarge the angular distance to the pre-defined margin . By doing so, clear boundaries between different classes can be obtained.
Generally, our DSAM loss is the combination of positive and negative loss terms with a constant and is formulated as:
| (10) |
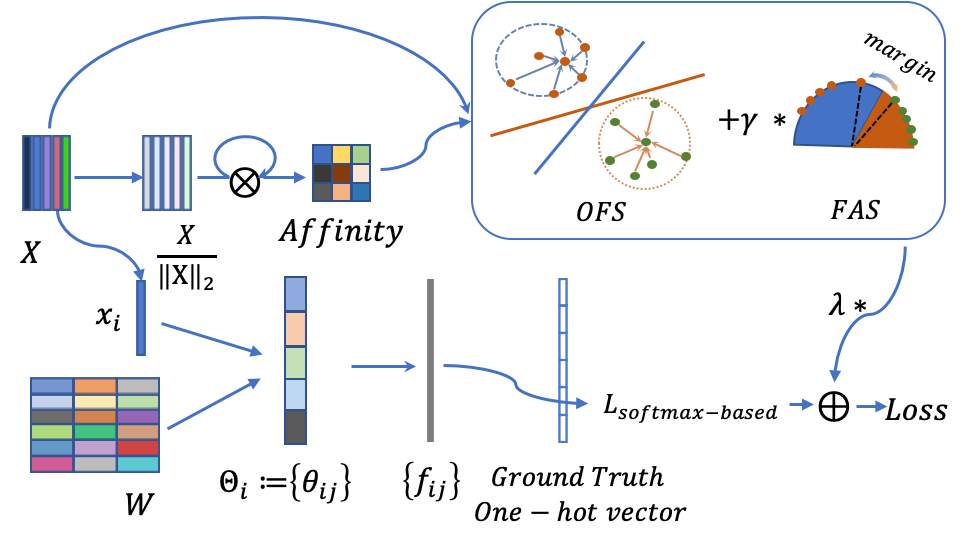
In practice, our DSAM loss is used with SoftMax based loss for model training. The SoftMax based loss can find class centers for each class using global information, and our DSAM loss can cluster the samples to their corresponding centers for a more compact feature distribution. The final loss is defined in Eq. (11) and is the weight for DSAM. Fig. 2 shows the whole training process of our DSAM:
| (11) |
Discussion
In this subsection, we firstly discuss the reason why we use Euclidean distance but not angular distance in , and then illustrate how our DSAM impacts the decision boundary. Finally, we also visualize the comparison between the effect of DSAM loss and the effect of the angular margin loss functions.
In order to shrink the angle between the weight and the feature to narrow the intraclass distance in angle space, it is very natural to use the angular distance directly to decrease the intraclass distance. Assuming that the loss called uses the angular distance directly and is defined as follows,
| (12) |
| (13) |
where and means the and ’s unit vectors which get from Eq. (12), decreases the intraclass distance by minimizing the angular distance directly and the gradient can be calculated as:
| (14) |
In many large-scale datasets, angles between positive samples are very small, and the is limited to . is hard to optimize because of the exploded gradient when and are very close, so we use to minimize the distance between positive samples in the OFS.
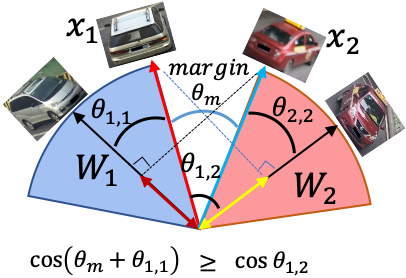
In the FAS, as shown in Fig. 3, we use the -normalized class weight vector and to represent the center of the class and . and denote the -normalized features in different classes, and the angle between and is .
The Softmax loss results in a side-by-side decision boundary and hard samples near the boundary are hard to be separated. Similar effect is also observed in Fig. 1. As shown in Fig. 3, by adding margins in the angular perspective, which is defined in the angular margin losses as , we can obtain a clearer decision boundary where samples are well separated, but the intraclass variance is still large due to gradient vanish discussed in the previous section. As for our DSAM loss, a larger margin between class and can be obtained by reducing the intraclass variance. Assume the intraclass variance is reduced by for each class, the decision boundary produced by our DSAM loss will be:
where is the margin angle produced by angular margin loss which is equivalent to negative sample margin in our DSAM. Based on the result, it is clear that our DSAM loss obtains a lager margin than the angular margin loss by shrinking the intraclass distance.

Experiments
Experimental Settings
Dataset. As shown in Table 2, we use four challenging and commonly used datasets, PKU-VD (including VD1 and VD2) (Yan et al. 2017), VehicleID (PKU-VehicleID) (Liu et al. 2016a) and VeRi-776 (Liu et al. 2016b, c, 2017b).
| Database | Query ID | Gallery ID | Gallery Images |
|---|---|---|---|
| PKU-VD1 | 2000 | 18000 (Small) | 104887 |
| 71165 (Medium) | 422032 | ||
| 71166 (Large) | 673323 | ||
| PKU-VD2 | 2000 | 12000 (Small) | 103550 |
| 40144 (Medium) | 345910 | ||
| 40145 (Large) | 462652 | ||
| VehicleID | 13164 | 13164 (Q-13164) | 13164 |
| 6000 | 6000 (Q-6000) | 6000 | |
| 3200 | 3200 (Q-3200) | 3200 | |
| 2400 | 2400 (Q-2400) | 2400 | |
| 1600 | 1600 (Q-1600) | 1600 | |
| 800 | 800 (Q-800) | 800 | |
| VeRi-776 | 200 | 200 (VeRi-test) | 11579 |
Each dataset in PKU-VD is provided with three testing sets and one training set, and the testing sets of different sizes have the same number of IDs for the query, but the IDs in the gallery are different. For the VehicleID dataset, the number of query IDs is the same as that of gallery IDs. VeRi-776 is a small database with only 776 vehicles, but this dataset has many vehicle information, which can be used as auxiliary information for model training.
Implementation Details. In all the experiments, the input images resized to pixels before sending them to the network. We use the ImageNet pre-trained ResNet-50 (He et al. 2016b) as the basic network architecture by replacing the last fully connected layer with a BN-Dropout structure. To avoid losing too much information, we set the stride of the last convolutional layer to 1. For the ArcFace (Deng et al. 2019) baseline, which is the state-of-the-art loss of all angular margin losses, we set the embedding size to , m to , and s to following the settings in (Deng et al. 2019).
| Method | mAP | cmc1 | cmc5 |
|---|---|---|---|
| R50+SoftMax+DSAM(0.7) | 65.37% | 90.16% | 96.23% |
| R50+SoftMax+DSAM(0.8) | 65.89% | 90.71% | 96.62% |
| R50+SoftMax+DSAM(0.9) | 66.20% | 90.92% | 96.87% |
| Method | VehicleID, mAP% | ||||
|---|---|---|---|---|---|
| Q-13164 | Q-6000 | Q-3200 | Q-2400 | Q-1600 | |
| S(baseline) | 59.88% | 63.61% | 64.64% | 67.36% | 68.68% |
| S+D | 66.95% | 71.38% | 74.10% | 76.70% | 78.88% |
| S+T | 62.71% | 67.30% | 69.15% | 72.24% | 73.88% |
| NS | 49.49% | 54.55% | 56.70% | 59.19% | 61.61% |
| NS+D | 59.73% | 65.44% | 68.25% | 71.24% | 73.96% |
| NS+T | 56.38% | 61.36% | 63.08% | 65.66% | 68.69% |
| Arc | 63.24% | 66.97% | 67.39% | 70.09% | 70.29% |
| Arc+D | 64.25% | 67.36% | 68.67% | 71.32% | 71.88% |
| Arc+T | 64.20% | 67.50% | 68.10% | 70.85% | 71.25% |
| mAP (%) in three datasets | |||||
| Method | PKU-VD1 | VehicleID | VeRi-776 | ||
| Large | Small | Q-13164 | Q-2400 | VeRi-test | |
| S(baseline) | 65.02% | 85.14% | 59.88% | 67.36% | 60.07% |
| S+D | 75.43% | 94.60% | 66.95% | 76.70% | 66.20% |
| S+T | 73.02% | 93.20% | 62.71% | 72.24% | 63.63% |
| Arc | 73.44% | 92.33% | 63.24% | 70.09% | 65.77% |
| Arc+D | 74.81% | 93.95% | 64.25% | 71.32% | 68.48% |
For DSAM, we set margin to , to , and to by cross-validation. We use the batch-hard strategy as the triplet loss in our experiments according to (Kuma et al. 2019). Each batch contains different IDs, and each ID contains different images. During training, we use the SGD optimizer by setting the momentum to and the weight decay to . The learning rate starts from and is divided by every epochs. When the model converges, the learning rate is . During testing, we use the output before the loss function as the feature representations and use the cosine distance to calculate the similarity between the query and gallery images.
| Method | Publication | Backbone | VeID Q-800 | VeID Q-1600 | VeID Q-2400 | |||
| cmc1 | mAP | cmc1 | mAP | cmc1 | mAP | |||
| C2F-Rank (Guo et al. 2018) | AAAI 2018 | GoogLeNet | 61.10% | 63.50% | 56.20% | 60.00% | 51.40% | 53.00% |
| VAMI (Zhou and Shao 2018) | CVPR 2018 | - | 63.12% | - | 52.87% | - | 47.34% | - |
| AAVER (Khorramshahi et al. 2019a) | ICCV 2019 | ResNet-101 | 74.69% | - | 68.62% | - | 63.54% | - |
| HVE (Lou et al. 2019b) | TIP 2019 | Resnet50 | 75.11% | 77.50% | 71.78% | 74.20% | 69.30% | 71.00% |
| RAM (Liu et al. 2018) | ICME 2018 | VGG | 75.20% | - | 72.30% | - | 67.70% | - |
| DF (Zheng et al. 2019a) | - | ResNet-50 | 75.23% | 78.03% | 72.15% | 74.87% | 70.46% | 73.15% |
| P-R (He et al. 2019) | CVPR 2019 | ResNet-50 | 78.40% | - | 75.00% | - | 74.20% | - |
| PRN (Chen, Lagadec, and Bremond 2019) | CVPR_W 2019 | ResNet-50 | 78.92% | - | 74.94% | - | 71.58% | - |
| RNN-HA (Wei et al. 2018) | ACCV 2018 | VGG | 83.80% | - | 81.90% | - | 81.10% | - |
| PVEN (Meng et al. 2020) | CVPR2020 | SeResNeXt50 | 84.70% | - | 80.60% | - | 77.80% | - |
| VANET (Chu et al. 2019) | ICCV 2019 | GoogLeNet | 88.12% | - | 83.17% | - | 80.35% | - |
| R50+S+D(Ours) | ResNet-50 | 93.75% | 83.59% | 91.06% | 78.88% | 90.29% | 76.70% | |
| R50+Arc+D(Ours) | ResNet-50 | 92.12% | 74.35% | 89.79% | 71.88% | 89.79% | 71.32% | |
Evaluation Metrics. We exploit the widely used mean-average-precision (mAP) and Cumulative Matching Characteristic (CMC-n) to evaluate the performance of different methods on different databases. As for the PKU-VD and VehicleID databases, we also use the CMC curve to analyze different loss functions.
Ablation Study
In Table 3, we first explore the optimal value of the margin. It can be seen that when , the experimental results are the best, so we set the margin value of DSAM to in all subsequent experiments.
Table 4 shows the experimental results on the VehicleID (Liu et al. 2016a) dataset. Here, we combined DSAM (D) with SoftMax, normalized SoftMax (Liu et al. 2017a), and AraFace (Deng et al. 2019). DSAM boosts the performance of all the SoftMax-based losses, especially the baseline SoftMax (S). The original performance of the Normalized SoftMax (NS) is relatively bad, but by incorporating our DSAM makes the NS+D even surpass the ArcFace (Arc) on some small testing sets. Besides, it shows from multiple testing sets that DSAM is better than the triplet Loss (T) (Schroff, Kalenichenko, and Philbin 2015) and make the S+D gain the best score.
We also test our DSAM loss on different datasets, and the results are showed in Table 5. We can see that our DSAM (D) works well on both small and large scale testing sets. In contrast, the triplet loss (T) works better on small scale testing sets than on large scale testing sets. On the large testing set of PKU-VD1 (Yan et al. 2017), the S+T’s mAP is lower than Arc’s, but on the small one, the S+T’s mAP is bigger than Arc’s. As for the dataset which has a small scale training set like VeRi-776 (Liu et al. 2016b, c, 2017b), the S+T and S+D are not work well as Arc, but our DSAM can still improve the SoftMax-based losses and works better than T. According to all the results from these three datasets, if the training set is small, the Arc+D works the best, and if the training set is large, the S+D works the best.
| Method | PKU | Large | Medium | Small |
| mAP | mAP | mAP | ||
| BW (18*16) (Kuma et al. 2019) | VD1 | 58.77% | 67.28% | 87.48% |
| ATTS+MGLR (Yan et al. 2017) | 51.10% | 58.30% | 79.10% | |
| R50+S+D (Ours) | 75.43% | 85.00% | 94.60% | |
| R50+Arc+D (Ours) | 74.81% | 84.15% | 93.95% | |
| BW (18*16) (Kuma et al. 2019) | VD2 | 63.63% | 69.87% | 84.55% |
| ATTS+MGLR (Yan et al. 2017) | 55.30% | 60.60% | 74.70% | |
| R50+Arc+D(Ours) | 86.71% | 88.64% | 92.30% | |
| R50+S+D(Ours) | 85.96% | 88.43% | 92.75% |
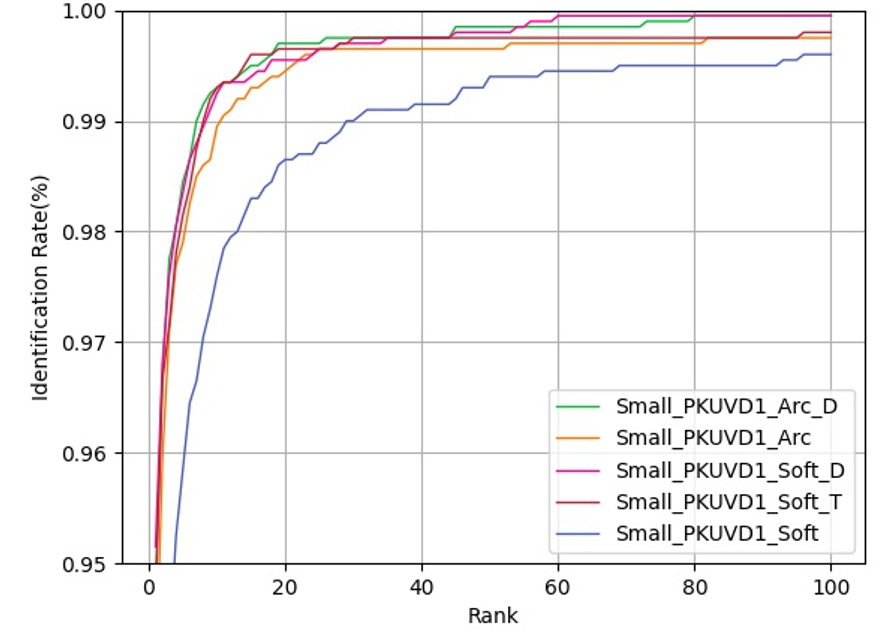
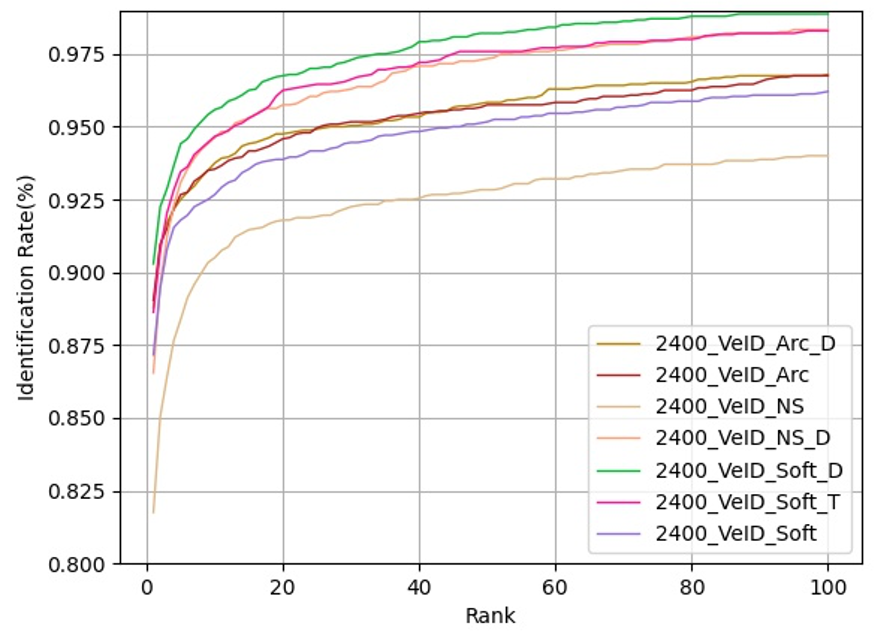
For a more intuitive comparison of these loss functions, we plot the CMC-curve of PKU-VehicleID’s (Liu et al. 2016c) Q-2400 testing set and the PKU-VD1’s (Yan et al. 2017) small testing set in Figure 5. S+D shows the superiority over other loss functions in the large scale datasets.
| VeRi-776 | |||
| Method | mAP | cmc1 | cmc5 |
| PROVID∗ (Liu et al. 2016c) | 27.77% | 61.44% | 78.78% |
| OIFE† (Wang et al. 2017b) | 48.00% | 89.43% | - |
| VAMI†‡ (Zhou and Shao 2018) | 50.13% | 77.03% | 90.82% |
| Path-LSTM∗ (Shen et al. 2017) | 58.27% | 83.49% | 90.04% |
| BS (Kuma et al. 2019) | 67.55% | 90.23% | 96.42% |
| R50+S+D(Ours) | 66.20% | 90.92% | 96.87% |
| R50+Arc+D(Ours) | 68.48% | 91.37% | 97.14% |
Comparison with the State-of-the-Art Methods
We compare our result with the state-of-the-arts in Tabel 7. The model trained by SoftMax with our DSAM obtains the best results on all the testing sets of PKU-VD1 (Yan et al. 2017). On PKU-VD2 (Yan et al. 2017), the model trained by ArcFace (Deng et al. 2019) our DSAM obtains the best results in small testing sets. Since the training set of PKU-VD2 is smaller than that of the PKU-VD1, we conclude that ArcFace+DSAM works better than the SoftMax+DSAM in small dataset.
We also compare our results with the state-of-the-art on PKU-VehicleID (Liu et al. 2016a) and VeRi-776 (Liu et al. 2016b, c, 2017b), and the experimental results are show in Tabel 6 and Table 8 respectively. We refer readers to read our supplementary material for more detailed quantitative evaluations on PKU-VD (Yan et al. 2017) dataset. In Tabel 6, we can see that we get the best score of CMC1 on three testing sets. What is more, the other methods in Tabel 6 have much more complicated model architectures than ours, and we use the ResNet-50 backbone and the SoftMax combined with our DSAM. In the Tabel 6, we can also confirm that the DSAM works better on the large scale datasets than on the small datasets. Nevertheless, the DSAM gets better results on all datasets than other models or loss functions, especially CMC1. From the results in Table 8, our R50+Arc+D gets the best score in CMC1 and CMC5 and we only use the ID information in VeRi-776 (Liu et al. 2016b, c, 2017b).
Conclusions
In this paper, we proposed a Distance Shrinking with Angular Marginalizing loss function, termed as DSAM, which performs hybrid learning in both the Original Feature Space (OFS) and the Feature Angular Space (FAS) by using the local verification and the global identification information respectively. It shrinks the distance between samples of the same class locally in the OFS, while keeps samples of different classes far away in the FAS. Also, it does not introduce any additional learning parameters and is very easy to implement, which can be integrated with all the existing SoftMax based loss functions to boost their performances. Extensive experimental analyses and comparisons with many competing methods on three large vehicle ReID benchmarks demonstrate the proposed loss function’s effectiveness. In addition, the superior performance of shrinking the distance between samples of the same class locally in the OFS and the ability to keep instances of different classes far away in the FAS features further suggested that DSAM loss may improve the work on the person ReID task.
Supplementary Material
Databases and Setting
Samples of variegated databases
| Type | Database | Query ID | Gallery ID | Gallery Images |
| Vehicle | Veri-Wild (Small) | 3000 | 3000 | 38861 |
| Veri-Wild (Medium) | 5000 | 5000 | 64389 | |
| Veri-Wild (Large) | 10000 | 10000 | 128517 | |
| Person | Market-1501 | 750 | 751 | 15913 |
| DukeMTMC-reID | 702 | 1110 | 17661 | |
| CUHK03 (Labeled) | 700 | 700 | 5328 | |
| CUHK03 (Detected) | 700 | 700 | 5332 |
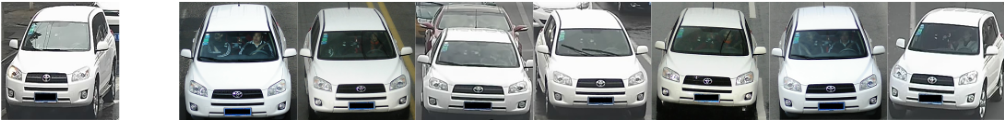
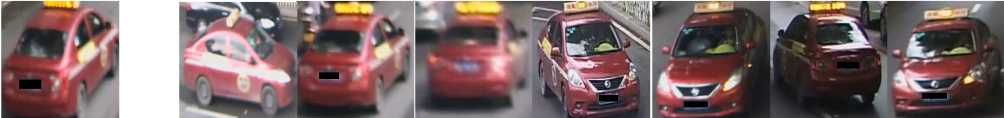
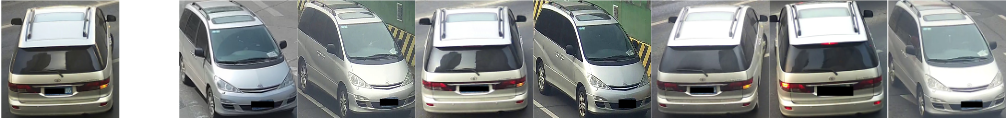
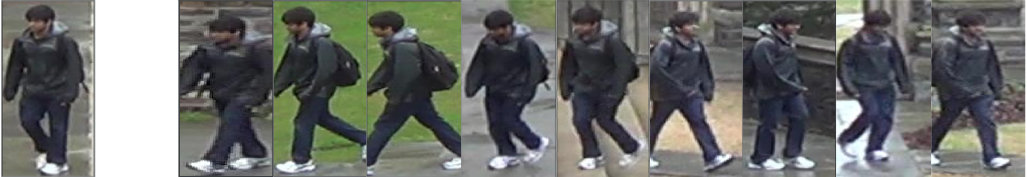
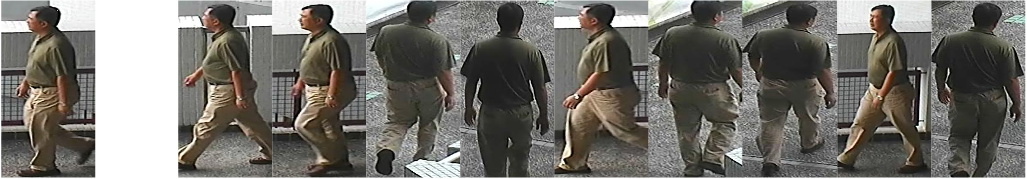
To better show the challenge of Vehicle ReID, we randomly pick up some samples from vehicle databases used in this paper. As Fig. 6 shows, vehicles simultaneously exhibit large intraclass viewpoint variations and interclass visual similarities. Different samples with the same id have large intraclass variations (e.g., different backgrounds, viewpoints, illuminations, etc.), which indicate the margin between different classes are small, and many hard instances per class.

| Method | Veri-Wild | |||||
|---|---|---|---|---|---|---|
| Small | Medium | Large | ||||
| mAP | CMC-1 | mAP | CMC-1 | mAP | CMC-1 | |
| S(baseline) | 51.40% | 89.47% | 47.04% | 86.19% | 41.42% | 81.78% |
| S+D | 69.24% | 89.90% | 63.50% | 86.20% | 50.55% | 81.80% |
| S+T | 53.28% | 89.70% | 48.31% | 85.90% | 42.00% | 81.38% |
| Arc | 49.11% | 88.77% | - | - | - | - |
| Arc+D | 54.67% | 89.70% | 49.23% | 85.08% | 42.65% | 80.80% |
| Veri-Wild | ||||||
|---|---|---|---|---|---|---|
| Method | Small | Medium | Large | |||
| mAP | cmc1 | mAP | cmc1 | mAP | cmc1 | |
| GoogLeNet (Yang et al. 2015) | 24.27% | 57.16% | 24.15% | 53.16% | 21.53% | 44.61% |
| CCL (Liu et al. 2016a) | 22.50% | 56.96% | 19.28% | 51.92% | 14.81% | 44.60% |
| HDC (Yuan, Yang, and Zhang 2017) | 29.14% | 57.10% | 24.76% | 49.64% | 18.30% | 43.97% |
| U-GAN (Zhu et al. 2017) | 29.86% | 58.06% | 24.71% | 51.58% | 18.23% | 43.63% |
| FDA-Net (Lou et al. 2019a) | 35.11% | 64.03% | 29.80% | 57.82% | 22.78% | 49.43% |
| MLSL (Alfasly et al. 2019) | 46.32% | 86.03% | 42.37% | 83.00% | 36.61% | 77.51% |
| BS (Kuma et al. 2019) | 68.79% | 82.90% | 61.11% | 77.68% | 49.79% | 69.59% |
| R50+S+D(Our) | 69.24% | 89.90% | 63.50% | 86.20% | 50.55% | 81.80% |
| Method | Publication | DukeMTMC-reID | Maarket-1501 | ||
| mAP(%) | R-1(%) | mAP(%) | R-1(%) | ||
| PGFA (Miao et al. 2019) | ICCV’19 | 65.5 | 82.6 | 76.8 | 91.2 |
| CAMA (Yang et al. 2019) | CVPR’19 | 72.9 | 85.8 | 84.5 | 94.7 |
| (Guo et al. 2019) | ICCV’19 | 73.1 | 86.5 | 85.6 | 95.2 |
| SNR (Jin et al. 2020) | CVPR’20 | 73.2 | 85.5 | 82.3 | 93.4 |
| IANet (Hou et al. 2019) | CVPR’19 | 73.4 | 87.1 | 83.1 | 94.4 |
| OSNet (Zhou et al. 2019) (B) | ICCV’19 | 73.5 | 86.6 | 84.9 | 94.8 |
| DSA-re-ID (Zhang et al. 2019) | CVPR’19 | 74.3 | 86.2 | 87.6 | 95.7 |
| AANet (Tay, Roy, and Yap 2019) | CVPR’19 | 74.3 | 87.7 | 83.4 | 93.9 |
| DGNet (Zheng et al. 2019c) | CVPR’19 | 74.8 | 86.6 | 86.0 | 94.8 |
| CtF (Wang et al. 2020a) | ECCV’20 | 74.8 | 87.6 | 84.0 | 93.7 |
| HOReID (Wang et al. 2020b) | CVPR’20 | 75.6 | 86.9 | 84.9 | 94.2 |
| SCSN (Chen et al. 2020) | CVPR’20 | 79.0 | 91.0 | 88.5 | 95.7 |
| ISP (Zhu et al. 2020a) | ECCV’20 | 80.0 | 89.6 | 88.6 | 95.3 |
| OSNet+S+T (w/o rr) | - | 76.6 | 88.1 | 86.1 | 94.6 |
| OSNet+S+D (w/o rr) | Ours | 78.6 | 89.2 | 87.7 | 95.3 |
| OSNet+S+D (rr) | Ours | 88.9 | 91.3 | 94.4 | 96.1 |
| CUHK03 | |||||
| Method | Publication | Labeled | Detected | ||
| mAP(%) | R-1(%) | mAP(%) | R-1(%) | ||
| MLFN (Chang, Hospedales, and Xiang 2018) | CVPR’18 | 49.2 | 54.7 | 47.8 | 52.8 |
| MGN (Wang et al. 2018a) | MM’18 | 67.4 | 68.0 | 66.0 | 68.0 |
| MHN (Chen, Deng, and Hu 2019) | ICCV’19 | 72.4 | 77.2 | 65.4 | 71.7 |
| Auto-ReID (Quan et al. 2019) | ICCV’19 | 73.0 | 77.9 | 69.3 | 73.3 |
| BDB (Dai et al. 2019) | ICCV’19 | 76.7 | 79.4 | 73.5 | 76.4 |
| Pyramid (Zheng et al. 2019b) | CVPR’19 | 76.9 | 78.9 | 74.8 | 78.9 |
| OSNet (Zhou et al. 2019) (B) | ICCV’19 | - | - | 67.8 | 72.3 |
| OSNet+S+T (w/o rr) | - | 72.4 | 75.7 | 69.1 | 73.1 |
| OSNet+S+D (w/o rr) | Ours | 76.7 | 78.4 | 74.4 | 77.3 |
| OSNet+S+D (rr) | Ours | 87.9 | 86.4 | 85.2 | 83.6 |
So the angular margin losses based on the SoftMax loss may not be useful. In order to show DSAM loss outperforms the angular margin loss and triplet loss in the large-intraclass-distance Vehicle ReID tasks, we experiment on Veri-Wild (Lou et al. 2019a) database, which has considerable intraclass variations. As Fig. 6(d) shows, samples in Veri-Wild database with the same id are under many different viewpoints, different illuminations, and different backgrounds. Though samples in VeRi-776 (Liu et al. 2016b, c, 2017b) also have large intraclass variation, the number of ids is so small that VeRi-776 is not as complex as Veri-Wild.
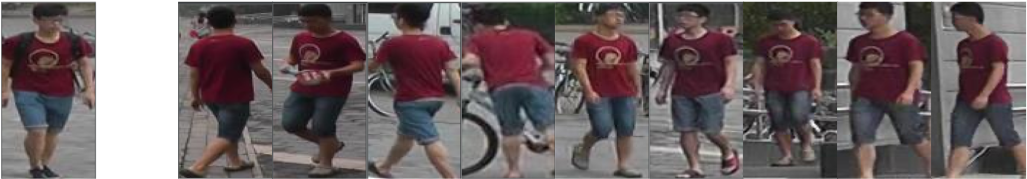
As shown in Fig. 6, different images of one person have different backgrounds, viewpoints, illuminations, etc. And these elements can also cause the large intraclass distance and small interclass distance in Person ReID tasks. Since the Person ReID tasks have the same challenge as the Vehicle ReID tasks have, we also experiment on three Person ReID databases, Market-1501 (Zheng et al. 2015), DukeMCMT-reID (Ristani et al. 2016), and CUHK03 (Li et al. 2014), to show that the impressive performance of DSAM loss in ReID tasks.
Databases addition and Experiment setting
As Table. 9 shows, the Vehicle ReID database, Veri-Wild, has three test sets with different numbers of query id and different gallery id. And detailed statistics of the three widely used Person ReID datasets are provided in Table. 9.
As for Person ReID tasks, we also use Cumulative matching characteristics (CMC) Rank-1 accuracy and mean-average-precision (mAP) to evaluate the performance of DSAM loss. In all the Person ReID experiments, the input images resized to 256128 pixels before sending them to the network. We use the ImageNet pre-trained OSNet (Zhou et al. 2019) as the basic network architecture. For DSAM loss, we set margin to , to , and to by cross-validation. We use the batch-hard strategy as the triplet loss in our experiments according to (Kuma et al. 2019). Each batch contains different IDs, and each ID contains different images. During training, we use the SGD optimizer by setting the momentum to and the weight decay to . The learning rate starts from and is divided by every epochs. When the model converges, the learning rate is . During testing, we use the output before the loss function as the feature representations and use the cosine distance to calculate the similarity between the query and gallery images.
More comparisons
Comparisons on Veri-Wild
Table. 10 shows that the mAP score of “S+D” loss is much higher than the mAP score of baseline loss and Arcface loss. Moreover, in such Vehicle ReID databases with huge intra-class variation, compared to the softmax, the Angular Margin (Arcface) Loss may not improve the performance. However, our DSAM loss still boosts the mAP by almost 18% in the small test datasets. The triplet loss is useful, but our DSAM loss outperforms it by a large margin. The triplet contributes little on a large scale test set where mAP is only increased by 0.58%. Meanwhile, our DSAM loss can improve the baseline by 11.13% on a large scale test set.
In the Table. 11, we compare our result with the recent state-of-the-arts result on Veri-Wild and the Resnet50 trained by “S+D” performance well.
Comparisons on DukeMTMC-reID and Market-1501
As Table. 12 shows, the DSAM loss outperforms the triplet loss a large margin. We use OSNet (Zhou et al. 2019) as our backbone network. The comparison between the results of the OSNet and the results of the OSNet trained by DSAM loss and SoftMax shows that the DSAM loss improve the performance of OSNet by 5.1%/2.6% on mAP/Rank-1 on DukeMTMC-reID and by 2.78%/0.5% on mAP/Rank-1 on Market-1501. As for trplet loss, our DSAM loss beats the triplet loss by 2.0%/1.1% on mAP/Rank-1 on DukeMTMC-reID and by 1.6%/0.7% on mAP/Rank-1 on Market-1501. With re-ranking, the results of OSNet trained by DSAM loss outperform many much more complex backbone networks and achieve state-of-the-art performance. The impressive performance surpasses the second place, ISP (Zhu et al. 2020a), with a considerable margin on both DukeMTMC-reID and Market-1501.
Comparisons on CUHK03
As shown in Table. 13, the OSNet trained by DSAM loss surpasses the original OSNet by 6.6%/5.0% on mAP/Rank-1 in CUHK03-Detected dataset. As for mAP, the DSAM loss beats triplet loss by 4.3% on CUHK03-Labeled and 5.3% on CUHK03-Detected. With re-ranking, the results of OSNet trained by DSAM loss achieve state-of-the-art performance on both CUHK03-Labeled and CUHK03-Detected.
References
- Alfasly et al. (2019) Alfasly, S.; Hu, Y.; Li, H.; Liang, T.; Jin, X.; Liu, B.; and Zhao, Q. 2019. Multi-Label-Based Similarity Learning for Vehicle Re-Identification. IEEE Access 7: 162605–162616.
- Bai et al. (2018) Bai, Y.; Lou, Y.; Gao, F.; Wang, S.; Wu, Y.; and Duan, L. 2018. Group Sensitive Triplet Embedding for Vehicle Re-identification. IEEE Transactions on Multimedia 20(9): 2385 – 2399.
- Chang, Hospedales, and Xiang (2018) Chang, X.; Hospedales, T. M.; and Xiang, T. 2018. Multi-level factorisation net for person re-identification. In Proceedings of the IEEE Conference on Computer Vision and Pattern Recognition, 2109–2118.
- Chen, Deng, and Hu (2019) Chen, B.; Deng, W.; and Hu, J. 2019. Mixed high-order attention network for person re-identification. In Proceedings of the IEEE International Conference on Computer Vision, 371–381.
- Chen et al. (2016) Chen, D.; Yuan, Z.; Chen, B.; and Zheng, N. 2016. Similarity Learning with Spatial Constraints for Person Re-identification. In IEEE Conference on Computer Vision and Pattern Recognition.
- Chen et al. (2019a) Chen, G.; Lin, C.; Ren, L.; Lu, J.; and Zhou, J. 2019a. Self-Critical Attention Learning for Person Re-Identification. In IEEE International Conference on Computer Vision, 9637–9646.
- Chen, Lagadec, and Bremond (2019) Chen, H.; Lagadec, B.; and Bremond, F. 2019. Partition and Reunion: A Two-Branch Neural Network for Vehicle Re-identification. In Proceedings of the IEEE/CVF Conference on Computer Vision and Pattern Recognition (CVPR) Workshops.
- Chen et al. (2019b) Chen, T.; Ding, S.; Xie, J.; Yuan, Y.; Chen, W.; Yang, Y.; Ren, Z.; and Wang, Z. 2019b. ABD-Net: Attentive but Diverse Person Re-Identification. In IEEE International Conference on Computer Vision, 8351–8361.
- Chen et al. (2017) Chen, W.; Chen, X.; Zhang, J.; and Huang, K. 2017. Beyond Triplet Loss: A Deep Quadruplet Network for Person Re-Identification. In IEEE Conference on Computer Vision and Pattern Recognition.
- Chen et al. (2020) Chen, X.; Fu, C.; Zhao, Y.; Zheng, F.; Song, J.; Ji, R.; and Yang, Y. 2020. Salience-Guided Cascaded Suppression Network for Person Re-Identification. In Proceedings of the IEEE/CVF Conference on Computer Vision and Pattern Recognition, 3300–3310.
- Chen et al. (2019c) Chen, Y.; Jing, L.; Vahdani, E.; Zhang, L.; He, M.; and Tian, Y. 2019c. Multi-camera vehicle tracking and re-identification on AI City Challenge 2019. In Proc. CVPR Workshops.
- Cheng et al. (2016) Cheng, D.; Gong, Y.; Zhou, S.; Wang, J.; and Zheng, N. 2016. Person Re-Identification by Multi-Channel Parts-Based CNN With Improved Triplet Loss Function. In IEEE Conference on Computer Vision and Pattern Recognition.
- Chu et al. (2019) Chu, R.; Sun, Y.; Li, Y.; Liu, Z.; Zhang, C.; and Wei, Y. 2019. Vehicle re-identification with viewpoint-aware metric learning. In Proceedings of the IEEE International Conference on Computer Vision, 8282–8291.
- Dai et al. (2019) Dai, Z.; Chen, M.; Gu, X.; Zhu, S.; and Tan, P. 2019. Batch DropBlock network for person re-identification and beyond. In Proceedings of the IEEE International Conference on Computer Vision, 3691–3701.
- Deng et al. (2019) Deng, J.; Guo, J.; Xue, N.; and Zafeiriou, S. 2019. Arcface: Additive angular margin loss for deep face recognition. In Proceedings of the IEEE Conference on Computer Vision and Pattern Recognition, 4690–4699.
- Guo et al. (2018) Guo, H.; Zhao, C.; Liu, Z.; Wang, J.; and Lu, H. 2018. Learning Coarse-to-Fine Structured Feature Embedding for Vehicle Re-Identification. In AAAI Conference on Artificial Intelligence.
- Guo et al. (2019) Guo, J.; Yuan, Y.; Huang, L.; Zhang, C.; Yao, J.-G.; and Han, K. 2019. Beyond human parts: Dual part-aligned representations for person re-identification. In Proceedings of the IEEE International Conference on Computer Vision, 3642–3651.
- He et al. (2019) He, B.; Li, J.; Zhao, Y.; and Tian, Y. 2019. Part-regularized near-duplicate vehicle re-identification. In Proceedings of the IEEE Conference on Computer Vision and Pattern Recognition, 3997–4005.
- He et al. (2016a) He, K.; Zhang, X.; Ren, S.; and Sun, J. 2016a. Deep Residual Learning for Image Recognition. In IEEE Conference on Computer Vision and Pattern Recognition, 770–778.
- He et al. (2016b) He, K.; Zhang, X.; Ren, S.; and Sun, J. 2016b. Deep residual learning for image recognition. In Proceedings of the IEEE conference on computer vision and pattern recognition, 770–778.
- Hermans, Beyer, and Leibe (2017) Hermans, A.; Beyer, L.; and Leibe, B. 2017. In Defense of the Triplet Loss for Person Re-Identification. ArXiv preprint arXiv:1703.07737 .
- Hou et al. (2019) Hou, R.; Ma, B.; Chang, H.; Gu, X.; Shan, S.; and Chen, X. 2019. Interaction-and-aggregation network for person re-identification. In Proceedings of the IEEE Conference on Computer Vision and Pattern Recognition, 9317–9326.
- Jin et al. (2020) Jin, X.; Lan, C.; Zeng, W.; Chen, Z.; and Zhang, L. 2020. Style normalization and restitution for generalizable person re-identification. In Proceedings of the IEEE/CVF Conference on Computer Vision and Pattern Recognition, 3143–3152.
- Kanaci et al. (2019) Kanaci, A.; Li, M.; Gong, S.; and Rajamanoharan, G. 2019. Multi-task mutual learning for vehicle re-identification. In Proceedings of the IEEE Conference on Computer Vision and Pattern Recognition Workshops, 62–70.
- Khorramshahi et al. (2019a) Khorramshahi, P.; Kumar, A.; Peri, N.; Rambhatla, S. S.; Chen, J.-C.; and Chellappa, R. 2019a. A dual path modelwith adaptive attention for vehicle re-identification. arXiv preprint arXiv:1905.03397 .
- Khorramshahi et al. (2019b) Khorramshahi, P.; Peri, N.; Kumar, A.; Shah, A.; and Chellappa, R. 2019b. Attention driven vehicle re-identification and unsupervised anomaly detection for traffic understanding. In Proc. CVPR Workshops, 239–246.
- Krizhevsky, Sutskever, and Hinton (2012) Krizhevsky, A.; Sutskever, I.; and Hinton, G. 2012. ImageNet Classification with Deep Convolutional Neural Networks. In Advances in Neural Information Processing Systems, 1097–1105.
- Kuma et al. (2019) Kuma, R.; Weill, E.; Aghdasi, F.; and Sriram, P. 2019. Vehicle re-identification: an efficient baseline using triplet embedding. In 2019 International Joint Conference on Neural Networks (IJCNN), 1–9. IEEE.
- Li et al. (2014) Li, W.; Zhao, R.; Xiao, T.; and Wang, X. G. 2014. DeepReID: Deep Filter Pairing Neural Network for Person Re-identification. In IEEE Conference on Computer Vision and Pattern Recognition.
- Liao et al. (2015) Liao, S.; Hu, Y.; Zhu, X.; and Li, S. Z. 2015. Person Re-identification by Local Maximal Occurrence Representation and Metric Learning. In IEEE Conference on Computer Vision and Pattern Recognition.
- Liu et al. (2016a) Liu, H.; Tian, Y.; Wang, Y.; Pang, L.; and Huang, T. 2016a. Deep Relative Distance Learning: Tell the Difference between Similar Vehicles. In IEEE Conference on Computer Vision and Pattern Recognition, 2167–2175.
- Liu et al. (2017a) Liu, W.; Wen, Y.; Yu, Z.; Li, M.; Raj, B.; and Song, L. 2017a. Sphereface: Deep hypersphere embedding for face recognition. In Proceedings of the IEEE conference on computer vision and pattern recognition, 212–220.
- Liu et al. (2016b) Liu, X.; Liu, W.; Ma, H.; and Fu, H. 2016b. Large-scale vehicle re-identification in urban surveillance videos. In 2016 IEEE International Conference on Multimedia and Expo (ICME), 1–6. IEEE.
- Liu et al. (2016c) Liu, X.; Liu, W.; Mei, T.; and Ma, H. 2016c. A Deep Learning-Based Approach to Progressive Vehicle Re-identification for Urban Surveillance. In European Conference on Computer Vision, 869–884. Springer.
- Liu et al. (2017b) Liu, X.; Liu, W.; Mei, T.; and Ma, H. 2017b. Provid: Progressive and multimodal vehicle reidentification for large-scale urban surveillance. IEEE Transactions on Multimedia 20(3): 645–658.
- Liu et al. (2018) Liu, X.; Zhang, S.; Huang, Q.; and Gao, W. 2018. Ram: a region-aware deep model for vehicle re-identification. In 2018 IEEE International Conference on Multimedia and Expo (ICME), 1–6. IEEE.
- Lou et al. (2019a) Lou, Y.; Bai, Y.; Liu, J.; Wang, S.; and Duan, L. 2019a. Veri-wild: A large dataset and a new method for vehicle re-identification in the wild. In Proceedings of the IEEE Conference on Computer Vision and Pattern Recognition, 3235–3243.
- Lou et al. (2019b) Lou, Y.; Bai, Y.; Liu, J.; Wang, S.; and Duan, L.-Y. 2019b. Embedding adversarial learning for vehicle re-identification. IEEE Transactions on Image Processing 28(8): 3794–3807.
- Maaten and Hinton (2008) Maaten, L. v. d.; and Hinton, G. 2008. Visualizing data using t-SNE. Journal of machine learning research 9(Nov): 2579–2605.
- Meng et al. (2020) Meng, D.; Li, L.; Liu, X.; Li, Y.; Yang, S.; Zha, Z.-J.; Gao, X.; Wang, S.; and Huang, Q. 2020. Parsing-based View-aware Embedding Network for Vehicle Re-Identification. In Proceedings of the IEEE/CVF Conference on Computer Vision and Pattern Recognition, 7103–7112.
- Miao et al. (2019) Miao, J.; Wu, Y.; Liu, P.; Ding, Y.; and Yang, Y. 2019. Pose-guided feature alignment for occluded person re-identification. In Proceedings of the IEEE International Conference on Computer Vision, 542–551.
- Quan et al. (2019) Quan, R.; Dong, X.; Wu, Y.; Zhu, L.; and Yang, Y. 2019. Auto-reid: Searching for a part-aware convnet for person re-identification. In Proceedings of the IEEE International Conference on Computer Vision, 3750–3759.
- Ristani et al. (2016) Ristani, E.; Solera, F.; Zou, R.; Cucchiara, R.; and Tomasi, C. 2016. Performance measures and a data set for multi-target, multi-camera tracking. In European Conference on Computer Vision, 17–35. Springer.
- Schroff, Kalenichenko, and Philbin (2015) Schroff, F.; Kalenichenko, D.; and Philbin, J. 2015. FaceNet: A Unified Embedding for Face Recognition and Clustering. In IEEE Conference on Computer Vision and Pattern Recognition, 815–823.
- Shen et al. (2017) Shen, Y.; Xiao, T.; Li, H.; Yi, S.; and Wang, X. 2017. Learning deep neural networks for vehicle re-id with visual-spatio-temporal path proposals. In Proceedings of the IEEE International Conference on Computer Vision, 1900–1909.
- Shi, Hospedales, and Xiang (2015) Shi, Z.; Hospedales, T. M.; and Xiang, T. 2015. Transferring a semantic representation for person re-identification and search. In Proceedings of the IEEE Conference on Computer Vision and Pattern Recognition, 4184–4193.
- Simonyan and Zisserman (2015) Simonyan, K.; and Zisserman, A. 2015. Very Deep Convolutional Networks for Large-Scale Image Recognition. In International Conference on Learning Representations, 1–14.
- Sohn (2016) Sohn, K. 2016. Improved deep metric learning with multi-class n-pair loss objective. In Advances in neural information processing systems, 1857–1865.
- Sun et al. (2014) Sun, Y.; Chen, Y.; Wang, X.; and Tang, X. 2014. Deep learning face representation by joint identification-verification. In Advances in Neural Information Processing Systems, 1988–1996.
- Tay, Roy, and Yap (2019) Tay, C.-P.; Roy, S.; and Yap, K.-H. 2019. Aanet: Attribute attention network for person re-identifications. In Proceedings of the IEEE Conference on Computer Vision and Pattern Recognition, 7134–7143.
- Wang et al. (2017a) Wang, F.; Xiang, X.; Cheng, J.; and Yuille, A. L. 2017a. Normface: L2 hypersphere embedding for face verification. In Proceedings of the 25th ACM international conference on Multimedia, 1041–1049.
- Wang et al. (2020a) Wang, G.; Gong, S.; Cheng, J.; and Hou, Z. 2020a. Faster Person Re-Identification. arXiv preprint arXiv:2008.06826 .
- Wang et al. (2020b) Wang, G.; Yang, S.; Liu, H.; Wang, Z.; Yang, Y.; Wang, S.; Yu, G.; Zhou, E.; and Sun, J. 2020b. High-Order Information Matters: Learning Relation and Topology for Occluded Person Re-Identification. In Proceedings of the IEEE/CVF Conference on Computer Vision and Pattern Recognition, 6449–6458.
- Wang et al. (2018a) Wang, G.; Yuan, Y.; Chen, X.; Li, J.; and Zhou, X. 2018a. Learning discriminative features with multiple granularities for person re-identification. In Proceedings of the 26th ACM international conference on Multimedia, 274–282.
- Wang et al. (2018b) Wang, H.; Wang, Y.; Zhou, Z.; Ji, X.; Gong, D.; Zhou, J.; Li, Z.; and Liu, W. 2018b. Cosface: Large margin cosine loss for deep face recognition. In Proceedings of the IEEE Conference on Computer Vision and Pattern Recognition, 5265–5274.
- Wang et al. (2018c) Wang, X.; Wang, S.; Zhang, S.; Fu, T.; Shi, H.; and Mei, T. 2018c. Support vector guided softmax loss for face recognition. arXiv preprint arXiv:1812.11317 .
- Wang et al. (2017b) Wang, Z.; Tang, L.; Liu, X.; Yao, Z.; Yi, S.; Shao, J.; Yan, J.; Wang, S.; Li, H.; and Wang, X. 2017b. Orientation Invariant Feature Embedding and Spatial Temporal Regularization for Vehicle Re-Identification. In IEEE International Conference on Computer Vision, 379–387.
- Wei et al. (2018) Wei, X.-S.; Zhang, C.-L.; Liu, L.; Shen, C.; and Wu, J. 2018. Coarse-to-fine: A RNN-based hierarchical attention model for vehicle re-identification. In Asian Conference on Computer Vision, 575–591. Springer.
- Wen et al. (2016) Wen, Y.; Zhang, K.; Li, Z.; and Qiao, Y. 2016. A discriminative feature learning approach for deep face recognition. In European conference on computer vision, 499–515. Springer.
- Wojke and Bewley (2018) Wojke, N.; and Bewley, A. 2018. Deep Cosine Metric Learning for Person Re-identification. In 2018 IEEE Winter Conference on Applications of Computer Vision (WACV), 748–756. IEEE. doi:10.1109/WACV.2018.00087.
- Yan et al. (2017) Yan, K.; Tian, Y.; Wang, Y.; Zeng, W.; and Huang, T. 2017. Exploiting multi-grain ranking constraints for precisely searching visually-similar vehicles. In Proceedings of the IEEE International Conference on Computer Vision, 562–570.
- Yang et al. (2015) Yang, L.; Luo, P.; Change Loy, C.; and Tang, X. 2015. A large-scale car dataset for fine-grained categorization and verification. In Proceedings of the IEEE conference on computer vision and pattern recognition, 3973–3981.
- Yang et al. (2019) Yang, W.; Huang, H.; Zhang, Z.; Chen, X.; Huang, K.; and Zhang, S. 2019. Towards rich feature discovery with class activation maps augmentation for person re-identification. In Proceedings of the IEEE Conference on Computer Vision and Pattern Recognition, 1389–1398.
- Yuan, Yang, and Zhang (2017) Yuan, Y.; Yang, K.; and Zhang, C. 2017. Hard-aware deeply cascaded embedding. In Proceedings of the IEEE international conference on computer vision, 814–823.
- Zhang et al. (2019) Zhang, Z.; Lan, C.; Zeng, W.; and Chen, Z. 2019. Densely semantically aligned person re-identification. In Proceedings of the IEEE Conference on Computer Vision and Pattern Recognition, 667–676.
- Zhao et al. (2017) Zhao, H.; Tian, M.; Sun, S.; Shao, J.; Yan, J.; Yi, S.; Wang, X.; and Tang, X. 2017. Spindle Net: Person Re-Identification With Human Body Region Guided Feature Decomposition and Fusion. In IEEE Conference on Computer Vision and Pattern Recognition.
- Zhao et al. (2020) Zhao, J.; Xing, J.; Xiong, L.; Yan, S.; and Feng, J. 2020. Recognizing Profile Faces by Imagining Frontal View. International Journal of Computer Vision 128: 460–478.
- Zheng et al. (2019a) Zheng, A.; Lin, X.; Li, C.; He, R.; and Tang, J. 2019a. Attributes guided feature learning for vehicle re-identification. arXiv preprint arXiv:1905.08997 .
- Zheng et al. (2019b) Zheng, F.; Deng, C.; Sun, X.; Jiang, X.; Guo, X.; Yu, Z.; Huang, F.; and Ji, R. 2019b. Pyramidal person re-identification via multi-loss dynamic training. In Proceedings of the IEEE Conference on Computer Vision and Pattern Recognition, 8514–8522.
- Zheng et al. (2015) Zheng, L.; Shen, L.; Tian, L.; Wang, S.; Wang, J.; and Tian, Q. 2015. Scalable person re-identification: A benchmark. In Proceedings of the IEEE international conference on computer vision, 1116–1124.
- Zheng et al. (2019c) Zheng, Z.; Yang, X.; Yu, Z.; Zheng, L.; Yang, Y.; and Kautz, J. 2019c. Joint discriminative and generative learning for person re-identification. In Proceedings of the IEEE conference on computer vision and pattern recognition, 2138–2147.
- Zhong et al. (2017) Zhong, Z.; Zheng, L.; Cao, D.; and Li, S. 2017. Re-ranking person re-identification with k-reciprocal encoding. In Proceedings of the IEEE Conference on Computer Vision and Pattern Recognition, 1318–1327.
- Zhou et al. (2019) Zhou, K.; Yang, Y.; Cavallaro, A.; and Xiang, T. 2019. Omni-scale feature learning for person re-identification. In Proceedings of the IEEE International Conference on Computer Vision, 3702–3712.
- Zhou and Shao (2017) Zhou, Y.; and Shao, L. 2017. Cross-View GAN Based Vehicle Generation for Re-identification. In BMVC, volume 1, 1–12.
- Zhou and Shao (2018) Zhou, Y.; and Shao, L. 2018. Viewpoint-Aware Attentive Multi-View Inference for Vehicle Re-Identification. In IEEE Conference on Computer Vision and Pattern Recognition, 6489–6498.
- Zhu et al. (2019) Zhu, J.; Zeng, H.; Huang, J.; Liao, S.; Lei, Z.; Cai, C.; and Zheng, L. 2019. Vehicle re-identification using quadruple directional deep learning features. IEEE Transactions on Intelligent Transportation Systems 21(1): 410–420.
- Zhu et al. (2017) Zhu, J.-Y.; Park, T.; Isola, P.; and Efros, A. A. 2017. Unpaired image-to-image translation using cycle-consistent adversarial networks. In Proceedings of the IEEE international conference on computer vision, 2223–2232.
- Zhu et al. (2020a) Zhu, K.; Guo, H.; Liu, Z.; Tang, M.; and Wang, J. 2020a. Identity-Guided Human Semantic Parsing for Person Re-Identification. arXiv preprint arXiv:2007.13467 .
- Zhu et al. (2020b) Zhu, Z.; Jiang, X.; Zheng, F.; Guo, X.; Huang, F.; Sun, X.; and Zheng, W. 2020b. Aware Loss with Angular Regularization for Person Re-Identification. In AAAI, 13114–13121.