Learning User Representations with Hypercuboids for Recommender Systems
Abstract.
Modeling user interests is crucial in real-world recommender systems. In this paper, we present a new user interest representation model for personalized recommendation. Specifically, the key novelty behind our model is that it explicitly models user interests as a hypercuboid instead of a point in the space. In our approach, the recommendation score is learned by calculating a compositional distance between the user hypercuboid and the item. This helps to alleviate the potential geometric inflexibility of existing collaborative filtering approaches, enabling a greater extent of modeling capability. Furthermore, we present two variants of hypercuboids to enhance the capability in capturing the diversities of user interests. A neural architecture is also proposed to facilitate user hypercuboid learning by capturing the activity sequences (e.g., buy and rate) of users. We demonstrate the effectiveness of our proposed model via extensive experiments on both public and commercial datasets. Empirical results show that our approach achieves very promising results, outperforming existing state-of-the-art.
1. Introduction
We propose a novel recommendation approach with hypercuboids. The hypercuboid (also known as hyperrectangle) is a generalization of a three-dimensional cuboid to four or more dimensions. More specifically, we use the expressive hypercuboids to represent users in order to capture their complex and diverse interests. Recommendations are made based on the relationships between user hypercuboids and items.
This work is motivated by the recent popularity and growing importance of recommender systems in real-world applications (e.g., e-commerce and online entertainment platforms). As an effective tool to ameliorate information overload and generate income, its importance cannot been overestimated. A major step in recommender systems is finding the right items that suit users’ preferences and interests. However, obtaining informative user representations is a challenging task as users can have a wide range of interests and different tastes concerning different categories of items. The massive amount and diversity of item sets in real world applications make the case even worse.
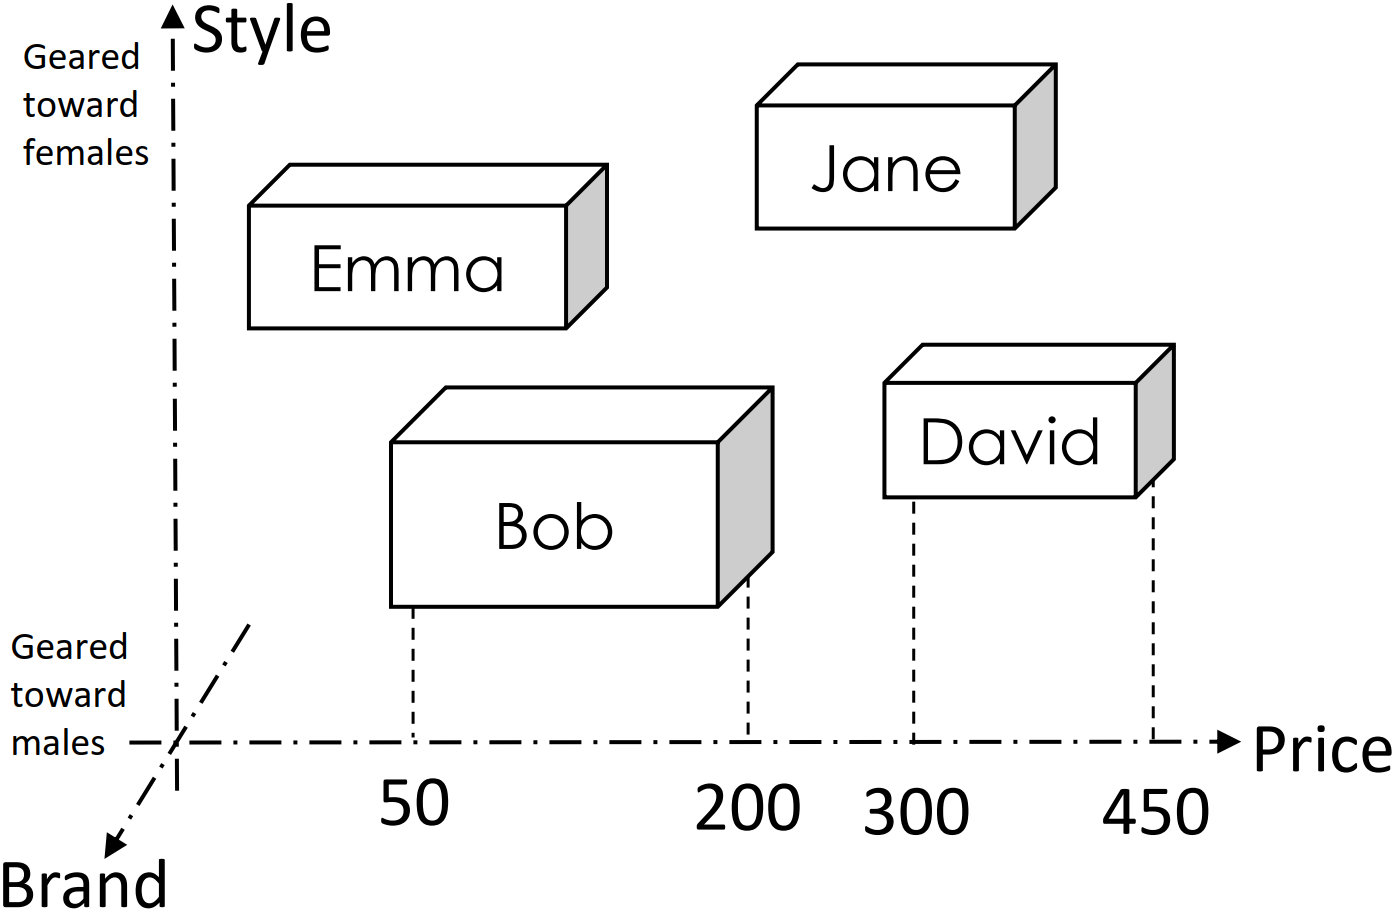
Common user modeling approaches aim to represent users as points in vector space. For example, the standard factorization model (Koren et al., 2009) factorizes the large interaction matrix into user and item latent embeddings in low-dimensional space. As a result, recommendation is reduced to identifying items which are near or similar to the user in that space. Despite its popularity and wide applications, this paradigm faces weaknesses. On one hand, embedding the disparate and diverse interests into single points is problematic (Weston et al., 2013). Intuitively, users are likely to have different tastes and considerations for items from different categories or domains. On the other hand, for most factors, users have preferred ranges spread. For example, consumers usually have their acceptable price range. It is inexpressive to model such range with a single value. Clearly, such systems are geometrically restrictive.
Thus, we need a much richer latent representation system to overcome these limitations. To this end, we propose a new paradigm that represents users as hypercuboids. We go beyond point embeddings, adopting the more expressive hypercuboids to effectively capture the intricate and complex interests of users. A hypercuboid is a subspace that encapsulates innumerable points, enabling more representation capacities than a single point. Moreover, the preference range of each factor (e.g., accepted price) can be naturally modelled with the edge of hypercuboids.
Overall, the basic idea is that: for each user, we learn single or multiple hypercuboids to represent the user’s interests. The relationship between the user hypercuboids and item points is captured by a re-designed distance measure, where both distances outside and inside the hypercuboid are considered. Ideally, the user hypercuboid will allow for a greater degree of flexibility and expressiveness.
The main contributions of this work are as follows:
-
•
We present a novel user representation method for personalized recommendation. For the first time, we adopt hypercuboids to represent users’ complicated user preferences or interests. Two variants are proposed to further enhance the representation capacity in capturing the diversity of user interests.
-
•
We design a distance function to measure the distance between items and user hypercuboids. This measure provides improvements in terms of flexibility and model expressiveness of the algorithms.
-
•
We conduct experiments on six datasets. Our model achieves the best performances on all the benchmark datasets. We investigate the inner workings of our model to gain a better intuition pertaining to the model’s high performance. We also provide case study on real-world datasets to show the effectiveness of the proposed approach.
2. The Proposed Method
In this section, we formulate the hypercuboid representation for user interest modeling, introduce two variants of hypercuboid, and present the overall architecture for hypercuboid learning.
Our work is concerned with the recommendation task with implicit feedback. In a standard setting, we suppose that there are a set of users, and a set of items, . The goal is to generate a set of recommendable items for a user given existing feedback, typically, implicit feedback such as clicks, buys, likes. We set the interaction between user and item , to if the implicit feedback exists, otherwise, , where is an entry of the interaction matrix . In addition, time steps will also be considered in the following subsections.
2.1. Representing Users as Hypercuboids
Hypercuboid is an analogue of a cuboid in four or more dimensions. For the convenience of computation, we define a hypercuboid with a center and an offset, both with the same dimensions. Formally, we operate on . Let represent the center of a hypercuboid and denote the non-negative offset. The offset is used to determine the lengths of the edges of the hypercuboid. A hypercuboid is defined as:
| (1) |
where denotes the point which is inside the hypercuboid.
In our framework, every user is modeled with such a hypercuboid. We use bold uppercase letters and to denote the centers and offsets respectively for all the users. As such, a user is represented by a hypercuboid . Items are points and are embedded by . Obviously, an item point can be outside, inside, or on the surface of the user hypercuboid. A proper method is needed to measure the relationships between users and items. Meanwhile, the characteristics of hypercuboid should be retained.
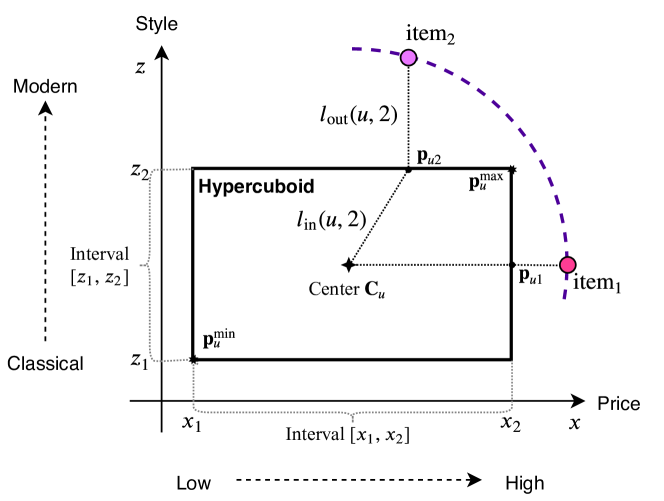
To achieve this, a composition points-to-hypercuboid distance is adopted. It consists of an outside distance and an inside distance. Firstly, we find the nearest point on the surface of the hypercuboid to the item, which is performed with the following expression:
| (2) |
where and denote the upper-right corner and lower-left corner of the user hypercuboid (shown in Figure 2). Their formal definitions are:
It is clear that is relevant to both the user hypercuboid and the item embedding. The movement of either will result in transformation of this point.
Then, the outside distance is the distance between and , and the inside distance indicates the distance between and the center of the hypercuboid. So we have:
where euclidean distance is used. Then, we compose these two distances as follows to measure the user-item relationships.
| (3) |
where the coefficient is employed to control the contribution of the inside distance. Theoretically, if we set , we presume that the user is interested in an item regardless of its exact coordinate as long as this item is located in the user hypercuboid. This might alleviate the congestive problem of common approaches which map users and her interacted items onto the same points (Tay et al., 2018).
This paradigm may suggest two benefits. On one hand, a user hypercuboid can be regarded as a set that contains countless item points, which means that it could enwrap as many items as the user likes without much loss of information, enabling higher capacities. On the other hand, the composition distance in (3) could overcome an obvious impediment of the direct distance adopted in the existing body of literature. To explain the latter, suppose that we have two items located at the circumference of the circle with center . With commonly used euclidean distance, the system will conclude that this user likes both items equally. However, consider the case in Figure 2. As we can see, this might not be true when the edges of the hypercuboid is taken into account: it is clear that the distances to the hypercuboid of and are not equal. This is provable with the cosine theorem, or by directly setting the hyper-parameter to . In this example, we can clearly conclude that so this user is more interested in the . One might think of the offset as a range for user preference in each dimension. If the -axis indicates prices and the -axis represents styles, it is evident that this user has less tolerance in style than that in the price factor. As such, even though has a more acceptable price than for this user, she still likes more because the does not suit her taste in style at all.
To ensure the items in a hypercuboid to be higher ranked than items outside the hypercuboid, we can add an additional distance to ,
| (4) |
where is set to a value greater than and is the sigmoid function. This distance equals to zero when item is in the hypercuboid. Otherwise, it is approximately greater than the half of the maximum diagonal length of the hypercuboid.
2.2. Variants of Hypercuboids
To further enhance the capability, we devise the following two variants of hypercuboid. The rational is to generate multiple hypercuboids, with each one providing a different view for user interests. This could improve the capability in capturing the diversities of user interests. Figure 3 illustrates these two variants.
2.2.1. Concentric Hypercuboids
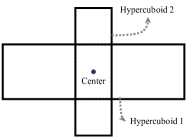
(a) Concentric Hypercuboids
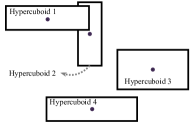
(b) Multiple Independent Hypercuboids
One solution is to use multiple concentric hypercuboids to represent each user. In this case, we add several offset embeddings and keep the center unchanged. With concentric hypercuboid we can not only extend the regular hypercuboid into irregular space, but also mitigate the above problem. Suppose we have offsets, there are two distances for each hypercuboid. We integrate them into the following final distance:
| (5) |
All the outside distances are summed up while only the minimum inside distance is kept. The motivation is to weaken the effects of the inside distances.
2.2.2. Multiple Independent Hypercuboids
To further enhance the capability in modeling diverse interests, we can also use multiple hypercuboids with different centers and offsets. The final distance function is defined as:
| (6) |
As for the addition distance, we can take the maximum additional distance from all hypercuboids.
2.3. Learning the Centers and Offsets
An important step is to learn the center and offset of the user hypercuboid. Generally, user interests can be derived from users’ historical behaviors, e.g., buy, watch, and click. So it is natural to learn the centers and offsets from the past interaction log. In most practical applications, user actions are often ordered and timestamped, which also records users’ interests evolution. Formally, we make use of the last actions of users, and aim to predict the next recommendable item(s). At the embedding layer, we get an embedding matrix , to represent these items at time-step , by looking up the item embedding matrix with the index of the items.
To capture the shifts of user interests, we employ a stacked neural network consisting of a bidirectional LSTM (Schuster and Paliwal, 1997) and a self-attention module over the sequential actions.
| (7) |
The bidirectional LSTM is used to enhance the sequence representation capability. Then, a self-attention network is applied.
| (8) |
where is transformed representation for the current sequence; is nonlinear layer. It is then passed into a pooling layer to get a dimensional vector.
| (9) |
where the pooling function can be average-pooling, max-pooling, min-pooling, or sum-pooling. We can use to represent the center, the offset, or both.
In addition, we notice that the offset of hypercuboid usually needs to memorize mass amount of information. For example, to get the price interval, we need to store the prices of all items the user bought to accurately infer her acceptable price range. To this end, we adopt a key-value memory network to perform the memorization process. Let denote the memory and denote the key matrix, where controls the capacity of the memory.
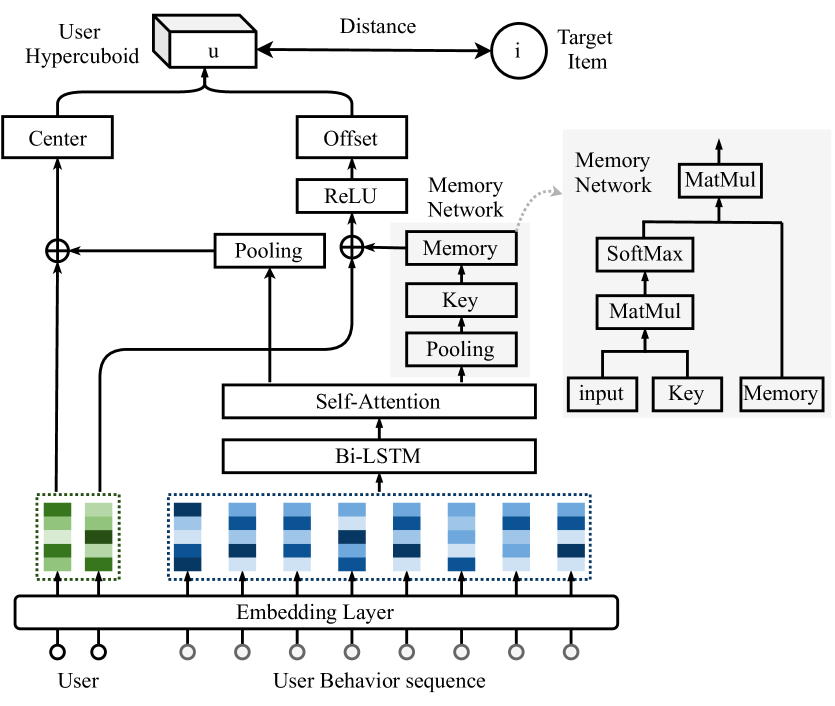
The input of this memory module is , which is used to retrieve the key from the key matrix.
| (10) |
With this attentive key vector , we select relevant pieces of information from the memory.
| (11) |
We wrap all the offsets with the function (Goodfellow et al., 2016) to ensure all the values are non-negative. Figure 4 illustrates the overall architecture of the proposed model.
For multiple hypercuboids, we can add dense layers over the center/offset and get multiple centers and offsets.
2.4. Optimization
In this section, we introduce the objective function and training scheme. We adopt the pairwise ranking loss for the optimizing objective, which is defined as.
| (12) |
where and are the positive user-item pairs and negative user-item pairs respectively, is the margin that separates the two items. For regularization, standard normalization and dropout (Srivastava et al., 2014) are viable.
We use the same negative sampling strategy as that of HGN (Ma et al., 2019). Our model is end-to-end differentiable and an adaptive gradient descent optimizer is used. It is noteworthy that other losses such as Bayesian personalized ranking loss or cross entropy loss are also applicable.
3. Experiments
In this section, we present our experimental setup and empirical evaluation to verify the effectiveness of our method.
| Datasets | Interactions | # Users | # Item | % Density | ||
| Books | 1,856,747 | 52,406 | 41,264 | 0.086 | ||
| CDs | 475,265 | 17,052 | 35,118 | 0.079 | ||
| Movie & Tvs | 694,970 | 23,337 | 33,582 | 0.089 | ||
| E-commerce | 5,560,954 | 104,929 | 69,563 | 0.076 | ||
|
28,926,924 | 145,057 | 92,364 | 0.216 | ||
|
8,558,837 | 131,692 | 109,670 | 0.059 |
3.1. Datasets
We conduct our empirical evaluation based on four public well-studied benchmark datasets and two commercial datasets. The statistics of the datasets are reported in Table 1.
3.1.1. Public Datasets
Four public datasets from different domains are used, including Amazon-Books, Amazon-Movies&TVs, Amazon-CDs (He and McAuley, 2016; Ma et al., 2019; McAuley et al., 2015) and an E-commerce dataset (Lv et al., 2019). The feedback in the Amazon datasets is ratings from 1 to 5, we treated those with no less than 4 as positive feedback. For the E-commerce dataset, we use the version provided by Lv et al. (Lv et al., 2019) which consists of user-item interaction logs of four weeks. To filter noisy data, we discard users with fewer than ten actions and items with fewer than 5 associated actions for each dataset (Ma et al., 2019).
3.1.2. Commercial Datasets
This dataset is from an online retailer platform, Alibaba. It is collected from the interaction logs generated in seven days. We sampled two versions for two groups of users. The first version consists of users with 100 to 500 interactions and the second version consists of users with 50 to 100 interactions.
We target at the next item prediction task where the aim is to predict a user’s next interaction. As such, each dataset is split into three subsets based on the chronological order of interactions, with of the user sequence as the training set, the next as the validation set and the latest as the test set. Same as (Ma et al., 2019), the validation set is used during the inference stage.
3.2. Evaluation Measures
Three commonplace evaluation measures (Shani and Gunawardana, 2011) including Recall@k, Normalized Discounted Cumulative Gain (NDCG@k), and Mean Average Precision (MAP@k) are adopted. For each user, we rank all the items (exclude items the user has rated) and select the highest ranked k items for recommendation. Recall at indicates the proportion of relevant items found in the top- recommendations. NDCG at is a measure of ranking quality and the position of correctly recommended item is taken into account. MAP at is the mean of the average precision scores of all users and is a precision measure that gives larger credit to correctly recommended items. Definitions are omitted for brevity.
3.3. Compared Methods
We compare our method with two groups of well-established and competitive baselines. The first group contains two non-neural recommendation methods.
-
•
Matrix Factorization with Bayesian Personalized Ranking (BPRMF) (Rendle et al., 2009) is a classical method with pairwise Bayesian ranking loss. It models user-item interactions with matrix factorization.
- •
Five neural networks based recommendation models are included in the second group.
-
•
YouTubeDNN (Covington et al., 2016) is a deep neural networks based recommendation model proposed by YouTube 111https://www.youtube.com/. User vectors, vectors of the latest interacted items and the target item are concatenated and are fed into multiple dense layers.
-
•
Gated Recurrent Unit for Recommendation (GRU4Rec) (Hidasi et al., 2015) is a recurrent neural network based model for session-based recommendation (a user is a session).
-
•
Convolutional Sequence Embedding Recommendation Model (Caser) (Tang and Wang, 2018) is a convolutional neural networks based sequence-aware recommendation model. The proposed framework captures the sequential patterns at both point-level and union-level.
- •
-
•
Hierarchical Gating Networks (HGN) (Ma et al., 2019) is a state of the art sequential recommendation model which is based on a novel gating mechanism and includes item-item relations.
3.4. Implementation Details
We implemented our model and baselines with tensorflow 222https://www.tensorflow.org/. For all models, the embedding size is set to for fair comparison, the sequence length and the target length are set to 5 and 3, respectively. Adagrad optimizer (Duchi et al., 2011) is used for model parameters updates and the learning rate is set to . The regularization rate is tuned amongst . The margin of hinge loss is set to . The coefficient is selected from . Learnable parameters are initialized with a normal distribution and trained from scratch. The batch size is set to . The memory capacity is determined from . For all pooling operations in the model, average pooling is used by default. All the hyper-parameters are tuned with the validation set. Experiments are executed for five times and the average performances are reported.
| Datasets | Measure | k | BPRMF | TransRec | YouTubeDNN | GRU4Rec | Caser | SASRec | HGN | Ours |
| Alibaba Dataset V1 | Recall | 10 | 0.0156 | 0.0192 | 0.0251 | 0.0196 | 0.0227 | 0.0233 | 0.0271 | 0.0299 |
| 50 | 0.0459 | 0.0608 | 0.0776 | 0.0631 | 0.0683 | 0.0692 | 0.0774 | 0.0885 | ||
| MAP | 10 | 0.0284 | 0.03.0 | 0.0487 | 0.0367 | 0.0451 | 0.0466 | 0.0558 | 0.0610 | |
| 50 | 0.0108 | 0.0151 | 0.0211 | 0.0163 | 0.0192 | 0.0192 | 0.0232 | 0.0231 | ||
| NDCG | 10 | 0.0665 | 0.0789 | 0.1041 | 0.0808 | 0.0952 | 0.0989 | 0.1141 | 0.1255 | |
| 50 | 0.0427 | 0.0543 | 0.0702 | 0.0562 | 0.0627 | 0.0641 | 0.0724 | 0.0814 | ||
| Alibaba Dataset V2 | Recall | 10 | 0.0370 | 0.0465 | 0.0622 | 0.0344 | 0.0639 | 0.0619 | 0.0649 | 0.0667 |
| 50 | 0.0997 | 0.0128 | 0.1655 | 0.1069 | 0.1664 | 0.1568 | 0.1626 | 0.1764 | ||
| MAP | 10 | 0.0223 | 0.0273 | 0.0396 | 0.0186 | 0.0415 | 0.0413 | 0.0425 | 0.0431 | |
| 50 | 0.0233 | 0.0303 | 0.0441 | 0.0218 | 0.0451 | 0.0441 | 0.0454 | 0.0470 | ||
| NDCG | 10 | 0.0536 | 0.0648 | 0.0881 | 0.0470 | 0.0913 | 0.0897 | 0.0930 | 0.0947 | |
| 50 | 0.0323 | 0.0405 | 0.0537 | 0.0320 | 0.0543 | 0.0521 | 0.0540 | 0.0569 |
3.5. Experimental Results
Table 2 and Figure 5 present the recommendation performance of all baselines and our model with a single hypercuboid on the six datasets. The best performer on each row is highlighted in boldface. We observe that our model achieves the best performance across all datasets, outperforming a myriad of complex architectures. Our model consistently performs better than HGN, SASRec, Caser, and TransRec, which are all recent competitive sequence-aware recommendation methods. Notably, we obtain a clear performance gain over the second best baseline. Furthermore, our method performs much better than the inner product model (BPRMF) and the Euclidean distance based model (TransRec), which ascertains the effectiveness of the proposed distance function.
Among all the neural networks based baselines, HGN outperforms self-attention, RNN, and CNN based approaches. The second best neural networks based model often switches between YouTubeDNN and SASRec. We also note that non-neural models such as BPRMF and TransRec achieve very competitive performance on the three Amazon datasets and the E-commerce dataset.
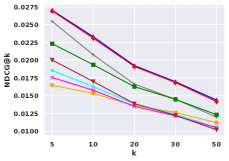
Performance of top 5, 10, 20, 30, 50 on four public datasets are presented in Figure 5. Our model consistently outperforms all the other models, indicating that our model can generate not only more accurate topmost recommendations but also higher quality recommendation lists on the whole.
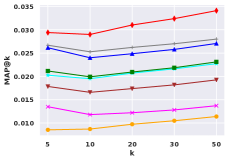
MAP@k on Books
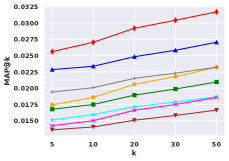
MAP@k on CDs
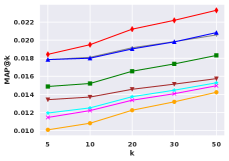
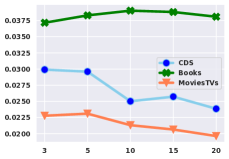
MAP@k on Movies&TVs
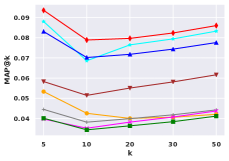
MAP@k on E-commerce
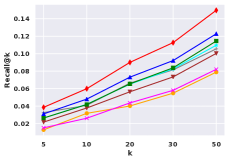
Recall@k on Books
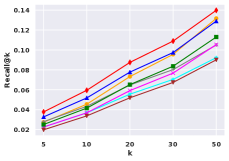
Recall@k on CDs
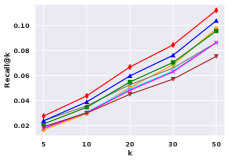
Recall@k on Movies&TVs
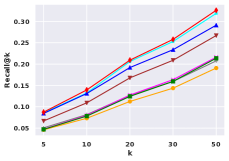
Recall@k on E-commerce
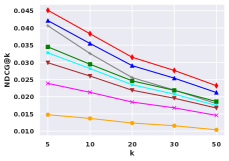
NDCG@k on Books
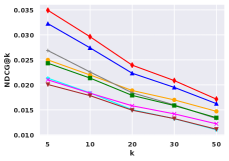
NDCG@k on CDs
NDCG@k on Movies&TVs
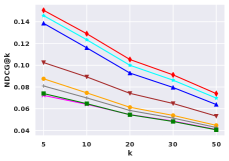
NDCG@k on E-commerce
![[Uncaptioned image]](/html/2011.05742/assets/newpic/legend.png)
3.6. Adding More Hypercuboids
We conduct experiments to verify the effectiveness of the proposed hypercuboid variants. Table 3 shows the performance with varying number of hypercuboids. Notably, adding more hypercuboid can further enhance the model performance, hitting a new state-of-the-art, which reaffirms the importance of modeling the diversity of user interests. Generally, multiple independent hypercuboids usually marginally outperforms multiple concentric hypercuboids. Using four to six hypercuboids can usually lead to a satisfying improvement. We also tried eight and ten hypercuboids but performance degradation is observed. Note that these two variants will not incur large increases in the number of parameters as increasing the embedding size. We can choose the number of hypercuboids base on the degree of diversity of users’ interests in general.
| Number of Hypercuboids | Concentric Hypercuboids | Independent Hypercuboid | |||||
|---|---|---|---|---|---|---|---|
| Recall@10 | NDCG@10 | MAP@10 | Recall@10 | NDCG@10 | MAP@10 | ||
| E-commerce | 2 | 0.1396 | 0.1300 | 0.0802 | 0.1476 | 0.1336 | 0.0830 |
| 3 | 0.1512 | 0.1402 | 0.0876 | 0.1501 | 0.1356 | 0.0846 | |
| 4 | 0.1529 | 0.1415 | 0.0885 | 0.1525 | 0.1374 | 0.0859 | |
| 5 | 0.1508 | 0.1392 | 0.0868 | 0.1529 | 0.1381 | 0.0866 | |
| 6 | 0.1436 | 0.1334 | 0.0827 | 0.1530 | 0.1381 | 0.0866 | |
| Alibaba Dataset V2 | 2 | 0.0722 | 0.1032 | 0.0480 | 0.0766 | 0.1119 | 0.0534 |
| 3 | 0.0746 | 0.1072 | 0.0504 | 0.0774 | 0.1130 | 0.0540 | |
| 4 | 0.0760 | 0.1095 | 0.0519 | 0.0779 | 0.1136 | 0.0544 | |
| 5 | 0.0676 | 0.0966 | 0.0453 | 0.0781 | 0.1138 | 0.0546 | |
| 6 | 0.0763 | 0.1100 | 0.0522 | 0.0785 | 0.1148 | 0.0552 | |
| Measure@10 | Remove NNs | |||
|---|---|---|---|---|
| Books | Recall | 0.0558 | -6.84% | +16.25% |
| NDCG | 0.0360 | -6.01% | +1.41% | |
| MAP | 0.0264 | -8.97% | +10.00% | |
| E-commerce | Recall | 0.1384 | -0.75% | +4.86% |
| NDCG | 0.1277 | -1.00% | +10.10% | |
| MAP | 0.0782 | -0.84% | +11.48% | |
| Alibaba Dataset V1 | Recall | 0.0281 | -6.02% | +3.54% |
| NDCG | 0.1174 | -6.45% | +2.94% | |
| MAP | 0.0563 | -7.70% | +0.90% | |
| Alibaba Dataset V2 | Recall | 0.0644 | -3.45% | -0.77% |
| NDCG | 0.0909 | -4.01% | -2.26% | |
| MAP | 0.0414 | -3.94% | -2.59% |
3.7. Using Hypercuboids Only
We study the impacts of the neural architecture on the model performance. To this end, we report the performance by replacing all the neural architectures with a simple average pooling over the sequences in Table 4, Firstly, we observe that removing the neural architectures will decrease the performance, especially on the Amazon Books dataset and company dataset V1/V2, which confirms the importance of the neural architectures. Next, we note that, even without the neural architectures, the pure hypercuboid architecture still get higher performance than the second best baselines (on Books, E-commerce, and Company Dataset V1), which signifies that the hypercuboid is essential for the improvement.
3.8. Sensitivity of Hyper-parameters
We conduct hyper-parameters analysis on three public datasets.
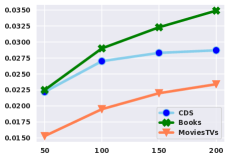
3.8.1. Embedding Size
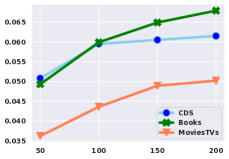
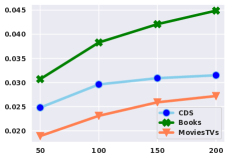
Here, we analyze the impact of the embedding size in Figure 6 (a), (b), and (c). It is clear that increasing the embedding size improves the performance. Unlike models such as Caser, SASRec, and HGN (checking the embedding size analysis in the corresponding papers.), our model is less likely to be over-fitting with larger dimension size. It suggests that setting a dimension size no less than 100 to be a reasonable choice for our model.
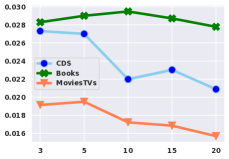
3.8.2. Sequence length
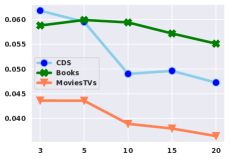
By varying the sequence length , we get Figure 6 (1), (2), and (3). We observe that the model gets better performance with shorter sequence length on CDs and Movies&TVs, while it is more stable on the Books datasets. Overall, it is more preferable to set to a value around 5 as longer sequence might introduce too many irrelevant activities in the sequences.
3.8.3. Pooling Function
Table 5 shows the results with different pooling functions. We find that all the three choices (sum, min, and max pooling) lead to deprovements over the mean pooling on the three datasets. In addition, there is no clear winner between the three pooling functions.
(a) Recall@10 with varying
(1) Recall@10 with varying
(b) NDCG@10 with varying
(2) NDCG@10 with varying
(c) MAP@10 with varying
(3) MAP@10 with varying
| Measure@10 | Sum | Min | Max | |
| CDs | Recall | 0.0542 | 0.0529 | 0.0528 |
| NDCG | 0.0282 | 0.0268 | 0.0267 | |
| MAP | 0.0251 | 0.0241 | 0.0235 | |
| Books | Recall | 0.0546 | 0.0574 | 0.0570 |
| NDCG | 0.0382 | 0.0370 | 0.0370 | |
| MAP | 0.0272 | 0.0275 | 0.0274 | |
| MovisTVs | Recall | 0.0369 | 0.0377 | 0.0370 |
| NDCG | 0.0212 | 0.0209 | 0.0205 | |
| MAP | 0.0166 | 0.0165 | 0.0162 |
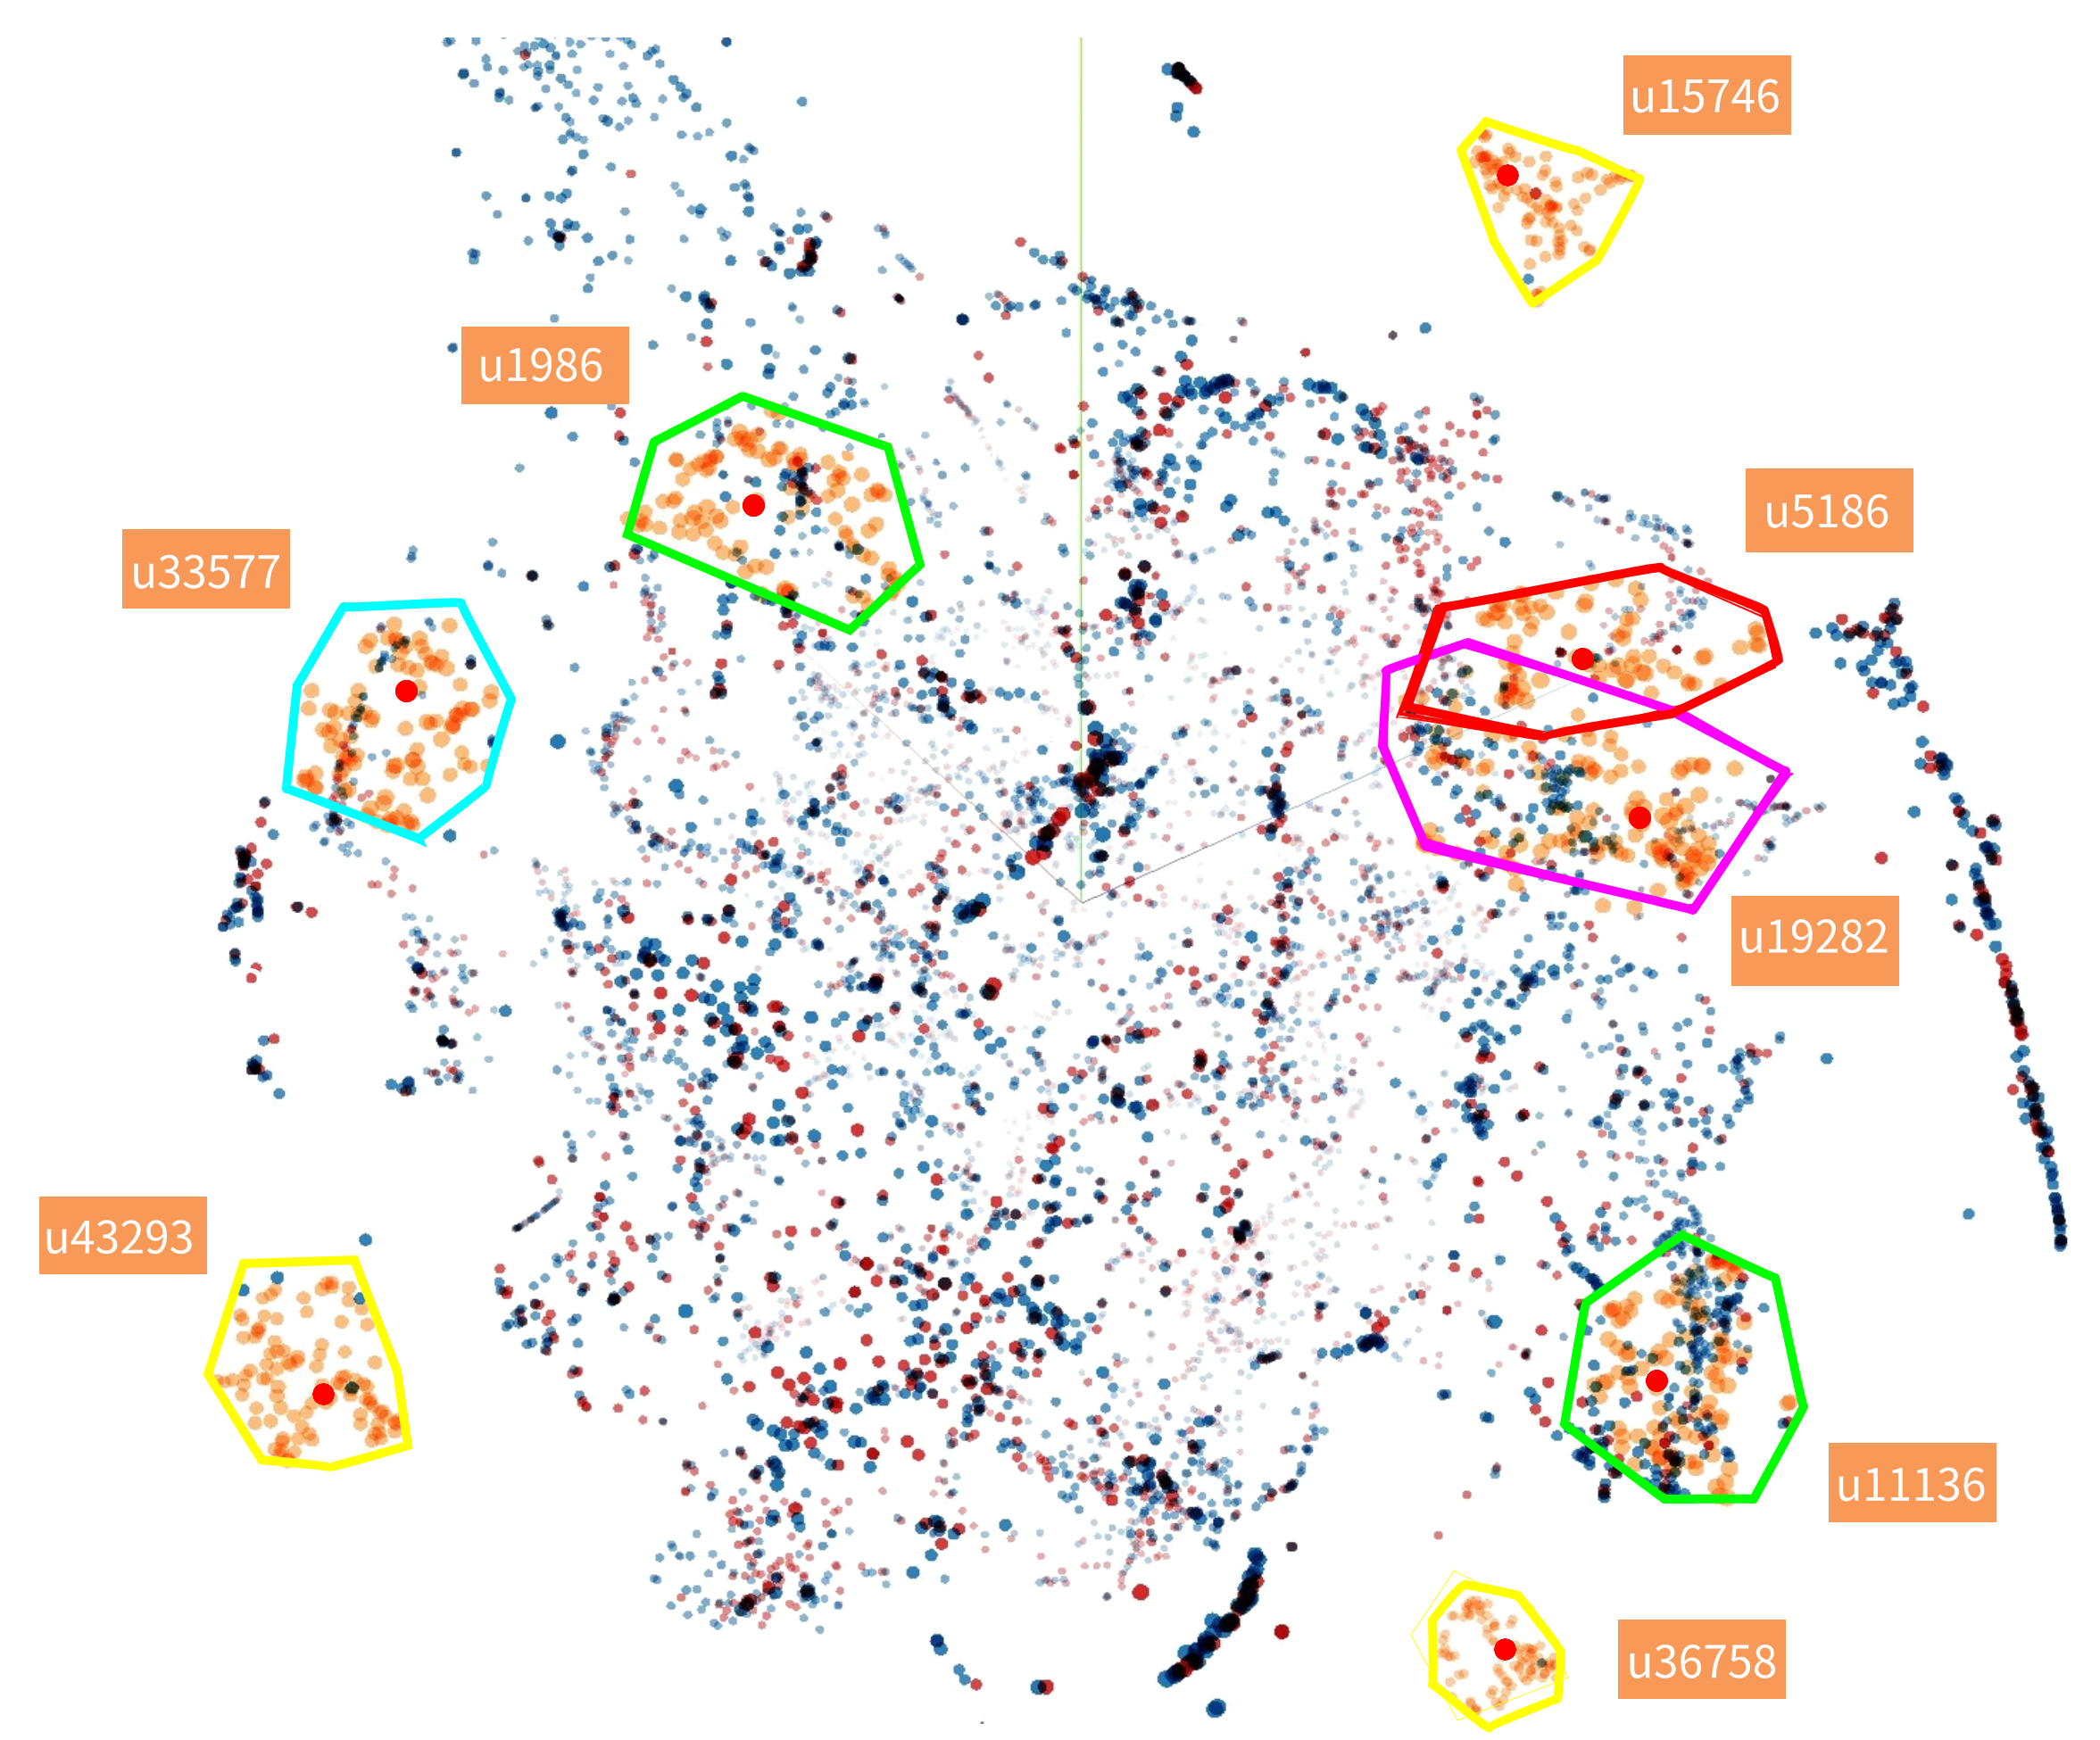
3.9. Visualization of User Hypercuboids and Item Embeddings
In order to check what the proposed model is learning, we visualize the user hypercuboids on the Amazon books dataset. We project 3,000 items and 3,000 user centers into a 3-dimensional space with T-SNE (Maaten and Hinton, 2008) (Perplexity 9, learning rate 10). Then, we randomly choose eight users and, for each of the eight users, we sample 100 points in the hypercuboid uniformly and project them into the same space. Figure 7 shows the learned hypercuboids. Clearly, our model successfully learned a hypercuboid with different sizes and positions for each user. Items may be located inside or outside the user hypercuboid. Items which are inside the user hypercuboid are more likely to be recommended to this user. Intersections between users’ hypercuboids can also be observed.
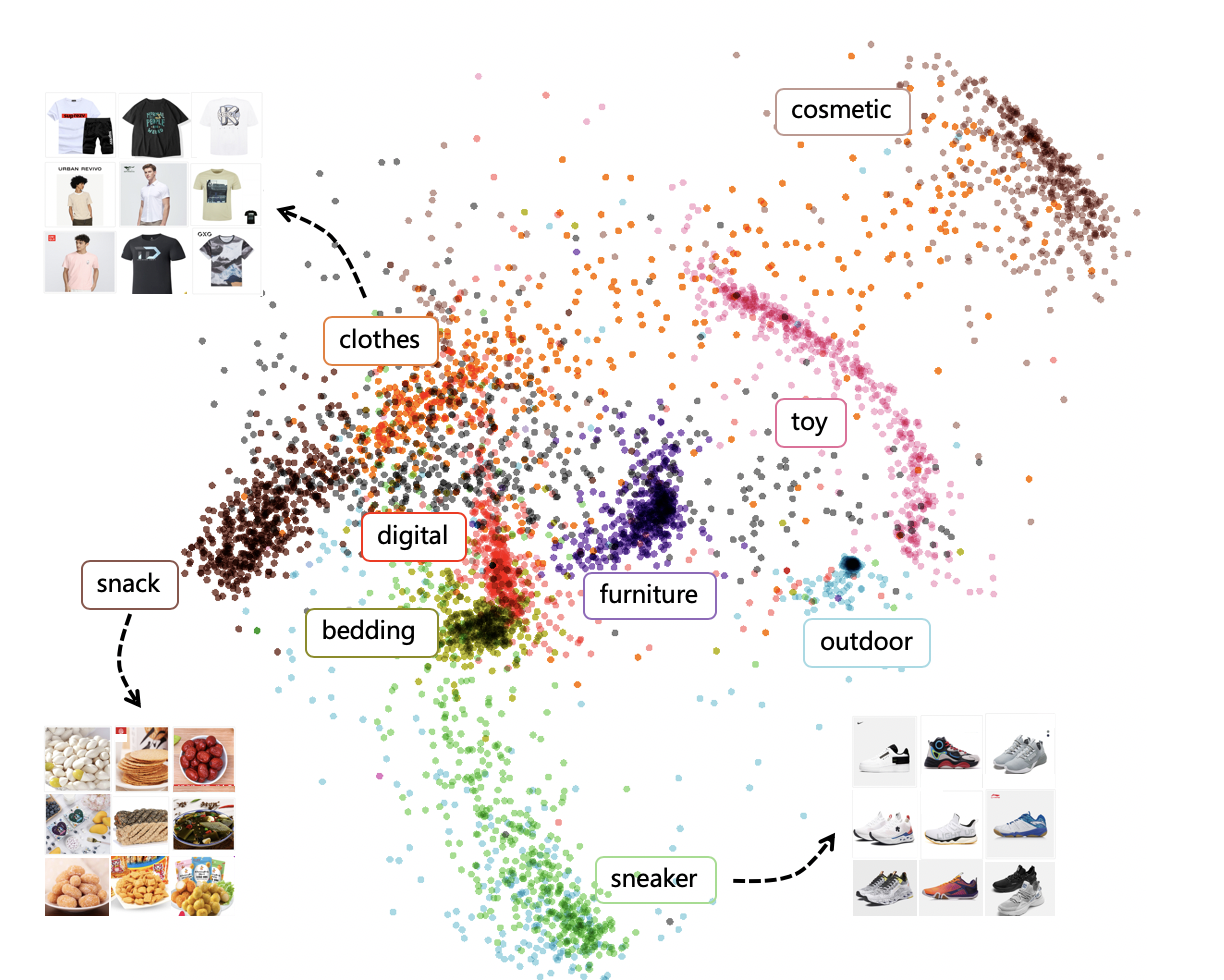
Moreover, our model can also learn effective item representations. To demonstrate this, we project the item embeddings we learned from for the company dataset (V1) into 2-D space. As shown in Figure 8, we observe that items from different categories (e.g., snack, clothes, toy, furniture, etc. ) are roughly separated. Related categories tend to be closer to each other (e.g., bedding and furniture).
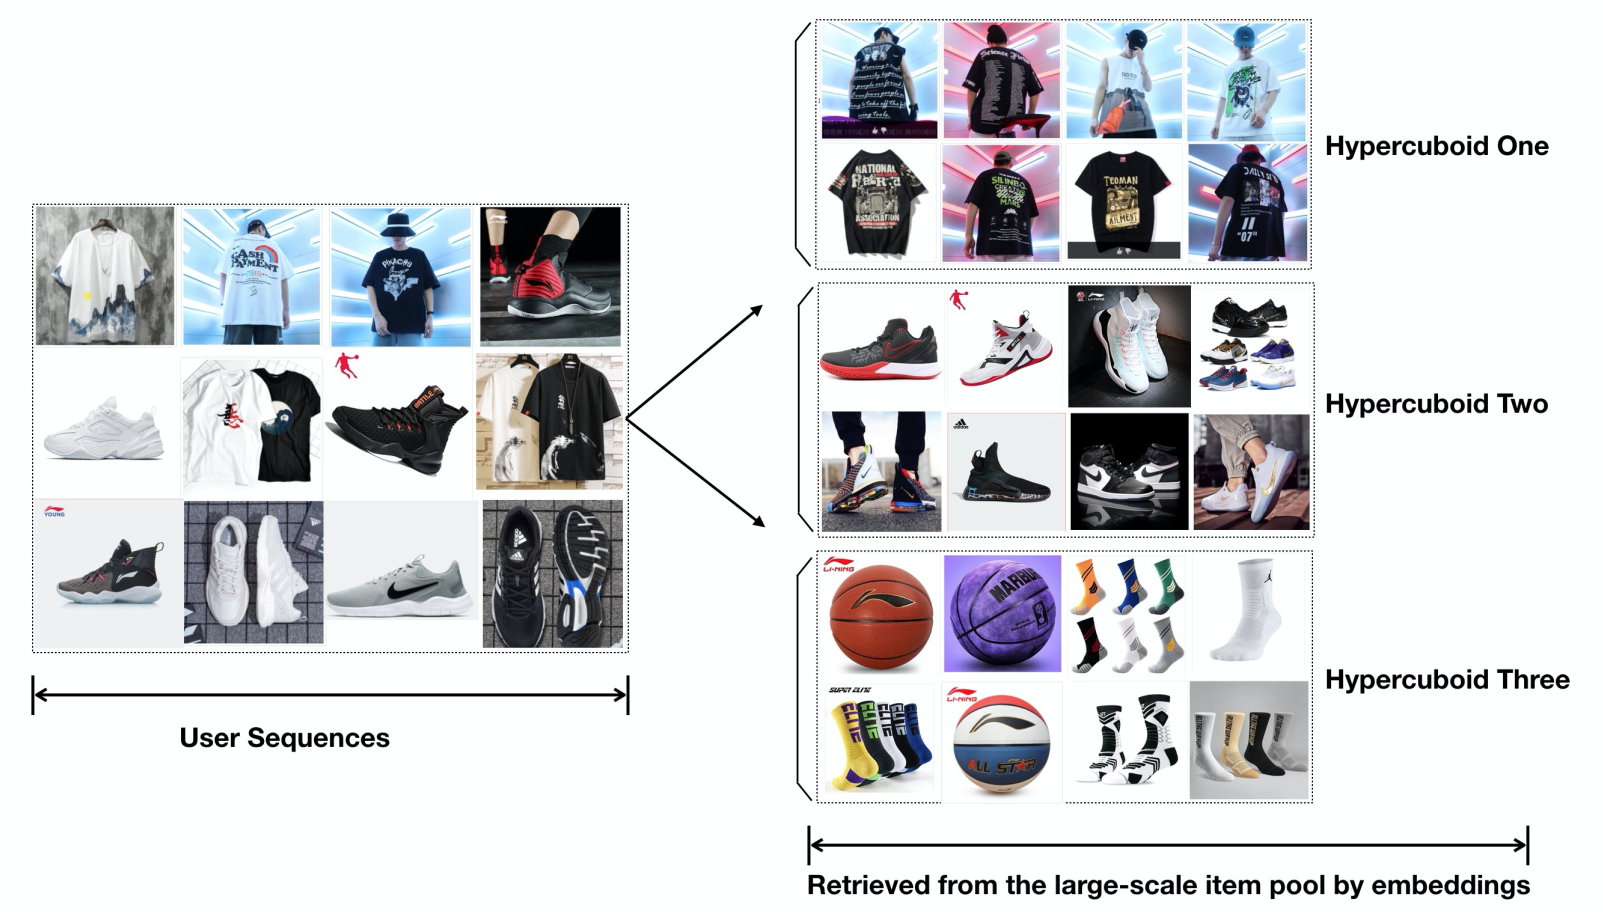
3.10. Case Study with Multiple Hypercuboids
To demonstrate the efficacy of using multiple hypercuboids, we show the recommendations list for a randomly selected user in Figure 9. In this case, we learn three independent hypercuboids for this user. Several observations can be made: (1). The recalled items are strongly correlated with the corresponding user sequence; (2) Different hypercuboid can capture different aspect of the interests in the historical sequences, i.e, hypercuboid one recalls T-shirts, hypercuboid two recalls sport footwear; (3). A single hypercuboid can also recall a diverse set of items from closely related categories. For example, hypercuboid three recalls both socks and basketballs. Clearly, our model is suitable for capturing user’s diverse interests.
4. Related Work
Recommender systems have been widely studied in the literature (Ricci et al., 2011; Koren, 2008; Koren et al., 2009; Adomavicius and Tuzhilin, 2005; Wang et al., 2015; Shi et al., 2014; Su and Khoshgoftaar, 2009). Conventional recommendation methods usually represent users and items as points/vectors in a latent space. The interactions are modelled with vectors similarity (Koren et al., 2009; Hu et al., 2008; Zhang et al., 2019c) or points closeness (Hsieh et al., 2017; Vinh Tran et al., 2020). In the recent years, we can easily observe the increasing numbers of neural network models for recommendation (Zhang et al., 2019b, a). A number of works (He et al., 2017c; Covington et al., 2016; Wu et al., 2016; Xue et al., 2017) proposed to model the interactions with multilayered perceptrons. There is also an emerging line of works focusing on capturing the sequence patterns in user activities to enrich user representations (Tan et al., 2016; Feng et al., 2015; Quadrana et al., 2018). Hidasi et al. (Hidasi et al., 2015, 2016) proposed a recurrent neural network based model for session-based recommendation. Convolutional neural networks based sequence modeling approaches show promising results on sequential recommendation (Tang and Wang, 2018; Yuan et al., 2019). Self-attention mechanism (Kang and McAuley, 2018; Zhou et al., 2018; Huang et al., 2018) can also utilized to enhance the performance by emphasizing important activities in user behaviors. The recent model, hierarchical gating networks (Ma et al., 2019), moving beyond RNN, CNN, and self-attention, is a gating network that consists of a feature gating module, an instance gating module and an item-item product module. Different from previous works, our model takes the advantages of hypercuboid representations to overcome the limitations of traditional user representation methods. A customized sequence modeling block is also designed to boost the effectiveness of the hypercuboid by incorporating information from user sequential behaviors.
Hypercuboid is an extension of cuboid in higher dimensions. It has attracted attention in the field of machine learning recently (Wei et al., 2010; Maji, 2012; Ren* et al., 2020; Zhang and Parker, 2011). Maji et al. (Maji, 2012) proposed a rough hypercuboid method for relevant and significant features selection. Vilnis et al. (Vilnis et al., 2018) proposed a probabilistic embedding method with hypercuboid lattice Measures for knowledge graphs. In the followed-up work, Li et al. (Li et al., 2018) improved this model to enhance the robustness in the disjoint case while keeping the desirable properties. Ren et al. (Ren* et al., 2020) proposed a hypercuboid representation approaches for reasoning over knowledge graphs. Our work is also related to Venn Diagrams (Venn, 1880) in the sense that we can treat users as a set of entities they preferred.
5. Conclusion
In this paper, we propose a novel recommendation method with hypercuboids. In our model, users are represented as hypercuboids and the relationship between users and items are modeled with the distance between points and hypercuboids. It demonstrates the state-of-the-art performance on four publicly available and two commercial datasets for personalized recommendation. To capture the diversity of user interests, we proposed two variants of hypercuboids which could further improve recalling performance. We also studied the impacts of effects of hyperparameters and provided case analysis on real-world dataset.
References
- (1)
- Adomavicius and Tuzhilin (2005) Gediminas Adomavicius and Alexander Tuzhilin. 2005. Toward the next generation of recommender systems: A survey of the state-of-the-art and possible extensions. IEEE transactions on knowledge and data engineering 17, 6 (2005), 734–749.
- Covington et al. (2016) Paul Covington, Jay Adams, and Emre Sargin. 2016. Deep neural networks for youtube recommendations. In Proceedings of the 10th ACM conference on recommender systems. 191–198.
- Duchi et al. (2011) John Duchi, Elad Hazan, and Yoram Singer. 2011. Adaptive subgradient methods for online learning and stochastic optimization. Journal of machine learning research 12, Jul (2011), 2121–2159.
- Feng et al. (2015) Shanshan Feng, Xutao Li, Yifeng Zeng, Gao Cong, Yeow Meng Chee, and Quan Yuan. 2015. Personalized ranking metric embedding for next new poi recommendation. In Twenty-Fourth International Joint Conference on Artificial Intelligence.
- Goodfellow et al. (2016) Ian Goodfellow, Yoshua Bengio, and Aaron Courville. 2016. Deep learning. MIT press.
- He et al. (2017a) Ruining He, Wang-Cheng Kang, and Julian McAuley. 2017a. Translation-based recommendation. In Proceedings of the Eleventh ACM Conference on Recommender Systems. 161–169.
- He et al. (2017b) Ruining He, Wang-Cheng Kang, and Julian McAuley. 2017b. Translation-Based Recommendation. In Proceedings of the Eleventh ACM Conference on Recommender Systems (Como, Italy) (RecSys ’17). Association for Computing Machinery, New York, NY, USA, 161–169. https://doi.org/10.1145/3109859.3109882
- He and McAuley (2016) Ruining He and Julian McAuley. 2016. Ups and downs: Modeling the visual evolution of fashion trends with one-class collaborative filtering. In proceedings of the 25th international conference on world wide web. 507–517.
- He et al. (2017c) Xiangnan He, Lizi Liao, Hanwang Zhang, Liqiang Nie, Xia Hu, and Tat-Seng Chua. 2017c. Neural collaborative filtering. In Proceedings of the 26th international conference on world wide web. 173–182.
- Hidasi et al. (2015) Balázs Hidasi, Alexandros Karatzoglou, Linas Baltrunas, and Domonkos Tikk. 2015. Session-based recommendations with recurrent neural networks. arXiv preprint arXiv:1511.06939 (2015).
- Hidasi et al. (2016) Balázs Hidasi, Massimo Quadrana, Alexandros Karatzoglou, and Domonkos Tikk. 2016. Parallel recurrent neural network architectures for feature-rich session-based recommendations. In Proceedings of the 10th ACM Conference on Recommender Systems. 241–248.
- Hsieh et al. (2017) Cheng-Kang Hsieh, Longqi Yang, Yin Cui, Tsung-Yi Lin, Serge Belongie, and Deborah Estrin. 2017. Collaborative metric learning. In Proceedings of the 26th international conference on world wide web. 193–201.
- Hu et al. (2008) Yifan Hu, Yehuda Koren, and Chris Volinsky. 2008. Collaborative filtering for implicit feedback datasets. In 2008 Eighth IEEE International Conference on Data Mining. Ieee, 263–272.
- Huang et al. (2018) Xiaowen Huang, Shengsheng Qian, Quan Fang, Jitao Sang, and Changsheng Xu. 2018. Csan: Contextual self-attention network for user sequential recommendation. In Proceedings of the 26th ACM international conference on Multimedia. 447–455.
- Kang and McAuley (2018) Wang-Cheng Kang and Julian McAuley. 2018. Self-attentive sequential recommendation. In 2018 IEEE International Conference on Data Mining (ICDM). IEEE, 197–206.
- Koren (2008) Yehuda Koren. 2008. Factorization meets the neighborhood: a multifaceted collaborative filtering model. In Proceedings of the 14th ACM SIGKDD international conference on Knowledge discovery and data mining. 426–434.
- Koren et al. (2009) Yehuda Koren, Robert Bell, and Chris Volinsky. 2009. Matrix factorization techniques for recommender systems. Computer 8 (2009), 30–37.
- Li et al. (2018) Xiang Li, Luke Vilnis, Dongxu Zhang, Michael Boratko, and Andrew McCallum. 2018. Smoothing the Geometry of Probabilistic Box Embeddings. In The International Conference on Learning Representations.
- Lv et al. (2019) Fuyu Lv, Taiwei Jin, Changlong Yu, Fei Sun, Quan Lin, Keping Yang, and Wilfred Ng. 2019. SDM: Sequential deep matching model for online large-scale recommender system. In Proceedings of the 28th ACM International Conference on Information and Knowledge Management. 2635–2643.
- Ma et al. (2019) Chen Ma, Peng Kang, and Xue Liu. 2019. Hierarchical gating networks for sequential recommendation. In Proceedings of the 25th ACM SIGKDD International Conference on Knowledge Discovery & Data Mining. 825–833.
- Maaten and Hinton (2008) Laurens van der Maaten and Geoffrey Hinton. 2008. Visualizing data using t-SNE. Journal of machine learning research 9, Nov (2008), 2579–2605.
- Maji (2012) Pradipta Maji. 2012. A rough hypercuboid approach for feature selection in approximation spaces. IEEE Transactions on Knowledge and Data Engineering 26, 1 (2012), 16–29.
- McAuley et al. (2015) Julian McAuley, Christopher Targett, Qinfeng Shi, and Anton Van Den Hengel. 2015. Image-based recommendations on styles and substitutes. In Proceedings of the 38th International ACM SIGIR Conference on Research and Development in Information Retrieval. 43–52.
- Quadrana et al. (2018) Massimo Quadrana, Paolo Cremonesi, and Dietmar Jannach. 2018. Sequence-aware recommender systems. ACM Computing Surveys (CSUR) 51, 4 (2018), 1–36.
- Ren* et al. (2020) Hongyu Ren*, Weihua Hu*, and Jure Leskovec. 2020. Query2box: Reasoning over Knowledge Graphs in Vector Space Using Box Embeddings. In International Conference on Learning Representations. https://openreview.net/forum?id=BJgr4kSFDS
- Rendle et al. (2009) Steffen Rendle, Christoph Freudenthaler, Zeno Gantner, and Lars Schmidt-Thieme. 2009. BPR: Bayesian Personalized Ranking from Implicit Feedback. In Proceedings of the Twenty-Fifth Conference on Uncertainty in Artificial Intelligence (Montreal, Quebec, Canada) (UAI ’09). AUAI Press, Arlington, Virginia, USA, 452–461.
- Ricci et al. (2011) Francesco Ricci, Lior Rokach, and Bracha Shapira. 2011. Introduction to recommender systems handbook. In Recommender systems handbook. Springer, 1–35.
- Schuster and Paliwal (1997) Mike Schuster and Kuldip K Paliwal. 1997. Bidirectional recurrent neural networks. IEEE transactions on Signal Processing 45, 11 (1997), 2673–2681.
- Shani and Gunawardana (2011) Guy Shani and Asela Gunawardana. 2011. Evaluating recommendation systems. In Recommender systems handbook. Springer, 257–297.
- Shi et al. (2014) Yue Shi, Martha Larson, and Alan Hanjalic. 2014. Collaborative filtering beyond the user-item matrix: A survey of the state of the art and future challenges. ACM Computing Surveys (CSUR) 47, 1 (2014), 1–45.
- Srivastava et al. (2014) Nitish Srivastava, Geoffrey Hinton, Alex Krizhevsky, Ilya Sutskever, and Ruslan Salakhutdinov. 2014. Dropout: a simple way to prevent neural networks from overfitting. The journal of machine learning research 15, 1 (2014), 1929–1958.
- Su and Khoshgoftaar (2009) Xiaoyuan Su and Taghi M Khoshgoftaar. 2009. A survey of collaborative filtering techniques. Advances in artificial intelligence 2009 (2009).
- Tan et al. (2016) Yong Kiam Tan, Xinxing Xu, and Yong Liu. 2016. Improved recurrent neural networks for session-based recommendations. In Proceedings of the 1st Workshop on Deep Learning for Recommender Systems. 17–22.
- Tang and Wang (2018) Jiaxi Tang and Ke Wang. 2018. Personalized top-n sequential recommendation via convolutional sequence embedding. In Proceedings of the Eleventh ACM International Conference on Web Search and Data Mining. 565–573.
- Tay et al. (2018) Yi Tay, Luu Anh Tuan, and Siu Cheung Hui. 2018. Latent relational metric learning via memory-based attention for collaborative ranking. In Proceedings of the 2018 World Wide Web Conference. International World Wide Web Conferences Steering Committee, 729–739.
- Vaswani et al. (2017) Ashish Vaswani, Noam Shazeer, Niki Parmar, Jakob Uszkoreit, Llion Jones, Aidan N Gomez, Łukasz Kaiser, and Illia Polosukhin. 2017. Attention is all you need. In Advances in neural information processing systems. 5998–6008.
- Venn (1880) John Venn. 1880. I. On the diagrammatic and mechanical representation of propositions and reasonings. The London, Edinburgh, and Dublin philosophical magazine and journal of science 10, 59 (1880), 1–18.
- Vilnis et al. (2018) Luke Vilnis, Xiang Li, Shikhar Murty, and Andrew McCallum. 2018. Probabilistic Embedding of Knowledge Graphs with Box Lattice Measures. In Proceedings of the 56th Annual Meeting of the Association for Computational Linguistics (Volume 1: Long Papers). Association for Computational Linguistics, Melbourne, Australia, 263–272. https://doi.org/10.18653/v1/P18-1025
- Vinh Tran et al. (2020) Lucas Vinh Tran, Yi Tay, Shuai Zhang, Gao Cong, and Xiaoli Li. 2020. HyperML: A Boosting Metric Learning Approach in Hyperbolic Space for Recommender Systems. In Proceedings of the 13th International Conference on Web Search and Data Mining. 609–617.
- Wang et al. (2015) Hao Wang, Naiyan Wang, and Dit-Yan Yeung. 2015. Collaborative Deep Learning for Recommender Systems. In Proceedings of the 21th ACM SIGKDD International Conference on Knowledge Discovery and Data Mining (Sydney, NSW, Australia) (KDD ’15). Association for Computing Machinery, New York, NY, USA, 1235–1244. https://doi.org/10.1145/2783258.2783273
- Wei et al. (2010) J. Wei, S. Wang, and X. Yuan. 2010. Ensemble Rough Hypercuboid Approach for Classifying Cancers. IEEE Transactions on Knowledge and Data Engineering 22, 3 (March 2010), 381–391. https://doi.org/10.1109/TKDE.2009.114
- Weston et al. (2013) Jason Weston, Ron J Weiss, and Hector Yee. 2013. Nonlinear latent factorization by embedding multiple user interests. In Proceedings of the 7th ACM conference on Recommender systems. ACM, 65–68.
- Wu et al. (2016) Yao Wu, Christopher DuBois, Alice X Zheng, and Martin Ester. 2016. Collaborative denoising auto-encoders for top-n recommender systems. In Proceedings of the Ninth ACM International Conference on Web Search and Data Mining. 153–162.
- Xue et al. (2017) Hong-Jian Xue, Xinyu Dai, Jianbing Zhang, Shujian Huang, and Jiajun Chen. 2017. Deep Matrix Factorization Models for Recommender Systems.. In IJCAI. 3203–3209.
- Yuan et al. (2019) Fajie Yuan, Alexandros Karatzoglou, Ioannis Arapakis, Joemon M Jose, and Xiangnan He. 2019. A simple convolutional generative network for next item recommendation. In Proceedings of the Twelfth ACM International Conference on Web Search and Data Mining. 582–590.
- Zhang et al. (2019a) Aston Zhang, Zachary C Lipton, Mu Li, and Alexander J Smola. 2019a. Dive into Deep Learning. Unpublished draft. Retrieved 3 (2019), 319.
- Zhang and Parker (2011) Hao Zhang and Lynne E Parker. 2011. 4-dimensional local spatio-temporal features for human activity recognition. In 2011 IEEE/RSJ international conference on intelligent robots and systems. IEEE, 2044–2049.
- Zhang et al. (2019b) Shuai Zhang, Lina Yao, Aixin Sun, and Yi Tay. 2019b. Deep Learning Based Recommender System: A Survey and New Perspectives. ACM Comput. Surv. 52, 1, Article 5 (Feb. 2019), 38 pages. https://doi.org/10.1145/3285029
- Zhang et al. (2019c) Shuai Zhang, Lina Yao, Lucas Vinh Tran, Aston Zhang, and Yi Tay. 2019c. Quaternion collaborative filtering for recommendation. In Proceedings of the 28th International Joint Conference on Artificial Intelligence. AAAI Press, 4313–4319.
- Zhou et al. (2018) Chang Zhou, Jinze Bai, Junshuai Song, Xiaofei Liu, Zhengchao Zhao, Xiusi Chen, and Jun Gao. 2018. Atrank: An attention-based user behavior modeling framework for recommendation. In Thirty-Second AAAI Conference on Artificial Intelligence.