Topological Anderson insulators in an Ammann-Beenker quasicrystal and a snub-square crystal
Abstract
The quest for the topological phases of matter in an aperiodic system has been greatly developed recently. Here we investigate the effects of disorder on topological phases of a two-dimensional Ammann-Beenker tiling quasicrystalline lattice. For comparison purposes, we also consider the case of a periodic snub-square crystalline lattice, which has the same primitive tiles as the Ammann-Beenker tiling quasicrystalline lattice. By calculating the spin Bott index and the two-terminal conductance, we confirm that the topological phases with disorder share the similar properties in the two systems which possess different symmetry and periodicity. It is shown that the quantum spin Hall states are robust against weak disorder in both the quasicrystalline lattice and the crystalline lattice. More interesting is that topological Anderson insulator phases induced by disorder appear in the two systems. Furthermore, the quantized conductance plateau contributed by the topological Anderson insulator phase is verified by the distribution of local currents.
I Introduction
In the past decade, the study of quantum spin Hall (QSH) insulator, which is a two-dimensional (2D) topological insulator with a full insulating bulk gap but gapless helical edge states protected by time-reversal symmetry, has always been a hot spot in condensed matter physics [1, 2, 3, 4, 5, 6, 7, 8, 9, 10]. However, most of the previous works were implemented in the crystalline systems. The aperiodic systems without the translational symmetry are also found to host topological phases [11, 12, 13, 14, 15, 16, 17, 18, 19, 20, 21, 22, 23, 24, 25, 26, 27, 28, 29, 30, 31, 32, 33, 34, 35, 36, 37, 38, 39, 40, 41, 42, 28, 43, 44, 24]. Interestingly, topological phases in quasicrystalline systems, which are the special aperiodic systems and possess forbidden symmetries in crystals, have been extensively studied. Some typical topological phases, such as the non-Hermitian topological phase [25, 26], the higher-order topological phase [27, 28, 29], and the topological superconductor phase [30, 31], have been studied in quasicrystalline systems. Moreover, the photonic quasicrystals [45] and the quasiperiodic acoustic waveguides [46] can be used as the experimental platform to research topological phase in quasicrystals.
Very recently, Huang and Liu theoretically presented that the fivefold Penrose tiling quasicrystal can be used as a platform to realize the QSH insulator, and a real-space topological invariant called the spin Bott index is defined to characterize the topological phase of the system [32, 33]. Furtherly, they found that the QSH states in an eightfold Ammann-Beenker tiling quasicrystal and a periodic snub-square crystal, both sharing the same primitive tiles, exhibit similar topological behaviors regardless of symmetry and periodicity, except for some quantitative differences [34].
However, due to the abundant physical phenomenon induced by disorder, the interplay between disorder and topology is an important topic in the research of topological phase. Topological Anderson insulator (TAI) [47], which is a disorder-induced topological phase, has been theoretically studied in various systems, including Chern insulators [48, 49, 50, 51, 52], topological insulators [53, 54, 55, 56, 57, 58, 59, 60, 61, 62, 63], topological semimetals [64, 65, 66, 67, 68, 69, 51], topological superconductors [70, 71, 72, 73], non-Hermitian systems [74, 75, 76], and higher-order topological insulators [77, 78]. The more important discoveries of TAI are the recent experimental realizations in a one-dimensional disordered atomic wires [79], a photonic platform [80, 81] and electric circuits [82], respectively. It is noted that recently Chen et al. extended the territory of the TAI phase from crystalline systems to quasicrystalline systems, and they implemented the TAI in a fivefold Penrose tiling quasicrystal [83]. Inspired by the work of Huang and Liu [34], an intriguing question is that whether the appearance of TAI phase in crystalline and quasicrystalline systems is similar and has the same regular pattern.
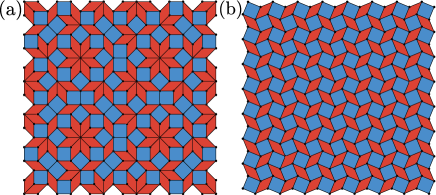
In this work, we investigate the effects of disorder on topological phases of a 2D eightfold Ammann-Beenker tiling quasicrystalline lattice [84, 85, 86, 87] and a periodic snub-square crystalline lattice [88], as shown in Fig. 1. This quasicrystalline lattice and this crystalline lattice have the same square and rhombus tiles, therefore they can be used as an effective comparison device to study the similarities and differences of physical phenomenon in the systems with different symmetry and periodicity [34]. By calculating the spin Bott index and the two-terminal conductance, we show that the QSH insulator phases in the two systems are robust against weak disorder, and the TAI induced from a normal insulator occurs at a certain region of disorder strength with a quantized conductance plateau () characterized by a nonzero spin Bott index (). More interestingly, we found that with the same model parameters, the disorder-induced topological phase transition can occur in smaller disorder strength in the quasicrystalline lattice than in the crystalline lattice. This is due to the different initial bulk energy gaps of the two systems. The distribution of nonequilibrium local current further confirms that the quantized conductance plateau arises from the helical edge states induced by disorder. It is presented that the topological nontrivial phases with disorder reveal qualitative similarities in quasicrystals and crystals, in spite of quantitative differences. Thus, it is indicated that the appearance of TAI is independent of the lattice symmetry and periodicity.
The rest of the paper is organized as follows. In Sec. II, we introduce a QSH insulator model with Anderson-type disorder in 2D quasicrystalline lattice and crystalline lattice. Then, we give the details of numerical methods in Sec. III, and provide numerical results for studying the topological phase transitions of the two systems in Sec. IV. Finally, we summarize our conclusions in Sec. V.
II Model
We start with a tight-binding model of a QSH insulator with Anderson-type disorder in an Ammann-Beenker tiling quasicrystalline lattice and a periodic snub-square crystalline lattice. The lattice sites are located on the vertices of the quasicrystalline lattice and the crystalline lattice as shown in Fig. 1. In this work, we only consider the first three nearest-neighbor hopping. The model Hamiltonian is given by [27, 29]
| (1) |
with the QSH insulator Hamiltonian
| (2) |
and the Anderson-type disorder term
| (3) |
where is the creation operator at site . and present two orbitals at each site. and denote spin-up and spin-down, respectively. and denote lattice sites running from to , and is the total number of lattice sites. and are the Pauli matrices acting an the spin and orbital spaces, respectively. and are the identity matrices. and are the hopping amplitudes. is the polar angle of bond between site and with respect to the horizontal direction. is the spatial decay factor of hopping amplitudes with the decay length , where is the distance from the site to site . is the Dirac mass. is the uniform random variable chosen from , and is the disorder strength. preserves time-reversal, particle-hole and chiral symmetries, therefore it belongs to the class DIII [89, 90, 27]. It is worth noting that the system will reduce to a Bernevig-Hughes-Zhang model [8] which describes the QSH states in HgTe quantum wells, if the QSH insulator Hamiltonian in Eq. 2 is projected to a square lattice and only the nearest neighbor hopping is considered. In the following calculations, the spatial decay length and the side length of rhombus and square are fixed as , and the energy unit is set as .
III Numerical Methods
In this section, we introduce the numerical methods, which include the spin Bott index [32, 33, 83] and the two-terminal conductance based on the recursive Green’s function method [91, 92], to study the disorder-induced topological phase transitions in the quasicrystalline and the crystalline systems.
It is well known that the index is a useful topological invariant to characterize the QSH topological phase in periodic systems [7, 93]. However, the Amman-Beenker tiling quasicrystal lacks the translational symmetry since it is tiled completely of the 2D plane with squares and rhombuses in an aperiodic way. Therefore, the quasicrystalline systems can not use the momentum-space index to characterize the topological phase, and we need to adopt a real-space topological invariant without translational invariance. It is worth noting that Huang and Liu have proposed that the spin Bott index, which is a real-space topological invariant, can appropriately characterize the QSH state in both periodic and aperiodic systems [32, 33]. Additionally, there are several invariants that can be computed on 2D systems with time-reversal symmetry and without translational invariance in finite-dimensional Hilbert space [94, 95]. Here, we will employ the spin Bott index to characterize the topological phases of the systems.
Here, we review the detailed steps of numerical calculation of the spin Bott index. First, one constructs the projector operator of the occupied states as
| (4) |
where is the th wave function of the Hamiltonian (1) and is the total number of occupied states. Then, one introduces another projector operator as , where is the spin operator with the Pauli matrix . The eigenvalues of are divided into two parts by zero energy, in which the number of positive and negative eigenvalues are both equal to . Then, a new projector operator can be constructed as
| (5) |
where and are the eigenvectors corresponding to the th positive and negative eigenvalues, respectively. The projected position operators of the two spin sectors can be defined as
| (6) | |||
| (7) |
where and are two diagonal matrices, and with being the coordinate of the th lattice site.
In addition, the singular value decomposition (SVD) method, acting on and , will be used to improve the stability of the numerical results. The SVD can be expressed as , where and are unitary and is real and diagonal. Then, one takes as the new projected position operator used to replace . Finally, one can obtain the spin Bott index as [32, 33, 83]
| (8) |
where are the Bott indexes of spin up and down, respectively. The case with corresponds to the normal insulator phase, and corresponds to the QSH insulator phase.
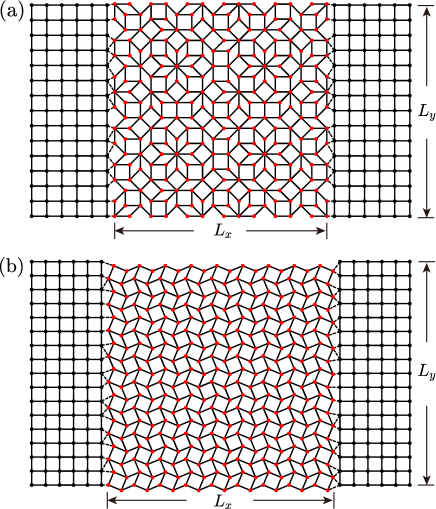
However, we also study the transport properties of the systems, and the setups are shown in Fig. 2. It is assumed that two semi-infinite normal metal leads are attached to the end of the quasicrystal device [shown in Fig. 2(a)] and the crystal device [shown in Fig. 2(b)], respectively. Then, we calculate the two-terminal conductance of the system based on the recursive Green’s function method [91, 92]. According to Landauer-Büttiker-Fisher-Lee formula [96, 97, 98], the conductance can be written as
| (9) |
where is the transmission coefficient at energy . is the left (right) linewidth with the left (right) lead retarded self-energy and the left (right) lead advanced self-energy . is the retarded (advanced) Green’s function of the device, and can be expressed as
| (10) |
where is the device Hamiltonian.
IV Numerical simulation
In this section, we give the numerical results of calculating the spin Bott index and the two-terminal conductance to investigate the topological phase transitions of the quasicrystalline and the crystalline systems.
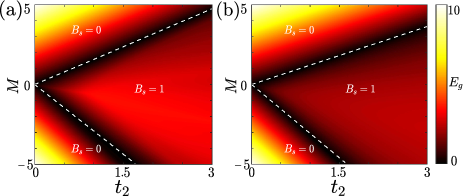
Before studying disorder effects on the two systems, we first reveal the topological phase diagrams of the two systems in the clean limit, i.e., the disorder strength . Figure 3 shows the bulk energy gap as a function of Dirac mass and hopping amplitude in the clean limit for the two systems. The color map shows the magnitudes of the bulk energy gap . The energy gaps of two systems are both calculated numerically in real space with periodic boundary condition. There would be midgap states if we directly covert a square-shaped AB tiling quasicrystalline lattice to a torus geometry when applying periodic boundary conditions. This because some additional hoppings are introduced when linking the sites on the opposite boundaries. To avoid this, we first generate a square-shaped quasicrystalline lattice and then delete the sites on the top boundary of the quasicrystal square (these sites are equivalent to the sites on the opposite bottom boundary). Next, we glue the bottom and top boundaries. And we perform the same procedure for the right and left boundaries. With this method, no additional hoppings are introduced on the tortus geometry.
Both of the two phase diagrams are separated into three parts by two lines of energy gap closure, which indicates that the bulk energy gap of the two systems has a process of closing and reopening with the change of parameters. It also means that topological phase transitions may occur in the two systems. Therefore, we also compute the spin Bott index to distinguish the topological phases of the two systems, and give the phase boundaries of the normal insulator phase and the QSH insulator phase (the white dashed lines in Fig. 3). In the case of quasicrystalline lattice, as shown in Fig. 3(a), it is found that a QSH insulator phase is characterized by the nonzero spin Bott index when . When and , two normal insulator phases with are shown. Simultaneously, for the snub-square crystalline lattice, the phase boundaries are and as shown in Fig. 3(b). It is found that the phase diagrams of two systems are very similar expect that the slopes of the phase boundaries are slightly different in the clean limit by comparing Figs. 3(a) and 3(b).
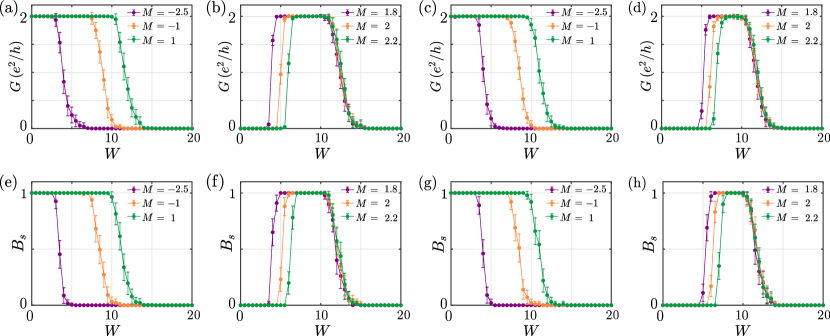
Next, we study the disorder effects on the topological phase transitions of the two systems. Figure 4 shows the two-terminal conductance and the spin Bott index as a function of the disorder strength at several specified parametric spatial points for two systems.
As shown in Fig. 3(a), for the case of in quasicrystalline system, the phases are the QSH insulator phase with the nonzero spin Bott index in the clean limit. The corresponding bulk energy gap are , where . With the disorder strength increasing, it is found that the QSH insulator phases remain stable in the case of weak disorder, which are characterized by the quantized conductance [colourful curves in Fig. 4(a)] and the nonzero spin Bott index [colourful curves in Fig. 4(e)]. When the disorder strength reach the critical values, the system undergoes topological phase transitions from QSH phase into normal insulator phase with the conductance and the spin Bott index . For the case of in crystalline system, the numerical results of calculating the conductance and the spin Bott index, as shown in Figs. 4(c) and 4(g), are similar with the case of quasicrystalline lattice except that the critical values of the phase transition are slightly different. The numerical results clearly demonstrate that the topological insulator phase is robust against weak disorder whether in quasicrystal system or crystalline system.
For another case of in quasicrystalline system, the phases are the normal insulator phases with the spin Bott index in the clean limit, as shown in Fig. 3(a). The corresponding bulk energy gap are . The purple, orange and green curves in Fig. 4(b) show the two-terminal conductance in the quasicrystalline system as a function of disorder strength with , respectively. It is found that the conductances change from to at and return to at . Some remarkable plateaux with the quantized conductance are revealed. The quantized plateaux indicate that a QSH insulator phase induced by disorder in the quasicrystalline system appears, which is so called topological Anderson insulator [47, 83]. Furthermore, the values of spin Bott index jump from to at and go back to at [shown in Fig. 4(f)]. It is obvious that the plateaux of spin Bott index can match well with the plateaux of the conductance. However, some similar quantized conductance and spin Bott index plateaux with the range of to also emerge in the crystalline system, as shown in Figs. 4(d) and 4(h). It is found that the disorder-induced topological phase transitions from normal insulator to TAI and then to Anderson insulator occur in both the quasicrystalline and the crystalline systems. However, for the same model parameters, the disorder-induced quantized plateau in the quasicrystalline system appears in smaller disorder strength and vanishes in stronger disorder strength than that in the crystalline system. Thus, the disorder-induced QSH insulator phases are qualitatively similar in the quasicrystalline system and the crystalline system, but quantitatively different.
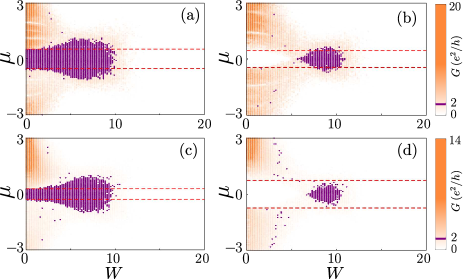
Figure 5 shows the topological phase diagrams in (, ) space of the quasicrystalline system and the crystalline system with different parameters obtained by the two-terminal conductance. The color map shows the values of conductance . Each point in Fig. 5 is obtained from a single distribution of disorder, which is sufficient to determine the quantized conductance region. The purple region represents the topological nontrivial phase with a quantized conductance , the white region represents the topological trivial phase with , and the orange region corresponds to the conductance of the bulk. The difference of the two lattice construction may lead to the difference of the maximum bulk conductance. The region between the two red dashed lines represents the bulk energy gap of the system. It is obvious that the TAI phase occurs mainly in the energy gap and the the disorder-induced topological nontrivial phase region in the Ammann-Beenker tiling quasicrystal is larger and more stable than that in the snub-square crystalline lattice, as shown in Figs. 5(b) and 5(d).
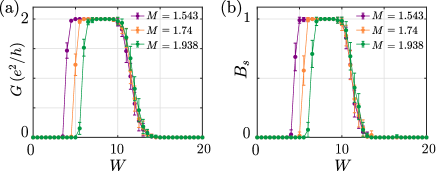
In fact, due to the different lattice constructions, the bulk energy gaps are different for the two systems with the same model parameters. We will take some specific model parameters to ensure that the two systems have the same bulk energy gaps in the clean limit, and then study the effects of disorder in this case by calculating the two-terminal conductance and spin Bott index. Figure 6 shows the two-terminal conductance and the spin Bott index as a function of the disorder strength with in crystal. The corresponding bulk energy gaps are in the clean limit, which are very closed to the energy gaps with in quasicrystal. It is found that the conductance and spin Bott index plateaux arise at and vanish at , as shown in Figs. 6(a) and 6(b). Here, the points where the conductance and spin Bott index plateaus appear are consistent with that in Figs. 4(a) and 4(b). Thus, it is indicated that the response in the two systems of disorder is roughly same when the initial bulk energy gaps of the quasicrystalline system and the crystalline system are the same.
In order to better understand the origin of the TAI phase, we calculate the nonequilibrium local current between neighboring sites and from the formula [53]
| (11) |
where is the electron correlation function. and denote the state indices. To calculate the local current distribution, a small external bias is applied longitudinally between the two terminals, where and describe the voltages of the left and right leads. The small bias voltage is fixed to be .
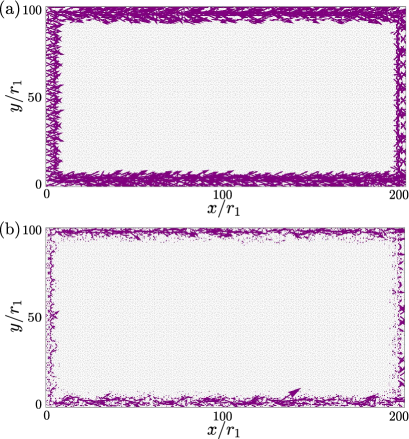
In Fig. 7, we show the averaged current distribution of the disorder-induced QSH insulator state. Distinctly, in both the quasicrystalline system and the crystalline system, the currents tend to be zero in the bulk, and are localized at the boundaries of the samples without much scattering. The edge transport is a strong evidence of the quantized conductance, which is contributed by the topological Anderson insulator phase. The numerical results are consistent with the above results of the two terminal conductance and the spin Bott index.
V Conclusion and discussion
In this paper, based on the spin Bott index and the two-terminal conductance method, we investigate the disorder-induced topological phase transitions of the Ammann-Beenker tiling quasicrystal and a periodic snub-square crystal. The two lattices have the same square and rhombus tiles. The numerical calculating results of the spin Bott index and the two-terminal conductance of the two systems share qualitative similarities. First, the QSH insulator phase in the two systems are robust against weak disorder and destroyed by strong disorder. Second, the topological phase transitions from normal insulator to TAI characterized by a quantized conductance plateau and a nonzero spin Bott index of the two systems occur at a certain range of disorder strength. Some quantitative differences are also observed, such as the conductance plateau induced by disorder in the Ammann-Beenker tiling quasicrystal is wider than that in the snub-square crystal. Furthermore, we present the averaged nonequilibrium local current distribution to further identify the disorder-induced topological nontrivial phases of the two systems. In summary, we find that the disorder-induced topological phase transitions whether from QSH insulator to normal insulator or from normal insulator to TAI are independent of the lattice structure by comparing the results in the Ammann-Beenker tiling quasicrystal with those of the periodic snub-square crystal.
It is noted that the classification of quasicrystals in two dimensions is a very important problem, and has been investigated in previous works [99, 100, 101]. The problem of classifying 2D lattices with -fold rotational symmetry for arbitrary (noncrystallographic) even is equivalent to a much-studied problem in algebraic number theory [99]. Mermin et al. found that except for 29 even number there are two or more distinct lattices, and the smallest for which there is more than a single lattice is =46 [99]. In the previous work, the TAI was theoretically investigated in a fivefold Penrose tiling quasicrystal [83]. Here our study further confirmed that the TAI can occur in an eightfold Ammann-Beenker tiling quasicrystal. In addition, we also calculated the two-terminal conductance of a twelvefold Stampfli-tiling quasicrystal with disorder [the model Hamiltonian is the same as Eqs. (1)-(3)]. It is found that the QSH and the TAI phase can also occur in a twelvefold Stampfli-tiling quasicrystal (further details will be given in the future work). We conjecture that the appearance of the TAI phase in 2D quasicrystals would be a general phenomenon, just the values of parameters where the topological phase transition occurs depend on the quasicrystal lattice structure properties. The TAI phase of the other N-fold quasicrystals will be furtherly investigated in the future, and we predict that the same physics will be implemented in these lattices.
Recently, TAIs and quasicrystals have been successfully implemented in experiments based on photonic platform [24, 80, 102, 45, 103, 104, 105]. Inspired by the recent experiments, we propose an experimental setup to construct an Ammann-Beenker tiling quasicrystalline lattice and a periodic snub-square crystalline lattice in an array of helical evanescently coupled waveguides [24, 104], and add on-site disorder in the form of random variations in the refractive index of the waveguides [80]. Consequently, we believe that the experimental realization of the Ammann-Beenker tiling quasicrystalline lattice and the periodic snub-square crystalline lattice with disorder is promising in the above experimental schemes, especially in the photonic systems.
Acknowledgments
B.Z. was supported by the NSFC (under Grant No. 12074107) and the program of outstanding young and middle-aged scientific and technological innovation team of colleges and universities in Hubei Province (under Grant No. T2020001). D.-H.X. was supported by the NSFC (under Grants No. 12074108 and No. 11704106). D.-H.X. also acknowledges the financial support of the Chutian Scholars Program in Hubei Province. R.C. was supported by the Project funded by China Postdoctoral Science Foundation (under Grant No. 2019M661678).
References
- Hasan and Kane [2010] M. Z. Hasan and C. L. Kane, Rev. Mod. Phys. 82, 3045 (2010).
- Xiao et al. [2010] D. Xiao, M.-C. Chang, and Q. Niu, Rev. Mod. Phys. 82, 1959 (2010).
- Qi and Zhang [2011] X.-L. Qi and S.-C. Zhang, Rev. Mod. Phys. 83, 1057 (2011).
- Bansil et al. [2016] A. Bansil, H. Lin, and T. Das, Rev. Mod. Phys. 88, 021004 (2016).
- Wen [2017] X.-G. Wen, Rev. Mod. Phys. 89, 041004 (2017).
- Kane and Mele [2005a] C. L. Kane and E. J. Mele, Phys. Rev. Lett. 95, 226801 (2005a).
- Kane and Mele [2005b] C. L. Kane and E. J. Mele, Phys. Rev. Lett. 95, 146802 (2005b).
- Bernevig et al. [2006] B. A. Bernevig, T. L. Hughes, and S.-C. Zhang, Science 314, 1757 (2006).
- Bernevig and Zhang [2006] B. A. Bernevig and S.-C. Zhang, Phys. Rev. Lett. 96, 106802 (2006).
- Sheng et al. [2006] D. N. Sheng, Z. Y. Weng, L. Sheng, and F. D. M. Haldane, Phys. Rev. Lett. 97, 036808 (2006).
- Tanaka [1987] K. Tanaka, Journal of Non-Crystalline Solids 97, 391 (1987).
- Agarwala and Shenoy [2017] A. Agarwala and V. B. Shenoy, Phys. Rev. Lett. 118, 236402 (2017).
- Mansha and Chong [2017] S. Mansha and Y. D. Chong, Phys. Rev. B 96, 121405(R) (2017).
- Xiao and Fan [2017] M. Xiao and S. Fan, Phys. Rev. B 96, 100202(R) (2017).
- Mitchell et al. [2018] N. P. Mitchell, L. M. Nash, D. Hexner, A. M. Turner, and W. T. Irvine, Nat. Phys. 14, 380 (2018).
- Bourne and Prodan [2018] C. Bourne and E. Prodan, J. Phys. A 51, 235202 (2018).
- Pöyhönen et al. [2018] K. Pöyhönen, I. Sahlberg, A. Westström, and T. Ojanen, Nature Commun. 9, 1 (2018).
- Minarelli et al. [2019] E. L. Minarelli, K. Pöyhönen, G. A. R. van Dalum, T. Ojanen, and L. Fritz, Phys. Rev. B 99, 165413 (2019).
- Chern [2019] G.-W. Chern, Europhys. Lett. 126, 37002 (2019).
- Yang et al. [2019a] Y.-B. Yang, T. Qin, D.-L. Deng, L.-M. Duan, and Y. Xu, Phys. Rev. Lett. 123, 076401 (2019a).
- Yang et al. [2019b] B. Yang, H. Zhang, T. Wu, R. Dong, X. Yan, and X. Zhang, Phys. Rev. B 99, 045307 (2019b).
- Agarwala et al. [2020] A. Agarwala, V. Juričić, and B. Roy, Phys. Rev. Research 2, 012067(R) (2020).
- Tran et al. [2015] D.-T. Tran, A. Dauphin, N. Goldman, and P. Gaspard, Phys. Rev. B 91, 085125 (2015).
- Bandres et al. [2016] M. A. Bandres, M. C. Rechtsman, and M. Segev, Phys. Rev. X 6, 011016 (2016).
- Longhi [2019] S. Longhi, Phys. Rev. Lett. 122, 237601 (2019).
- Zeng et al. [2020] Q.-B. Zeng, Y.-B. Yang, and Y. Xu, Phys. Rev. B 101, 020201(R) (2020).
- Chen et al. [2020] R. Chen, C.-Z. Chen, J.-H. Gao, B. Zhou, and D.-H. Xu, Phys. Rev. Lett. 124, 036803 (2020).
- Varjas et al. [2019] D. Varjas, A. Lau, K. Pöyhönen, A. R. Akhmerov, D. I. Pikulin, and I. C. Fulga, Phys. Rev. Lett. 123, 196401 (2019).
- Hua et al. [2020] C.-B. Hua, R. Chen, B. Zhou, and D.-H. Xu, Phys. Rev. B 102, 241102(R) (2020).
- Fulga et al. [2016] I. C. Fulga, D. I. Pikulin, and T. A. Loring, Phys. Rev. Lett. 116, 257002 (2016).
- [31] R. Ghadimi, T. Sugimoto, K. Tanaka, and T. Tohyama, “Topological superconductivity in quasicrystals,” arXiv:2006.06952 [cond-mat.supr-con] .
- Huang and Liu [2018a] H. Huang and F. Liu, Phys. Rev. Lett. 121, 126401 (2018a).
- Huang and Liu [2018b] H. Huang and F. Liu, Phys. Rev. B 98, 125130 (2018b).
- Huang and Liu [2019] H. Huang and F. Liu, Phys. Rev. B 100, 085119 (2019).
- Kraus et al. [2012] Y. E. Kraus, Y. Lahini, Z. Ringel, M. Verbin, and O. Zilberberg, Phys. Rev. Lett. 109, 106402 (2012).
- Verbin et al. [2015] M. Verbin, O. Zilberberg, Y. Lahini, Y. E. Kraus, and Y. Silberberg, Phys. Rev. B 91, 064201 (2015).
- Madsen et al. [2013] K. A. Madsen, E. J. Bergholtz, and P. W. Brouwer, Phys. Rev. B 88, 125118 (2013).
- He et al. [2019] A.-L. He, L.-R. Ding, Y. Zhou, Y.-F. Wang, and C.-D. Gong, Phys. Rev. B 100, 214109 (2019).
- Loring [2019] T. A. Loring, J. Math. Phys 60, 081903 (2019).
- Dareau et al. [2017] A. Dareau, E. Levy, M. B. Aguilera, R. Bouganne, E. Akkermans, F. Gerbier, and J. Beugnon, Phys. Rev. Lett. 119, 215304 (2017).
- Zhou et al. [2019] D. Zhou, L. Zhang, and X. Mao, Phys. Rev. X 9, 021054 (2019).
- Spurrier and Cooper [2020] S. Spurrier and N. R. Cooper, Phys. Rev. Research 2, 033071 (2020).
- Silva et al. [2019] J. R. M. Silva, M. S. Vasconcelos, D. H. A. L. Anselmo, and V. D. Mello, J. Phys. Condens. Matter 31, 505405 (2019).
- Fuchs and Vidal [2016] J.-N. Fuchs and J. Vidal, Phys. Rev. B 94, 205437 (2016).
- Verbin et al. [2013] M. Verbin, O. Zilberberg, Y. E. Kraus, Y. Lahini, and Y. Silberberg, Phys. Rev. Lett. 110, 076403 (2013).
- Apigo et al. [2019] D. J. Apigo, W. Cheng, K. F. Dobiszewski, E. Prodan, and C. Prodan, Phys. Rev. Lett. 122, 095501 (2019).
- Li et al. [2009] J. Li, R.-L. Chu, J. K. Jain, and S.-Q. Shen, Phys. Rev. Lett. 102, 136806 (2009).
- Prodan et al. [2010] E. Prodan, T. L. Hughes, and B. A. Bernevig, Phys. Rev. Lett. 105, 115501 (2010).
- Zhang et al. [2013] Y.-F. Zhang, Y.-Y. Yang, Y. Ju, L. Sheng, R. Shen, D.-N. Sheng, and D.-Y. Xing, Chin. Phys. B 22, 117312 (2013).
- Castro et al. [2015] E. V. Castro, M. P. López-Sancho, and M. A. H. Vozmediano, Phys. Rev. B 92, 085410 (2015).
- Liu et al. [2016] S. Liu, T. Ohtsuki, and R. Shindou, Phys. Rev. Lett. 116, 066401 (2016).
- Kuno [2019] Y. Kuno, Phys. Rev. B 100, 054108 (2019).
- Jiang et al. [2009] H. Jiang, L. Wang, Q.-f. Sun, and X. C. Xie, Phys. Rev. B 80, 165316 (2009).
- Groth et al. [2009] C. W. Groth, M. Wimmer, A. R. Akhmerov, J. Tworzydło, and C. W. J. Beenakker, Phys. Rev. Lett. 103, 196805 (2009).
- Wu et al. [2016] B. Wu, J. Song, J. Zhou, and H. Jiang, Chin. Phys. B 25, 117311 (2016).
- Guo et al. [2011] H. Guo, S. Feng, and S.-Q. Shen, Phys. Rev. B 83, 045114 (2011).
- Chen et al. [2015a] C.-Z. Chen, H. Liu, H. Jiang, Q.-f. Sun, Z. Wang, and X. C. Xie, Phys. Rev. B 91, 214202 (2015a).
- Chen et al. [2017a] R. Chen, D.-H. Xu, and B. Zhou, Phys. Rev. B 96, 205304 (2017a).
- Xing et al. [2011] Y. Xing, L. Zhang, and J. Wang, Phys. Rev. B 84, 035110 (2011).
- Orth et al. [2016] C. P. Orth, T. Sekera, C. Bruder, and T. L. Schmidt, Sci. Rep. 6, 24007 (2016).
- Guo et al. [2010] H.-M. Guo, G. Rosenberg, G. Refael, and M. Franz, Phys. Rev. Lett. 105, 216601 (2010).
- Guo [2010] H.-M. Guo, Phys. Rev. B 82, 115122 (2010).
- Mondragon-Shem et al. [2014] I. Mondragon-Shem, T. L. Hughes, J. Song, and E. Prodan, Phys. Rev. Lett. 113, 046802 (2014).
- Chen et al. [2015b] C.-Z. Chen, J. Song, H. Jiang, Q.-f. Sun, Z. Wang, and X. C. Xie, Phys. Rev. Lett. 115, 246603 (2015b).
- Shapourian and Hughes [2016] H. Shapourian and T. L. Hughes, Phys. Rev. B 93, 075108 (2016).
- Chen et al. [2017b] R. Chen, D.-H. Xu, and B. Zhou, Phys. Rev. B 95, 245305 (2017b).
- Chen et al. [2018a] R. Chen, C.-Z. Chen, J.-H. Sun, B. Zhou, and D.-H. Xu, Phys. Rev. B 97, 235109 (2018a).
- Chen et al. [2018b] R. Chen, D.-H. Xu, and B. Zhou, Phys. Rev. B 98, 235159 (2018b).
- Sriluckshmy et al. [2018] P. V. Sriluckshmy, K. Saha, and R. Moessner, Phys. Rev. B 97, 024204 (2018).
- Borchmann et al. [2016] J. Borchmann, A. Farrell, and T. Pereg-Barnea, Phys. Rev. B 93, 125133 (2016).
- Qin et al. [2016] W. Qin, D. Xiao, K. Chang, S.-Q. Shen, and Z. Zhang, Sci. Rep. 6, 39188 (2016).
- Lieu et al. [2018] S. Lieu, D. K. K. Lee, and J. Knolle, Phys. Rev. B 98, 134507 (2018).
- Hua et al. [2019] C.-B. Hua, R. Chen, D.-H. Xu, and B. Zhou, Phys. Rev. B 100, 205302 (2019).
- Tang et al. [2020] L.-Z. Tang, L.-F. Zhang, G.-Q. Zhang, and D.-W. Zhang, Phys. Rev. A 101, 063612 (2020).
- Zhang et al. [2020] D.-W. Zhang, L.-Z. Tang, L.-J. Lang, H. Yan, and S.-L. Zhu, Sci. China Phys. Mech. Astron. 63, 267062 (2020).
- Liu et al. [2020a] H. Liu, Z. Su, Z.-Q. Zhang, and H. Jiang, Chin. Phys. B 29, 050502 (2020a).
- Li et al. [2020] C.-A. Li, B. Fu, Z.-A. Hu, J. Li, and S.-Q. Shen, Phys. Rev. Lett. 125, 166801 (2020).
- Yang et al. [2021] Y.-B. Yang, K. Li, L.-M. Duan, and Y. Xu, Phys. Rev. B 103, 085408 (2021).
- Meier et al. [2018] E. J. Meier, F. A. An, A. Dauphin, M. Maffei, P. Massignan, T. L. Hughes, and B. Gadway, Science 362, 929 (2018).
- Stützer et al. [2018] S. Stützer, Y. Plotnik, Y. Lumer, P. Titum, N. H. Lindner, M. Segev, M. C. Rechtsman, and A. Szameit, Nature 560, 461 (2018).
- Liu et al. [2020b] G.-G. Liu, Y. Yang, X. Ren, H. Xue, X. Lin, Y.-H. Hu, H.-x. Sun, B. Peng, P. Zhou, Y. Chong, and B. Zhang, Phys. Rev. Lett. 125, 133603 (2020b).
- [82] W. Zhang, D. Zou, Q. Pei, W. He, J. Bao, H. Sun, and X. Zhang, arXiv:2008.00423 .
- Chen et al. [2019] R. Chen, D.-H. Xu, and B. Zhou, Phys. Rev. B 100, 115311 (2019).
- Grünbaum and Shephard [1987] B. Grünbaum and G. C. Shephard, Tilings and Patterns (Courier Dover Publications, Mineola, NY, 1987).
- Beenker [1982] F. Beenker, Algebraic Theory of Non-periodic Tilings of the Plane by Two Simple Building Blocks : A Square and a Rhombus (Eindhoven University of Technology, Eindhoven, The Netherlands, 1982).
- Duneau [1989] M. Duneau, J. Phys. A 22, 4549 (1989).
- Kramer and Papadopolos [2003] P. Kramer and Z. Papadopolos, Coverings of Discrete Quasiperiodic Sets: Theory and Applications to Quasicrystals, Vol. 180 (Springer, Berlin, 2003).
- Chavey [1989] D. Chavey, Comput. Math. Appl 17, 147 (1989).
- Altland and Zirnbauer [1997] A. Altland and M. R. Zirnbauer, Phys. Rev. B 55, 1142 (1997).
- Schnyder et al. [2008] A. P. Schnyder, S. Ryu, A. Furusaki, and A. W. W. Ludwig, Phys. Rev. B 78, 195125 (2008).
- MacKinnon [1985] A. MacKinnon, Z.Phys.B 59, 385 (1985).
- Metalidis and Bruno [2005] G. Metalidis and P. Bruno, Phys. Rev. B 72, 235304 (2005).
- Fu and Kane [2006] L. Fu and C. L. Kane, Phys. Rev. B 74, 195312 (2006).
- Li and Mong [2019] Z. Li and R. S. Mong, Phys. Rev. B 100, 205101 (2019).
- Loring and Hastings [2011] T. A. Loring and M. B. Hastings, Europhys. Lett. 92, 67004 (2011).
- Landauer [1970] R. Landauer, Philos. Mag 21, 863 (1970).
- Büttiker [1988] M. Büttiker, Phys. Rev. B 38, 9375 (1988).
- Fisher and Lee [1981] D. S. Fisher and P. A. Lee, Phys. Rev. B 23, 6851 (1981).
- Mermin et al. [1987] N. D. Mermin, D. S. Rokhsar, and D. C. Wright, Phys. Rev. Lett. 58, 2099 (1987).
- Lifshitz [1997] R. Lifshitz, Rev. Mod. Phys. 69, 1181 (1997).
- Niizeki [2004] K. Niizeki, Phys. Rev. Lett. 93, 045501 (2004).
- Levi et al. [2011] L. Levi, M. Rechtsman, B. Freedman, T. Schwartz, O. Manela, and M. Segev, Science 332, 1541 (2011).
- Vardeny et al. [2013] Z. V. Vardeny, A. Nahata, and A. Agrawal, Nat. Photon. 7, 177 (2013).
- Viebahn et al. [2019] K. Viebahn, M. Sbroscia, E. Carter, J.-C. Yu, and U. Schneider, Phys. Rev. Lett. 122, 110404 (2019).
- Steurer and Sutter-Widmer [2007] W. Steurer and D. Sutter-Widmer, J. Phys. D: Appl. Phys. 40, R229 (2007).