Emergency Incident Detection from Crowdsourced Waze Data using Bayesian Information Fusion
Abstract
The number of emergencies have increased over the years with the growth in urbanization. This pattern has overwhelmed the emergency services with limited resources and demands the optimization of response processes. It is partly due to traditional ‘reactive’ approach of emergency services to collect data about incidents, where a source initiates a call to the emergency number (e.g., 911 in U.S.), delaying and limiting the potentially optimal response. Crowdsourcing platforms such as Waze provides an opportunity to develop a rapid, ‘proactive’ approach to collect data about incidents through crowd-generated observational reports. However, the reliability of reporting sources and spatio-temporal uncertainty of the reported incidents challenge the design of such a proactive approach. Thus, this paper presents a novel method for emergency incident detection using noisy crowdsourced Waze data. We propose a principled computational framework based on Bayesian theory to model the uncertainty in the reliability of crowd-generated reports and their integration across space and time to detect incidents. Extensive experiments using data collected from Waze and the official reported incidents in Nashville, Tenessee in the U.S. show our method can outperform strong baselines for both F1-score and AUC. The application of this work provides an extensible framework to incorporate different noisy data sources for proactive incident detection to improve and optimize emergency response operations in our communities.
Index Terms:
Emergency Informatics, Bayesian Theory, Information Fusion, User-generated Content, UncertaintyI Introduction
Emergency response to incidents such as road accidents is one of the most pressing problems faced by communities across the globe [1]. Given the growing urbanization, this problem is further exaggerated and constrains the limited resources of emergency management agencies. For example, the high dependence on emergency communication lines limits and delays the ability to timely collect data about incidents, especially during disasters. At such times, the damage to centralized emergency operations centers and communication lines often make the collection of information hard and therefore crowdsourced reports, even though sporadic and possibly false, become an important tool (e.g., Hurricane Harvey in 2017 111http://wapo.st/2iAZhbc?tid=ss_tw&utm_term=.fdd1e12b125a).
There are a number of commercial crowdsourcing platforms. User-generated content on these platforms often provide near real-time observations of the surroundings of the source user, which can be an invaluable data source in the times of an emergency [2]. However, the inaccuracy of users (location and time of reporting) while creating observational reports about incidents creates challenges, mainly unreliability of reporting sources and the uncertainty of the reported incident information [3].
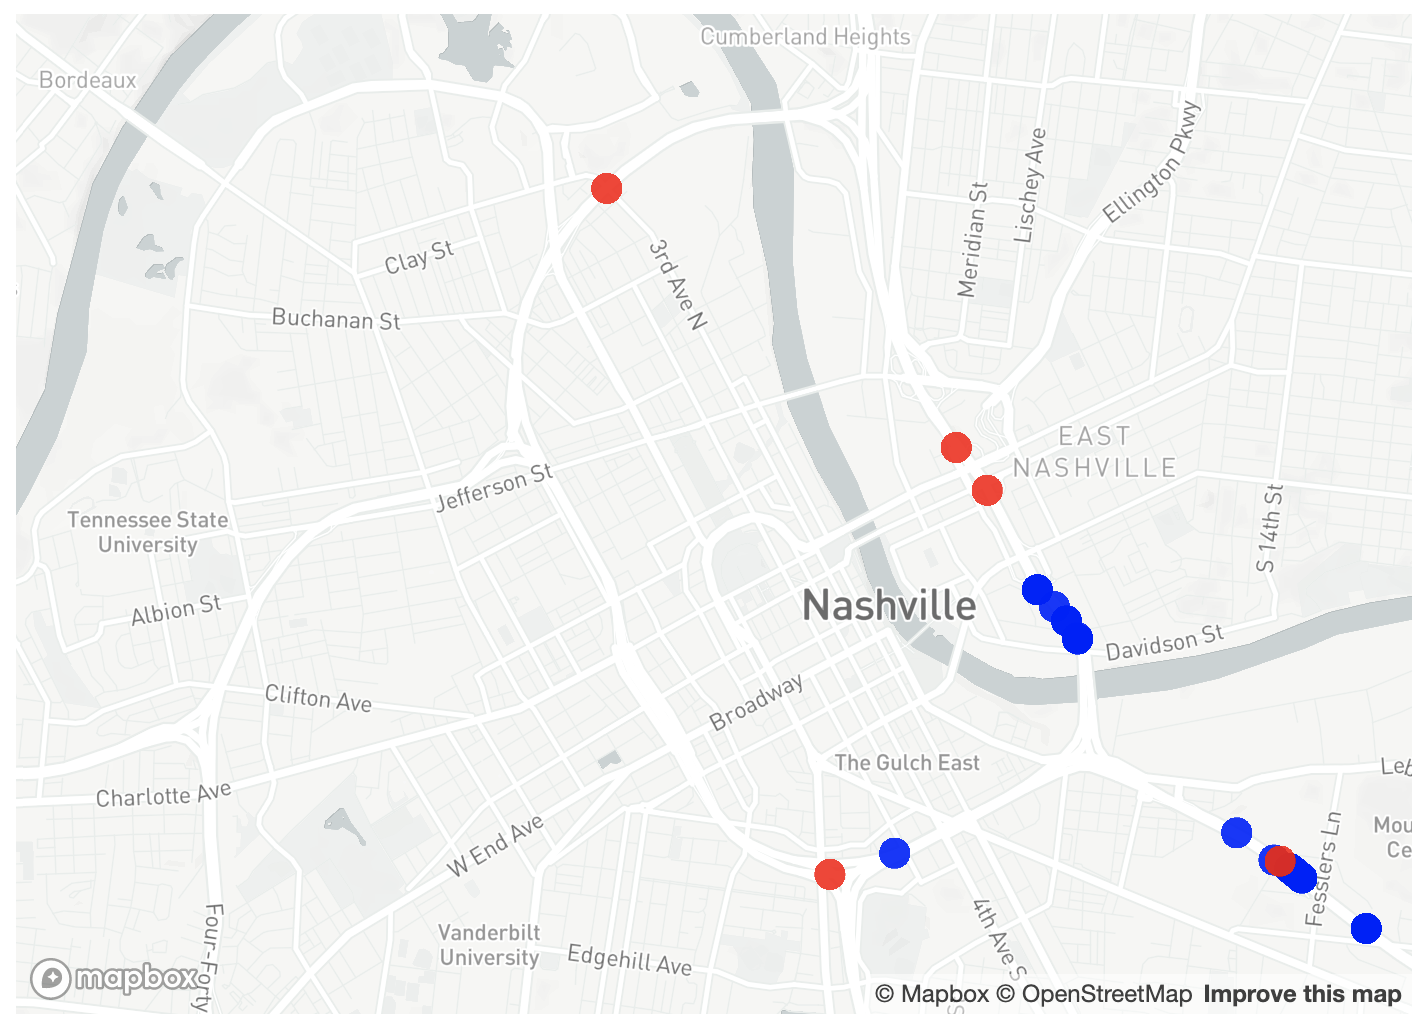
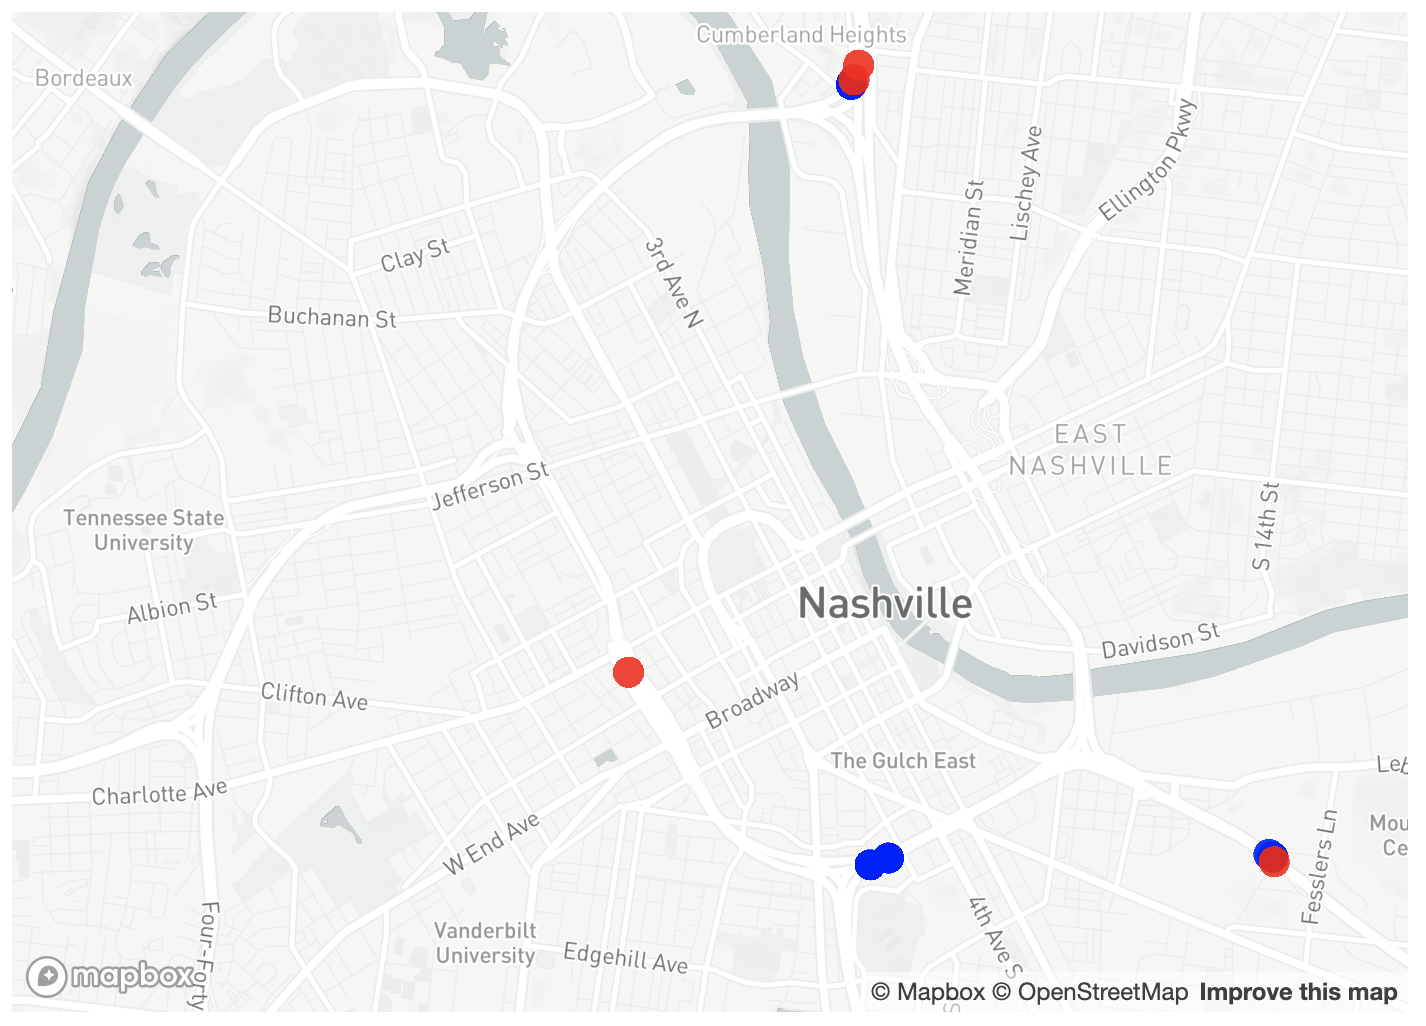
If we consider the crowd-sourced report to be a sensor reading and the actual incident requiring emergency response to be a failure, the problem of inferring an incident from a series of sensor readings (crowd-sourced reports) is similar to the classical fault diagnostics problem in cyber-physical systems [4], where the goal is to characterize the system performance using heterogeneous sensor data, and identify any faults. In this paper, we consider the transportation network as the system of interest, and Waze crowdsourcing reports from people (human sensors) as analogous to data from mechanical sensors. Some of the differences between traditional diagnostics problem and the goal of incident detection analysis include: a.) Waze reports from human sensors can be unreliable when compared to mechanical sensors, b.) The data from human sensors can be highly uncertain (e.g. location information), and c.) There is a huge variability across the several Waze reports pertaining to the same incident due to the variability in the human sensor reporting (c.f. Figure 1).
Paper Contributions: We present a novel Bayesian-theoretic method for incident detection that systematically models the uncertainty in the spatio-temporal information fusion of noisy crowdsourced reports while considering the ground-truth as conventional reports from the official local government agencies. In this paper, we analyzed Waze Reports from Nashville, Tennessee, USA and considered the incident information from the Enhanced Tennessee Roadway Information Management System (E-TRIMS) as the ground truth.
The proposed approach is novel as it uses a principled Bayesian-theoretic approach for aggregating uncertain crowdsourced data, and for estimating probabilities of occurrence of incidents. The Bayesian approach enables sequential updating of incident probabilities as new Waze reports arrive in time. Also, the quantitative evaluation of incident probabilities provide a measure of confidence of our prediction.
Paper Organization: Section II provides a review of related work. Section III provides a review of information avaialable from incident reports from Waze and E-TRIMS platforms. Section IV details the problem statement of information fusion of Waze data and describes the proposed Bayesian information fusion approach. Section V presents the experimental evaluation study that was carried out to demonstrate the proposed methodology. Section VI presents the results of the experimental case study and a comparison of the proposed method with the existing approaches, and Section VII presents the concluding remarks.
II Background and Related work
Transportation systems are the critical infrastructure of the modern cities. Therefore, significant research has been conducted to perform analytics on the transportation systems and traffic conditions using various sources of available data, including crowdsourced data. Hence, we provide a brief literature overview on the use of crowdsourced data for analyzing transportation systems. Silva et al [5] studied the breadth and spatial coverage capabilities of the Waze report information to understand the traffic conditions, and also their limitations. They concluded that the frequency of the Waze alerts is consistent with the users’ routines and traffic patterns. Sanchez et al. [6] investigated the impacts of dynamic traffic lighting by analyzing the traffic jam and traffic incident reports from Waze. The authors concluded that dynamic traffic lighting can reduce traffic congestion and improve traffic speed but has no impact on the occurrence of traffic accidents. Eriksson [7] and Santos et al. [8] integrated accident data from the official accident database and Waze to create a comprehensive accident database after removing the data that were common in both the datasets through spatio-temporal proximity analysis.
Lenkei [3] performed a comparative study of the accidents reported through Waze and the official traffic database in Sweden (Trafikverket), and concluded that there was a 43% overlap in the accident data between Waze and Trafikverket. The author provided two reasons for the increased number of Waze alerts. First, some of the Waze alerts can either be self-resolving, false alarms, or of low impact. And, second, the Waze data stream can include multiple alerts referring to the same accident. Lenkei also observed that 27.5% of the incidents in Trafikverket were detected earlier by Waze.
These studies motivate our work to explore the predictability of unconventional, noisy Waze reports to detect emergency incidents, and especially, the need for a generic, principled approach for spatio-temporal information fusion of the redundant and noisy crowdsourced reports to detect emergency incidents.
Furthermore, Flynn et al. [9] investigated the ability of Waze data to serve as a reliable indicator of police-reportable crashes through machine learning approaches. In particular, the authors considered a Random Forest (RF) model to predict a police-reportable crash (binary outcome) using a set of features based on weather, Waze Reports (median report reliability, number of records, type of Waze event, road classification), time (hour of day and day of week), and urban area classification.
In summary, we note that while there exist prior research studies on crowdsourced data for event detection and transportation incidents, there is a lack of a.) a principled approach for information fusion of noisy data to detect incidents that could be extended in general across crowdsourcing platforms because the existing approaches consider only simple aggregation methods (count/average) of surface level features without considering impacts of uncertainty associated with report integration, and b.) a comprehensive analysis of the effect of spatio-temporal resolution in the fusion process of noisy crowdsourced data.
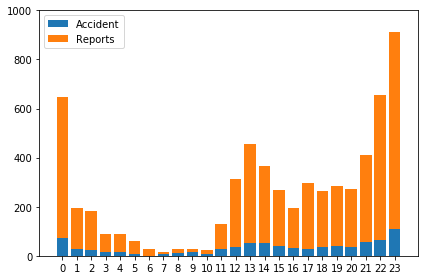
Next, we present our methodology to remedy these gaps in the prior research. First, we provide a brief overview of the Waze and E-TRIMS datasets (with similar trends, c.f. Figure 2) used in this paper to train a model for incident prediction.
III Data platforms
III-A Waze Platform
Waze is a GPS navigation application that enables its users to send reports of different traffic conditions while they are travelling [10]. In the following, we provide the descriptions of most relevant attributes of a user-generated report:
-
•
type: Type of traffic alert; this study only uses traffic alerts with type ‘ACCIDENT’.
-
•
confidence: a score for the report based on other users’ reactions to the report, between [0-10].
-
•
reportRating: The level of the reporting user credibility, between [1-6].
-
•
reliability: Indicates the reliability of the Waze report, where the reliability is based on confidence of the report and reportRating score of the user; value between [1-10].
-
•
location: Geographic coordinates (latitude, longitude) of the report origin.
-
•
pubMillis: Reporting time in milliseconds since epoch.
III-B E-TRIMS Platform
This is a single integrated system in Tennessee state of the U.S. that includes State and local roadways, structures, pavement, traffic, photo logs, and crash data. We use this data source to validate the models for incident detection. In contrast to crowdsourced data from Waze, the E-TRIMS traffic data is more reliable. An incident record in the E-TRIMS constitutes of attributes that are similar to user-generated report on Waze:
-
•
latitude: GPS Coordinate Latitude of the E-TRIMS incident record.
-
•
longitude: Longitude of the E-TRIMS incident record.
-
•
timestamp: Time the accident is recorded in the system in milliseconds since epoch.
-
•
unit_segment_id: Id of the road segment that accident has happened.
IV Problem Statement & Proposed Methodology
| Variable | Description |
|---|---|
| Total area of interest (e.g., City of Nashville) | |
| Number of non-overlapping regions is divided into | |
| region | |
| time interval after which Waze reports are aggregated | |
| time step | |
| collection of Waze reports available in | |
| Number of clusters that the Waze reports are divided into | |
| cluster | |
| collection of Waze reports available in in | |
| Number of Waze reports in | |
| Waze report in | |
| latitude value associated with | |
| longitude value associated with | |
| latitude and longitude information associated with , i.e., | |
| region covered by , i.e., the cluster | |
| Number of regions in the area covered by the cluster, | |
| reliability score associated with a Waze report | |
| probability value associated with the reliability score of a Waze report | |
| binary variable that relates to the occurrence of an incident in the cluster. and relates to the occurrence and absence of an incident respectively in the cluster | |
| Probability function | |
| Reliability associated with | |
| Probability associated with the reliability of | |
| Reaction time of a reporter between noticing an incident and reporting it on Waze | |
| Average velocity of a Waze reporter | |
| Distance traveled by a Waze reporter in the duration | |
| Area around the location of a Waze report, i.e., in which an incident may have happened | |
| Function that computes area overlap between any two areas and |
IV-A Definitions and Problem Statement
We summarize the notations used in Table I and define the key concepts as follows:
-
•
Region (): We divide the area of interest () for incident detection into hexagonal grids called regions, similar to the approach used in [11]. We use H3: Uber’s Hexagonal Hierarchical Spatial Index [12]. This enables us to choose a resolution value () and obtain grid indexes corresponding to provided geo-coordinates. Regions are the spatial unit of accident prediction in this study.
-
•
Incident Time Period (): We assume that an incident in a region will prevail for a period. We call this period an incident time period in and assume a single incident occurring in during .
-
•
Time step (): The smallest time interval at which Waze reports are aggregated () to detect an incident.
Motivating Example: Let us consider a scenario to understand the problem that is considered in this paper.
Assume that we begin collecting Waze reports at 12:00 am in the intervals of five minutes. Let there be six Waze reports in the first time step (five minutes) and four Waze reports in the second time step, and similarly, we may have one or more Waze reports in each time step. We would like to use these Waze reports to detect the existence of one or more traffic incidents, and also predict the location of the incident(s).
Given the six Waze reports in the first time step, we will need to infer if these Waze reports are associated with the same traffic incident or multiple incidents. Then, we will need to fuse multiple Waze reports associate with same incident to predict if a traffic incident did occur and also its location.
In the next time step, we have four Waze reports. Now, we will need to decide if these Waze reports are associated with the same incidents identified in the previous time step or if they correspond to new incident(s) not observed in the previous time step. After associating Waze reports to incidents, we will predict the presence of an incident and its location. The subsequent question is to decide when to alert the emergency response authorities about a traffic incident.
Problem Statement: Given a time series of crowdsourced Waze reports, we will need to answer the following questions:
-
1.
Associate available Waze reports to one or more incidents (Sections IV-C and IV-G)
-
2.
Aggregate the Waze reports associated with an incident to estimate the probability of that incident (Section IV-E)
-
3.
Predict the locations of incidents (Section IV-F)
-
4.
Determine when to alert the emergency response authorities about potential incidents (Section IV-H)
IV-B Overview of the proposed approach
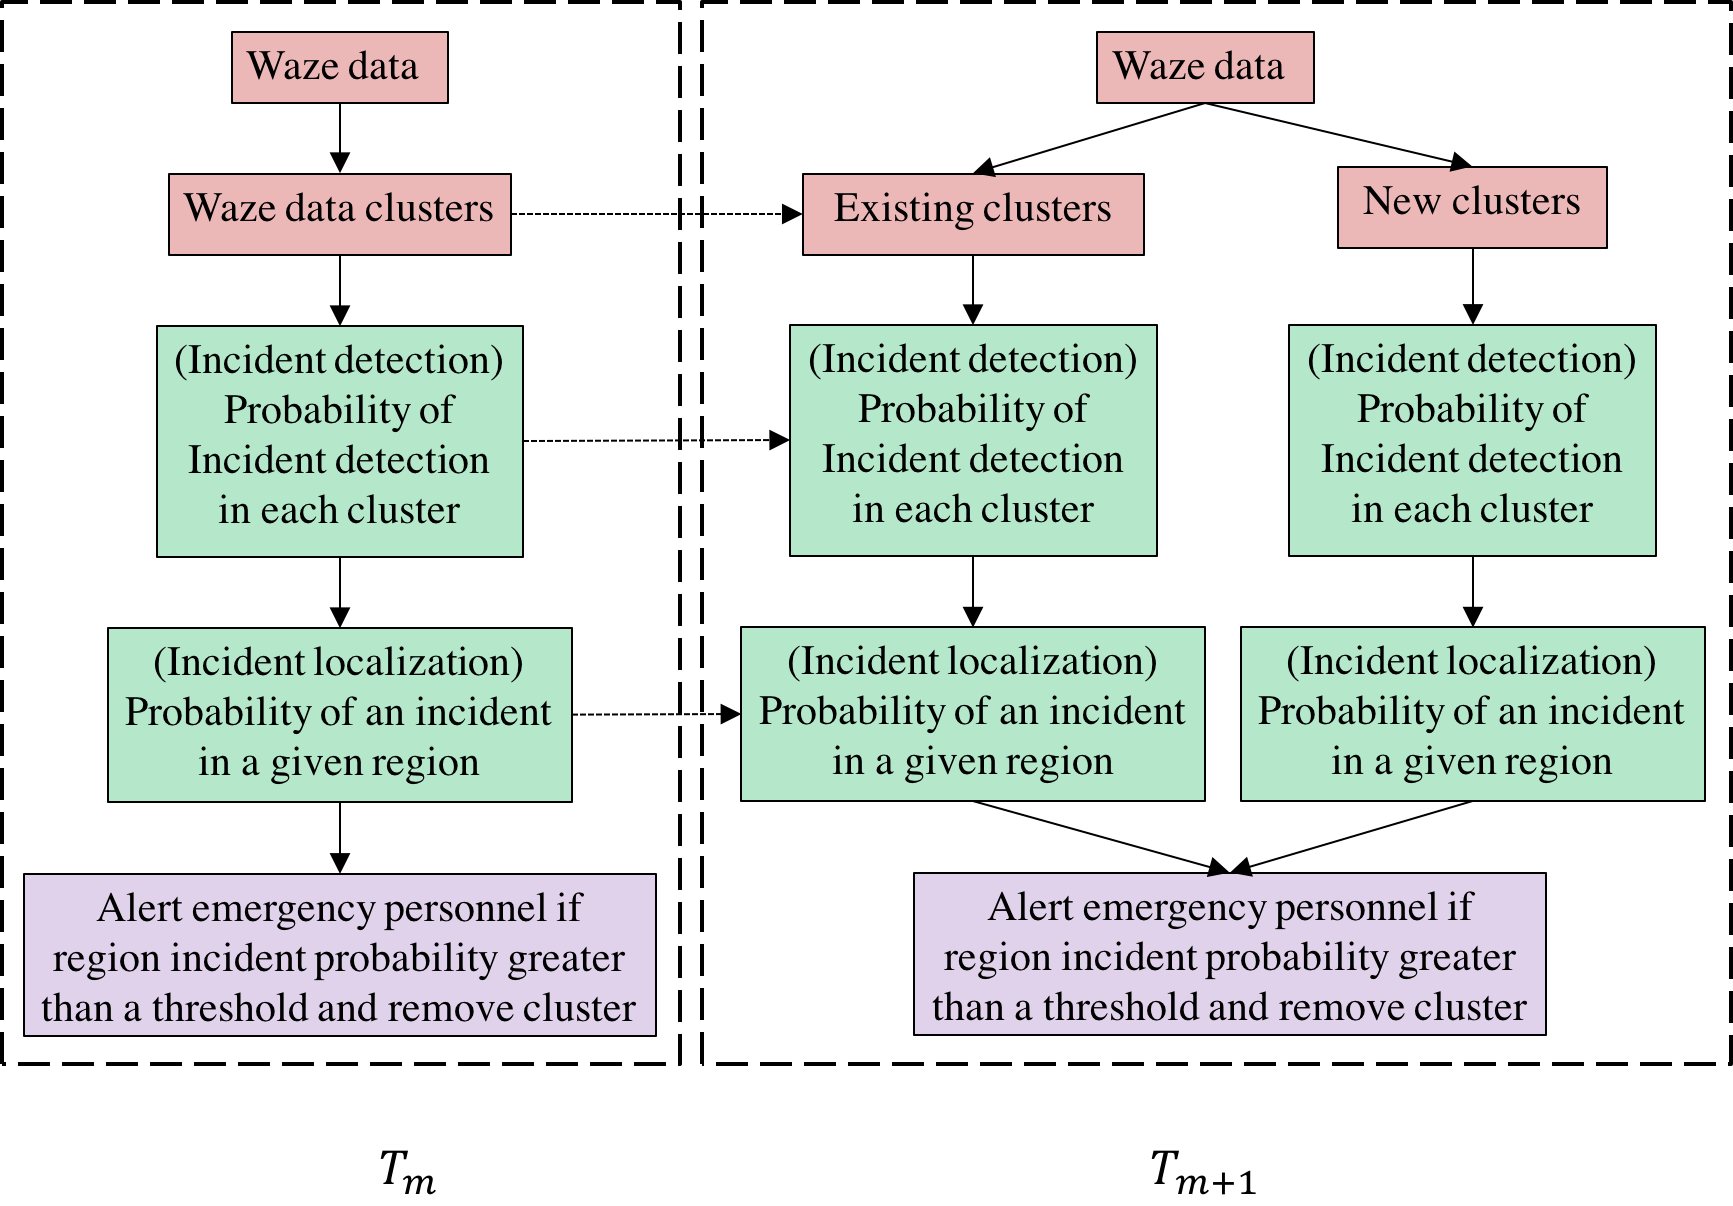
Figure 3 presents an overview of our proposed approach. Since Waze reports are available on continuum in time and space (e.g., city of interest), we implement spatio-temporal discretization and analyze the Waze reports to reduce computational expense and facilitate real-time analysis. After spatio-temporal discretization, we will implement a clustering (grouping) approach on the Waze reports to create Waze data clusters such that all the Waze reports in a cluster are talking about the same incident. The “red” boxes correspond to data gathering and clustering.
We then aggregate the incident information from various Waze reports using a Bayesian information fusion approach to calculate the probability of incident and also calculate the probability of the incident in a given region. The “green” boxes correspond to the incident detection and localization.
If the incident probability in a region was found to be greater than a threshold value, we alert the local emergency response personnel. The threshold value is learned using the Waze reports and incident information available from the local law enforcement agencies. The “purple” box represents decision-making. The threshold value is learned from data by using the E-TRIMS dataset as the ground truth dataset.
If the probability of an incident in any region is less than the threshold, we then consider Waze reports in the next available discrete time step to update the probability of an incident in a region. In this way, we perform sequential updating of incident probabilities. We will also consider a pre-determined number of time steps for updating the incident probabilities. If the incident probability is less than the threshold at the end of all the time steps, we assume an incident did not happen and “delete” the cluster. We explain each of the analysis steps with additional details below.
IV-C Spatio-Temporal Discretization and Grouping
We perform grouping of several Waze reports into discrete groups where all the reports in a given cluster are assumed to be associated with the same incident. Let represent the time step; therefore, . Let represent the set of reports that are available at . Let reprsent the clusters to which are grouped into. Let represent the set of reports in a cluster . We explore two strategies to group Waze reports that identify same incident: segmentation and density-based clustering.
Segmentation Approach: In segmentation method, at the start of incident time period , we begin to collect Waze reports when the first report appears and stop collecting until is over. The process is repeated for each region . We consider all the surrounding regions () that intersects Waze reports as the region covered by this grouping approach. Advantages of this approach include simplicity and ease of identifying the segments.
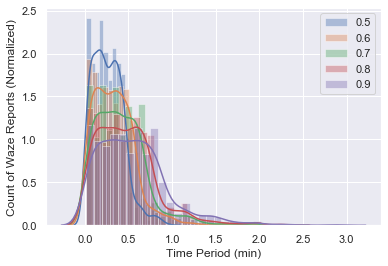
Clustering Approach: In addition to following the segmentation process, this approach uses DBSCAN [13] to identify density-based clusters of Waze reports by providing location and time information as features. We explore different values of parameter in DBSCAN ranging from 0.5 to 0.9, incriminating at 0.1, to find the best set of clusters. For , we obtained the best silhouette score of . The resulting clusters are used in our approach to detect incidents. Figure 4 provide the distribution of the cluster time period calculated using Equation 1, where indicates Waze reports belonging to a cluster . Clusters with zero are excluded in the figures for clarity.
Hereafter the term cluster () is used to denote the group of Waze reports belonging to the same incident independent of the grouping method employed, unless explicitly mentioned.
| (1) |
IV-D Data Preprocessing
In data preprocessing stage, We calculate prior probability with E-TRIMS data for each hour of the day of each region. Equation 2 illustrates how we calculate the priors for region at hour of the day. Function returns the count of E-TRIMS accident records belonging to the provided region and hour of the day from a predefined set of E-TRIMS accident records. is the number of records in predefined set of E-TRIMS accident records.
| (2) |
IV-E Incident Detection
Let represent the total area of interest for incident detection, and let be divided into non-overlapping regions, . Hence, and . These regions can be of different sizes depending on the analysis requirements.
As discussed in Section III-A, each Waze report is associated with location information, i.e., latitude and longitude values. Let represent the Waze report in the cluster at . Let represent the location of .
Let represent the regions that are covered by the Waze reports, and we assume that an incident may have occurred in any of these regions. Using available Waze reports, we calculate the probability of an incident in each region. Under the assumption that an incident occurred, this probability represents our belief of that incident in each region.
If is the reliability score (), then the associated probability measure is denoted as (). In our current approach, we divide of each Waze report by ten (max) to obtain the probability , future work can explore different mechanism to estimate it.
Let and represent the event of an incident happening in any of the regions, and the event of no incident respectively. Let and represent the prior probabilities of an incident and no incident respectively. Let represent the prior probability of an incident in region ; therefore, .
Our goal is to obtain the posterior probability of an incident happening in using the available Waze reports ; the posterior probability is denoted as , which can be decomposed into a product of two terms as . The first term, , represents the total probability that an incident happened given a set of Waze reports. Given an incident occurred, the second term, computes the probability that it occurred in region .
The probability that an incident occurred or did not occur is calculated using a Naive Bayes approach. For that, we have two classes: (1) Incident occurred (), and (2) Incident did not occur (). Using Bayes theorem, the probability of an incident occurrence can be calculated as
| (3) | ||||
In Eq. 3, represents the likelihood of observing given that an incident occurred. Assuming all the Waze reports are independent to each other, the joint likelihood of observing all the Waze reports can be calculated as the product of the likelihood of the observing individual Waze reports. Similarly, the posterior probability of the absence of an incident can be computed as . Therefore, the posterior probability of the occurrence of an incident can be calculated through the normalization, as sum of the two probabilities and should add to unity. Therefore,
| (4) |
Let represents the probability associated with the reliability of a Waze report, then the probability that a Waze report corresponds to a true incident is equal to (sometimes referred to as true positive probability). Hence, can be interpreted as the false positive probability, i.e., probability of a Waze report in the absence of an incident. Eq. 4 can be written as
| (5) | ||||
IV-F Incident localization
Typically, after a Wazer identifies an incident, it will take some time for the Wazer to report the incident. First, the user needs to process the incident, decide whether to file a Waze report, and then file a Waze report. The time it takes to perform the above three steps can vary between people; therefore, the location information does not correspond to the true location of the incident, and the incident region is in “close” vicinity to the location in a Waze report. If and are the latitude and longitude values corresponding to , then we consider an area covered by a circle with center and radius . Assume that is the average reaction time of a typical Wazer. If is the velocity of the Wazer, then the distance travelled by a Wazer is . We acknowledge that there exists a slight variation of speed limits on various roads/regions, and also variation in the velocities across individual Wazers. In this paper, we do not consider such variations, and assume a constant speed. Therefore, , and is a fixed value.
Let denote the location of a , and represents the locations of all Waze reports . The probability of observing at given the occurrence of an incident at a region can be calculated as
| (6) | ||||
In Eq. 6, is the likelihood of observing at given that an incident occurred in . is the prior conditional probability of an occurrence of an incident in given an incident occurred. As , . is the prior probability of an incident occurrence in before observing reports .
Assuming independence between the reports, is equal to . The probability that a report represents an incident in region can be the fraction area overlap between the area covered by and . If represents the area covered by , and the overlap function between any two areas and , then the likelihood, , is proportional to the area of overlap between the region covered by and written as . Thus, Eq. 6 can be written as
| (7) | ||||
Given , an incident must occur in one of the regions, ; therefore, . Through normalization, the posterior incident probability given the occurrence of an incident is:
| (8) | ||||
The posterior probability of an incident occurring in , i.e., can be calculated as a product of (Eq. 5) and (Eq. 8).
| Model Scheme | Features | Precision | Recall | F1 | AUC |
|---|---|---|---|---|---|
| [M1, Baseline] Random Forest | Avg. Reliability & Count | 31% | 78% | 44% | 64% |
| [M2, Baseline] Logistic Regression | Avg. Reliability & Count | 34% | 68% | 45% | 65% |
| [M3, Proposed] Random Forest | Plausibility (Clustering-based) | 37% | 64% | 34% | 69% |
| [M4, Proposed] Logistic Regression | Plausibility (Clustering-based) | 40% | 56% | 35% | 69% |
| [M5, Proposed] Random Forest | Plausibility (Segmentation-based) | 36% | 67% | 47% | 65% |
| [M6, Proposed] Logistic Regression | Plausibility (Segmentation-based) | 36% | 70% | 48% | 66% |
| [M7, Proposed] Random Forest | All (Clustering-based) | 30% | 70% | 37% | 71% |
| [M8, Proposed] Logistic Regression | All (Clustering-based) | 30% | 66% | 36% | 71% |
| [M9, Proposed] Random Forest | All (Segmentation-based) | 35% | 72% | 47% | 68% |
| [M10, Proposed] Logistic Regression | All (Segmentation-based) | 36% | 69% | 47% | 68% |
IV-G Waze Report - Incident Association
Section IV-C discussed grouping of Waze reports to segments (clusters) in a time step. As we consider fusing information at discrete time steps, we will have another set of Waze reports in the next step. All the Waze reports in a segment (cluster) is assumed to be associated with an incident.
Let represent the set of Waze reports in time step . Through the Waze Report - Incident Association analysis, we would like to know if a Waze report corresponds to an existing cluster .
In order to realize the above analysis, we first generate a hypothesis that a Waze report belongs to a given cluster, and then test that hypothesis. We use process identified in Section IV-C to associate Waze reports with one of the existing clusters or creating new ones.
After we assign each report to a cluster, we then repeat the analysis in Section IV-E to calculate the updated probabilities of incident detection and localization. It should be noted here the posterior probabilities obtained in the previous time step are used as prior probabilities in the current time step. This use of cluster information and probabilities across two time steps is illustrated using dotted arrows in Figure 3.
IV-H Incident Classification Model
After calculating the posterior probabilities for a potential incident associated with a region, we use the resulting probabilities as features into a classification model. In this study, we explore different types of binary classification models to identify the optimal value for the probability to create a decision boundary, specifically: Logistic Regression and Random Forest. The classification model identifies the decision boundary to determine whether a given probability value indicates an incident or not. The labels for each prediction time step was obtained by checking the presence of E-TRIMS accident record during the incident time interval associated with the prediction.
We train the classification model using balanced strategy to estimate class weights since the class labels are unbalanced in our datasets. For training classifiers, we use L-BFGS algorithm as optimizer for Logistic Regression and the maximum depth of Random Forest Classifier is set to five and three respectively. Other hyperparameters of the models are selected based on a grid search method (details in Section VI.)
V Experimental Evaluation
We use five-fold cross validation (CV) setup for evaluation to compare the performance of classification model schemes for incident detection. We used the Waze and E-TRIMS data from October 2019 to December 2019 for validating our schemes. In total there were 33218 Waze reports and 2878 E-TRIMS incident records in the dataset. We analyze the following model schemes using varied sets of features:
-
•
[M1-M2] Baselines - Avg. Reliability + Count Features: For each time step , this scheme uses the average score of reliability of Waze reports and the total count of Waze reports in that time step as features.
-
•
[M3-M4] Proposed - Plausibility (Clustering-based) Features: This scheme uses our Bayesian-theoretic approach to compute the plausibility score using posterior probabilities of an incident detection in a region. The posterior inference is based on the grouping of Waze reports obtained through clustering approach (c.f. Section IV-C). Priors for this scheme is based on E-TRIMS data from Sept., 2019.
-
•
[M5-M6] Proposed - Plausibility (Segmentation-based) Features: This scheme is similar to the previous scheme, with one difference of computing the posterior inference for plausibility scores based on the grouping of Waze reports obtained through segmentation approach (c.f. Section IV-C).
-
•
[M7-M8] All (Clustering-based) - This scheme uses all of the above features. We used clustering approach for grouping Waze reports for this strategy.
-
•
[M9-M10] All (Segmentation-based) - Similar to previous scheme, except we use segmentation approach to group Waze reports.
To evaluate the performance in 5-fold CV, we use the following metrics that are standard for classification models: Precision, Recall, F1 score, and AUC.
VI Result Analysis and Discussion
This section describes the results for both incident detection models and the impact of spatio-temporal resolution in the modeling. We also present a case study to show the benefits of using crowdsourcing to complement the conventional but slower data collection method to assist emergency response.
After performing grid search on the hyperparameters of the proposed model, we found that hyperparameter values provide the best F1 score. We used those parameters in comparing different model schemes in Section VI-A and case study in Section VI-C. Detailed performance variation of model M6 with different hyperparameter configurations is provided in Section VI-B.
VI-A Incident Detection
Table II provides the performance of the baselines and proposed methods, where the key observations are the following.
-
•
It is evident that the overall performance of the proposed modeling schemes is better than the baseline approaches in general, based on F1 score and AUC. Moreover, we observe that the results with logistic regression based schemes outperform others.
-
•
The performance of baseline classifier with Avg. Reliability and number of Waze reports as features has better recall () with Random Forest Classifier, however, low precision. Consequently, the F1 score of the baseline classifier is less than the proposed approaches.
-
•
The clustering approach provided better precision at the cost of recall thereby reducing overall F1 score for schemes M3 & M4. It is likely due to dense but accurate clusters that resulted in better precision.
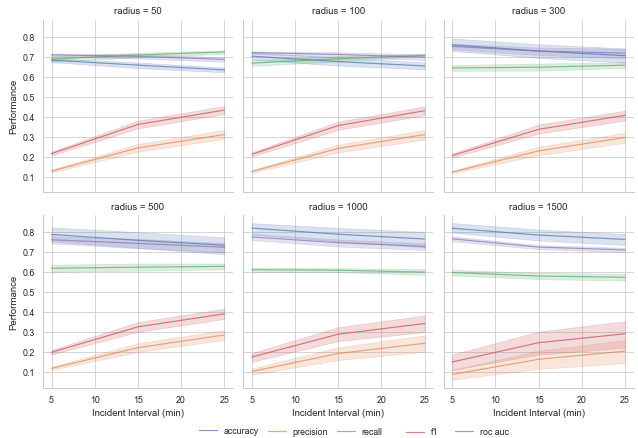
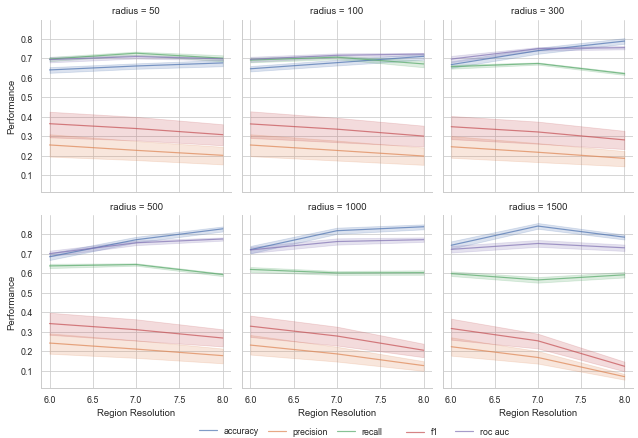
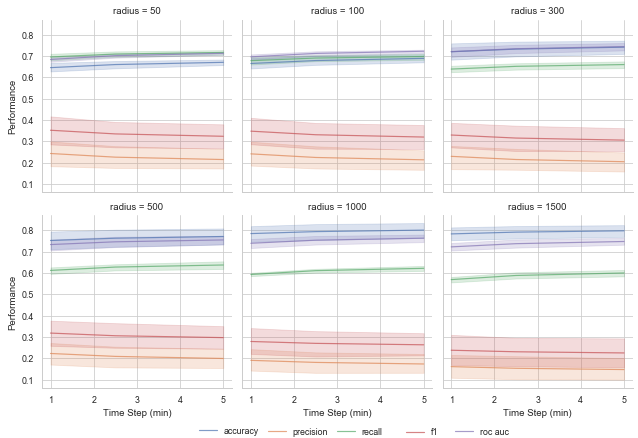
VI-B Spatio-Temporal Resolution Analysis
Figures 5, 6, and 7 illustrate the variation of different performance scores with respect to four Spatio-Temporal parameters in our model. Figure 6 shows that there is a need to optimize the spatial bound on the unit of analysis for the plausibility score computation for spatial units. Figure 5 reveals that there has been a slight increase in F1 score with increasing incident interval. It is possible that when the incident interval increases there is longer time period to consider it as an accident.
VI-C Case Study
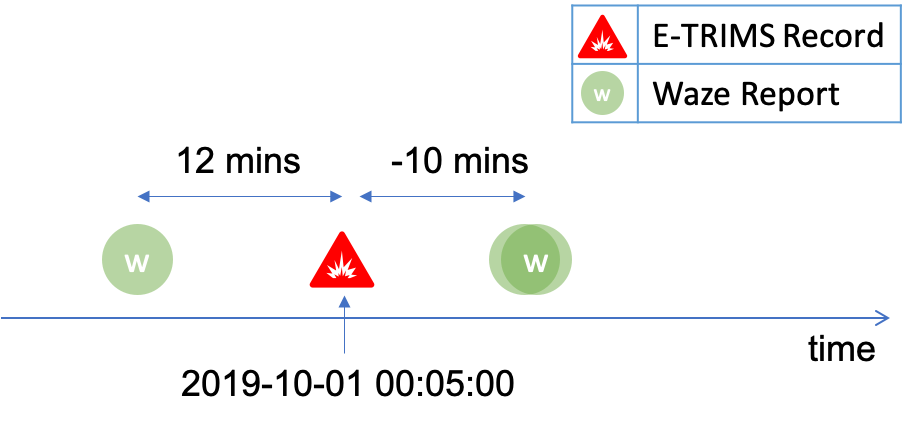
This case study presents the benefits of using our approach for early detection of incidents. To exemplify, consider the incident that happened at on (c.f. Figure 8). Using our approach, the Waze reports 12 minutes before the E-TRIMS accident record can detect the plausibility of an incident in that region. We collected the time differences between the Waze reports that led to correct accident detection and the corresponding E-TRIMS records. We then averaged the detection times to get an average accident prediction time. Any prediction that comes before the official record from E-TRIMS is considered to have a positive prediction time and a prediction that comes afterwards is considered to have a negative prediction time. We found that the average accident prediction time of our best model (Model Scheme - M6) is . This evidence suggests our approach can help build predictive systems for incident detection using unconventional crowdsourced data, before a conventional system.
VII Conclusion
This paper presents a principled methodology based on Bayesian theory to address key challenges of modeling the uncertainty and unreliability of crowd-generated reports in their integration across space and time, to detect emergency incidents earlier than the official reporting mechanisms. Our experiments using Waze data and official reported incidents in Nashville region validate our method with relative gain in F1-score over 5% against baselines. The application of this research can help emergency response operations in systematically incorporating unconventional crowdsourcing data.
Limitations and Future Work. We note the limitation in accurately matching crowdsourced data with the formal incident reports, given the human errors and systematic delays in emergency communication. We can build upon this study to explore automated feature extraction and fusion models to improve the performance, and also, improve the fidelity of the analysis (by moving from regional grids to road segments).
Reproducibility. The code for experiments is available at https://github.com/ysenarath/emergency-incident-detection-web-intelligence-2020.
Acknowledgement. We thank the U.S. National Science Foundation grants (1814958 and 1815459) and a grant from Tennessee Department of Transportation (T-DOT) for partial research support. We also thank Mr Said El Said from T-DOT, Dr. Ayan Mukhopadhyay and Dr. Sayyed Vazirizade from Vanderbilt University for data support and providing feedback.
References
- [1] A. Mukhopadhyay, G. Pettet, S. Vazirizade, Y. Vorobeychik, M. Kochenderfer, and A. Dubey, “A review of emergency incident prediction, resource allocation and dispatch models,” arXiv preprint arXiv:2006.04200, 2020.
- [2] M. Amin-Naseri, P. Chakraborty, A. Sharma, S. B. Gilbert, and M. Hong, “Evaluating the reliability, coverage, and added value of crowdsourced traffic incident reports from waze,” Transportation research record, vol. 2672, no. 43, pp. 34–43, 2018.
- [3] Z. Lenkei, “Crowdsourced traffic information in traffic management: Evaluation of traffic information from waze,” 2018.
- [4] S. Abdelwahed, A. Dubey, G. Karsai, and N. Mahadevan, “Model-based tools and techniques for real-time system and software health management,” Machine Learning and Knowledge Discovery for Engineering Systems Health Management, vol. 285, 2011.
- [5] T. H. Silva, P. O. V. De Melo, A. C. Viana, J. M. Almeida, J. Salles, and A. A. Loureiro, “Traffic condition is more than colored lines on a map: characterization of waze alerts,” in International Conference on Social Informatics. Springer, 2013, pp. 309–318.
- [6] R. Sanchez, D. Martinez, O. A. Mitnik, P. Yanez-Pagans, M. L. Lanzalot, R. Stucchi, and L. Sanguino, “Dynamic traffic lights and urban mobility: An application of waze data to the city of medellın,” 2019.
- [7] I. Eriksson, “Towards integrating crowdsourced and official traffic data: A study on the integration of data from waze in traffic management in stockholm, sweden,” 2019.
- [8] S. R. dos Santos, C. A. Davis Jr, and R. Smarzaro, “Analyzing traffic accidents based on the integration of official and crowdsourced data,” Journal of Information and Data Management, vol. 8, no. 1, pp. 67–67, 2017.
- [9] D. F. Flynn, M. M. Gilmore, E. A. Sudderth et al., “Estimating traffic crash counts using crowdsourced data: Pilot analysis of 2017 waze data and police accident reports in maryland,” John A. Volpe National Transportation Systems Center (US), Tech. Rep., 2018.
- [10] Waze, “Driving Directions, Traffic Reports & Carpool Rideshares by Waze.” [Online]. Available: https://www.waze.com/
- [11] A. Mukhopadhyay, G. Pettet, C. Samal, A. Dubey, and Y. Vorobeychik, “An online decision-theoretic pipeline for responder dispatch,” in Proceedings of the 10th ACM/IEEE International Conference on Cyber-Physical Systems, 2019, pp. 185–196.
- [12] Uber, “H3: Uber’s hexagonal hierarchical spatial index,” Aug. 2020, publisher: Uber. [Online]. Available: https://h3geo.org/docs
- [13] M. Ester, H.-P. Kriegel, J. Sander, X. Xu et al., “A density-based algorithm for discovering clusters in large spatial databases with noise,” in KDD, vol. 96, no. 34, 1996, pp. 226–231.