Molecular Communication Theoretical Modeling and Analysis of SARS-CoV2 Transmission
in Human Respiratory System
Abstract
Severe Acute Respiratory Syndrome-CoronaVirus 2 (SARS-CoV2) caused the ongoing pandemic. This pandemic devastated the world by killing more than a million people, as of October 2020. It is imperative to understand the transmission dynamics of SARS-CoV2 so that novel and interdisciplinary prevention, diagnostic, and therapeutic techniques could be developed. In this work, we model and analyze the transmission of SARS-CoV2 through the human respiratory tract from a molecular communication perspective. We consider that virus diffusion occurs in the mucus layer so that the shape of the tract does not have a significant effect on the transmission. Hence, this model reduces the inherent complexity of the human respiratory system. We further provide the impulse response of SARS-CoV2-ACE2 receptor binding event to determine the proportion of the virus population reaching different regions of the respiratory tract. Our findings confirm the results in the experimental literature on higher mucus flow rate causing virus migration to the lower respiratory tract. These results are especially important to understand the effect of SARS-CoV2 on the different human populations at different ages who have different mucus flow rates and ACE2 receptor concentrations in the different regions of the respiratory tract.
Index Terms:
SARS-CoV2, Molecular Communication, 2019-n-CovI Introduction
Information and communication technology (ICT) framework provides a novel perspective to and understand and fight human diseases [1, 2, 3, 4]. In this respect, molecular communication could pave the way for a solution to develop therapeutic and diagnostic platforms. Recent Severe Acute Respiratory Syndrome-CoronaVirus 2 (SARS-CoV2) pandemic have resulted in a significant number of deaths and adversely affected the whole humankind. Furthermore, an effective vaccine has not yet been developed. Molecular communication abstraction and characterization of the propagation of infectious diseases can provide new insight about these diseases exemplified by the viral infectious COVID-19 disease.
Recent research focused on the channel characterization of the virus infection and the transport of virus particles through aerosol transmission channel [5, 6]. In [5], the authors model Dengue virus transmission inside the body from its entrance to the host to the transmission to affected organs. The channel considered, which is from skin to the receiver organs, is characterized in terms of noise sources and path loss. Aerosol transmission, in which droplets carry virus, is the another means of virus transport mechanism. In [6], the authors determine the aerosol channel impulse response and find the response of their system for the sources such as breathing, coughing and sneezing. On the other hand, a study considering the SARS-CoV2 transmission process through the human respiratory tract from molecular communication perspective is yet to be studied in the literature.
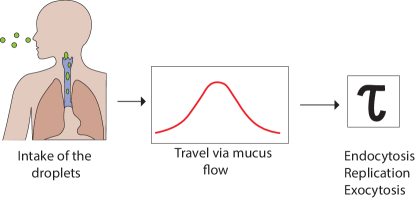
SARS-CoV2 enters the host human through the nose, mouth and eyes. We consider the case that droplets carrying viruses enter the host human from the nose. Viruses travel via mucus flow in the respiratory tract and reach host cells as illustrated in Fig. 1. SARS-CoV2 virus binds a special receptor on the host cell called angiotensin-converting enzyme or ACE2, with a rate, . Binding is followed by a time delay, , which is due to the mechanisms needed for virus replication. In this study, we consider this system and accordingly develop a model for the human respiratory tract by separating the respiratory tract into seven segments. Our aim is to determine the impulse response of the SARS-CoV2-ACE2 binding process to investigate the probability distribution of binding locations. The binding location distribution, which depends on several system parameters including ACE2 density and mucus flow rate offers vital information on the course of disease.
Our contributions can be summarized as follows:
-
•
Proposing a novel model of human respiratory tract that reduces complexities of the original system: We model human respiratory tract by partitioning the tract into seven segments from nasal cavity to alveoli.
-
•
Calculating ACE2 receptor densities in the different regions of the respiratory tract: Based on the available data on surface parameters, we calculate ACE2 receptor density crudely.
-
•
Determining impulse response of SARS-CoV2 infection process for the first time in literature: We develop an impulse response for the propagation of SARS-CoV2 viruses in the respiratory tract, which is instrumental in further investigation of factor effecting disease progression.
-
•
Investigating the effects of mucus layer thickness, mucus flow rate and ACE2 density on the virus population reaching the different regions of the respiratory tract and disease progression: Our results show that mucus flow rate and ACE2 densities drastically affect the regions of respiratory tract where viruses reach.
The rest of the paper is organized as follows. In Section II, we provide a brief background about SARS-CoV2. In Section III, the developed system model is outlined. In Section IV, the diffusion model for viruses diffusing through the mucus layer is derived. Next, in Section V, the impulse response of the system for different receptor and virus concentration is determined. In Section VI, Markov Chain model of the events following the binding process are stated. In Section VII, the simulation results are presented. Finally, conclusions are stated in Section VIII.
II Background
Severe Acute Respiratory Syndrome - CoronaVirus 2 (SARS-CoV2), also named novel-coronavirus (2019-n-Cov), has been identified as the causative infectious agent of coronavirus disease-19 (Covid-19), responsible for the current pandemic. Covid-19 has turned from a local pneumonia outbreak, which originated in Wuhan, China in December 2019, into a global pandemic in a matter of months, which has as of now, October 2020, caused more than a million deaths worldwide and spread to more than 200 countries [7]. Belonging to the family of coronaviruses, SARS-CoV2 is the third and the newest coronavirus in the family to cause an epidemic, just as SARS-CoV in 2003 and MERS-CoV in 2012, and the only one to cause a pandemic. SARS-CoV2 is reported to be a zoonotic viral disease. Bats, snakes, and pangolins have been cited as potential reservoirs based on genome sequencing studies [8, 9, 10].
II-A Clinical Presentation
Although it predominantly causes pneumonia and associated comorbidities, Covid-19 is considered to be a syndrome, given that it affects multiple different organs and systems within the human body. Typical clinical symptoms of the patients include fever, dry cough, difficulty of breathing (dyspnea), fatigue, joint pain (arthralgia), muscle pain (myalgia), and loss of sense of smell (anosmia) [11, 12, 13]. The presence of high variety of pathological events are attributed to different pathophysiological mechanisms involved in SARS-CoV2 and proves that it is more than a respiratory syndrome.
II-B Transmission Route
Current epidemiological data suggests that SARS-CoV2 is an airborne viral disease, meaning that it is transmitted through respiratory droplets and droplet nuclei, which are mostly spread during human-to-human contact [14, 15, 16]. Respiratory droplets (m in diameter) and droplet nuclei (aerosols) (m in diameter ), are generated and expelled/disseminated from an infected person during speaking, shouting, coughing, or sneezing [17]. Indirect surface transmission, i.e., fomite transmission, and orofecal transmission have also been reported [18, 19, 20]. Some studies have detected stable SARS-CoV2 viral RNA on solid surfaces such as plastic, aluminum, and stainless steel, yet the significance of fomite transmission is still debated with contradicting views [18, 19].
The main pathway of SARS-CoV2 inside the human host is reported to be the respiratory tract. Mucosal openings such as the nose, eyes, or mouth have been identified as the principal sites, where the initial viral entry takes place [21]. Although there are numerous possibilities for viral entry, one pathway a virus particle could take on the macroscopic level is as follows. A virus laden particle enters through the nasal cavity, with the help of the downstream flow of mucosal secretions and gravity, it travels down through the pharynx, larynx, and trachea, enters a bronchi, passes down to bronchioles and finally reaches alveoli. On a microscopic level, once the virus laden droplets reach mucosal membranes, they diffuse through the mucosa (consisting of mucus, periciliary layer, and mid-layer) and attach to certain membrane receptors on host cell surfaces, the most prominent one being ACE2, which has been identified as the primary functional receptor for SARS-CoV2, just as for SARS-CoV [22, 23, 24, 25].
The current knowledge on SARS-CoV2 infection indicates that the elderly are more susceptible and vulnerable to the infection, while children seem to be the least affected group. Numerous studies report lower rates of SARS-COV2 infection with milder symptoms in children compared to adults [26, 27, 28]. Some studies attribute these results to their findings that ACE2 expression in children is lower than that of adults. [29, 30, 31]. Other possible reasons held responsible for lower rates of morbidity and mortality from SARS-COV2 in children include: the differences in immune responses between children and adults, differences in ACE2 receptor distribution patterns, and lower rates of testing in children due to abundance of asymptomatic cases [32].
II-C Viral Structure and Viral Binding
The morphological structure of the virus comes to prominence when discussing viral binding processes. SARS-CoV2 is an enveloped, positive-sense, single-stranded RNA virus and similar to its prior relatives SARS-CoV and MERS-CoV, it belongs to Betacoronavirus genus of the coronavirinae family. SARS-CoV2 viral genome contains four major structural proteins: the S (spike) protein, the M (membrane) protein, the N (nucleocapsid) protein, and the E (envelope) protein [33]. The S protein has a trimeric structure, consisting of an S1 receptor binding subunit and an S2 fusion subunit. During viral infection, S1 and S2 subunits are cleaved by a metalloprotease, TMPRSS-2 (transmembrane protease serine 2), which facilitates viral entry. The S1 subunit functions as the part, which directly binds to the host cell receptor, i.e., ACE2 receptor, creating a Receptor Binding Domain (RBD). The S2 subunit takes role in membrane fusion [34].
Following viral binding, there are two possible pathways of viral entry for enveloped viruses into host cells: either cytoplasmic fusion in which their envelope fuses with plasma membrane and they release their genome into cytosol, or endosomal membrane fusion (endocytosis) in which they are engulfed by an endosome, and their membrane is fused with the endosomal membrane [35, 36]. There are multiple mechanisms of endocytic entry suggested by various studies, involving clathrin dependent, caveolae dependent endocytosis [37, 38], and clathrin independent, caveolae independent endocytosis [39, 40].
III System Model
In Section II, we present physio-morphological structure and behavior of the virus, regarding its entry mechanisms into human body and target cells. Here, we present our system model.
We assume that the virus carrying aerosol particles enter the human host through the nose, and diffuse through the mucus layer in the nasal cavity, where ACE2 receptors are found most abundantly [41]. The diffusion of the virus takes place in the mucus layer, which renders the shape of the respiratory tract insignificant. Given the fact that the mucus layer is continuous within the respiratory tract [42], we assume a cylindrical tube with radius and length . The change in the radius throughout the tract has limited effect, unless it also modulates the properties of mucus, especially the mucus thickness.
We know that the penetration of the virus containing droplets depend on the size of the droplet, with smaller droplets being able to penetrate further into the respiratory tract[43]. Without loss of generality, we assume that the droplets are caught in the entrance of the respiratory tract by the mucus layer due to the lack of information on the droplet size.
For a large portion of the respiratory tract, mucus layer covers the periciliary layer and a thin surfactant layer separates the two [44]. In our work, we assume that the surfactant layer reduces the surface tension between these two layers to a negligible value, and consequently ignored. Furthermore, we assume that the diffusion coefficient, , of the virus in periciliary and mucus layers to be the same. In a healthy respiratory system, the mucus inflow to the alveoli is countered by the mucus outflow due to the periciliary layer. We ignored the mucus outflow mechanism as it may turn the mucus flow into a very complex turbulent fluid model. In other words, we treat it as if it is one single layer.
The existing works studying ACE2 distribution and mucus flow do not comment on differentiations within a region, i.e., ACE2 are homogeneously distributed. Hence, our model assumes cylindrical symmetry.
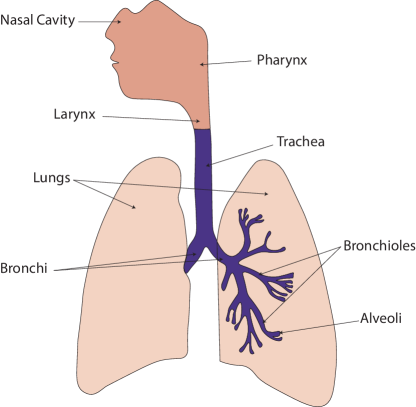
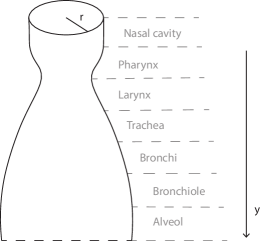
The virus moves under the influence of the mucus flow from nasal cavity to the alveoli[43, 45]. We partition the respiratory system into seven parts, namely Nasal Cavity, Larynx, Pharynx, Trachea, Bronchi, Bronchiole and Alveoli. Our model is presented in Fig. 2. Because of the complicated structure of the bronchial tree, we assign transition regions to the closest region. Following bronchi, the respiratory tract branches out 22 more times. Due to this continuous branching in the lungs, we assign the sections where oxygen exchange occurs to alveoli and sections where no oxygen exchange occurs to bronchiole, meaning first 18 branches are assigned to bronchiole and last four to alveoli.[46] Furthermore, since after each branching, the individual branches become narrower but more numerous, we used the surface area, , of each of the seven regions, , to calculate its corresponding radii values, as
| (1) |
where is the length of the region. The resultant the respiratory tract, obtained by stacking cylinders, each with the radius and height of its corresponding segment, is shown in Fig. 3. Note that Fig. 3 is not to scale, as the corresponding radii for alveol region is two orders larger than the next region, i.e., bronchiole region. Due to the cylindrical symmetry assumption, we can make a longitudinal cut through any point on the model and unwrap the respiratory tract.
Upon entering the mucus and periciliary layer, viruses use their viral S-spike proteins to bind to ACE2 receptors on host cell surfaces [47]. We will use the binding rate, , to describe the binding process. Due to the spherical shape of the coronavirus, we safely ignore the effect of the orientation of the virus at the time when it makes contact with the ACE2 receptor.
As viruses bind to ACE2 receptors on the host cell’s membrane surface, ACE2 receptors are downregulated. Therefore, the number of surface receptors decreases [48, 49], making it less likely for other viruses to bind.
We consider two scenarios depending on the ACE2 receptor concentration and the virus population:
-
•
Large virus and large receptor concentration: The number of viruses and ACE2 receptors are the same at the locations and .
-
•
Only large virus concentration: The viruses dominate ACE2 receptors, i.e., all ACE2 receptors are bound to a virus and concurrently downregulated.
Following the ACE2 – virus binding, endocytosis process occurs. We assume a constant endocytosis rate, . As a result, our system model do not include the effects of caveolae and clathrin dependencies due to the lack of quantitative data. Once inside the cell, the virus releases its RNA and undergoes replication. The virus or its RNA may degrade before during and after replication, blocking the exocytosis and ending the infection of the cell.
IV Viral Diffusion Model in the Respiratory Tract
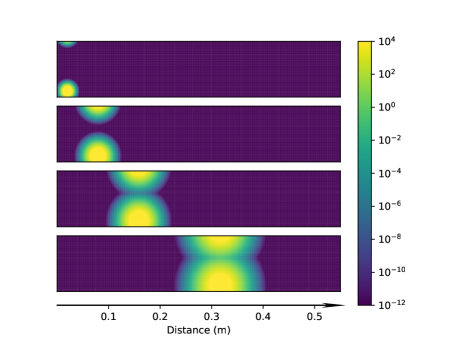
As stated in Section III we assume a constant mucus flow rate, from the nasal cavity to pharynx, larynx, trachea, bronchi, bronchiole and finally to the alveoli. Furthermore, the viruses also diffuse with a diffusion coefficient, , in the mucus layer. The virus concentration is derived using Brownian Motion with drift. We assign axis for the distance from the entrance of nasal cavity, axis for the distance from a longitudinal cutting point and axis as the depth in the mucus layer. Due to the assumption of cylindrical symmetry, the reference point for coordinate is arbitrary. If a droplet containing viruses is incident to the mucus level at the location , the virus concentration at time is
| (2) | ||||
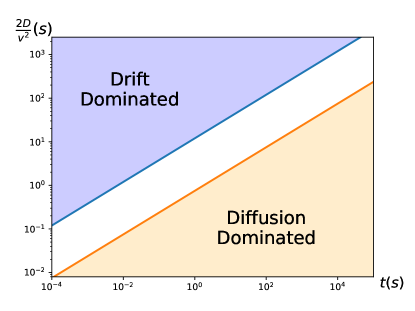
The standard deviation for Brownian motion is given as . Therefore, of the population of viruses falls into a sphere of radius , centred at , while into a sphere with the same centre and radius of . Hence, for , drift dominates the diffusion and diffusion along the y-axis can be ignored. Similarly, for , drift is dwarfed by diffusion and can be ignored. Fig. 4 shows the dominating trends for Brownian Motion with drift. For [50] and [51, 52, 53], the diffusion of the virus in the respiratory tract is shown in Fig. 5. Clearly, the effects of the diffusion is only visible for large .
| Variable | Symbol |
|---|---|
| Concentration | |
| Concentration due to a single virus | |
| ACE2–Virus Binding Rate | |
| Distance from the start of the tract | |
| Initial number of viruses | |
| Virus concentration | |
| Tract radius | |
| Height of mucus | |
| Mucus flow rate | |
| Avogadro’s Constant | |
| Binding probability to a single ACE2 | |
| Not binding probability to a single ACE2 | |
| Evade probability in the segment | |
| ACE2 concentration | |
| ACE2 count | |
| Number of viruses at | |
| Probability of reaching | |
| Binding rate at | |
| Virus distribution | |
| Unbinded (free) viruses | |
| Expected number of bindings |
V Impulse Response of Virus-ACE2 Binding
The ACE2-Virus binding can be modelled by obtaining the virus population distribution over the respiratory tract. To achieve this, we start with modelling the kinematics of a single virus incident on the mucus layer. Later, we use our findings as stepping stones to reach impulse response for different scenarios as described in Section III.
V-A Kinematics of Single Virus Case
We begin our analysis by considering a single virus is moving under the influence of mucus flow. The mucus layer has a thickness of and a velocity of , while the respiratory tract radius is , where lies in the direction of the respiratory tract from nose to lungs. Then, at any segment , the concentration of the virus due to a single virus is given by
| (3) |
The time that the virus spends in a segment of length is
| (4) |
The probability that it binds to a single ACE2 receptor in the segment with length becomes
| (5) | ||||
| (6) | ||||
| (7) | ||||
| (8) |
where is the molar association constant, is the Avogadro’s constant and is the association constant for a single virus. Note that in the last step, we used first order Taylor series expansion, i.e., for small .
Then, , the probability of not binding during is
| (9) | ||||
| (10) |
If the ACE2 concentration per unit area at is , then number of ACE2 receptors, , in the patch of length becomes
| (11) |
and the probability of the virus evading all ACE2 receptors in the same patch, , is expressed as
| (12) | ||||
| (13) | ||||
| (14) | ||||
| (15) |
where from (13) to (14) we use the first order truncation of the binomial expansion, i.e., for , which holds due to being much larger than any other value in (14). This assumption is especially effective for .
From (15), we reach the rate of binding in the patch of length as
| (16) | ||||
| (17) |
Then, we find to the number of viruses at , using an initial value problem with rate
| (18) | ||||
| (19) | ||||
| (20) | ||||
| (21) |
where we used the fact that by definition.
An important observation is that obtained in (21) does not necessarily normalise. Defining as
| (22) |
where is the total length of the respiratory tract, gives us the rate of the viruses that reach the end of the respiratory tract, i.e., alveoli. Here, since the viruses cannot travel neither forward nor backward, we assume that they will eventually bind to an ACE2 in alveoli.
V-B Modelling of ACE2-Virus Binding
So far, we only assumed the existence of a single virus to reach (21). As stated in Section III, there are several scenarios depending on
-
•
, the total number of viruses number on a thick strip,
-
•
, total number of ACE2 receptors in the same strip,
-
•
, the expected number of virus bindings in the same strip.
is loosely calculated by replacing with and carrying out (3) to (15). Hence, (3) becomes
| (23) |
and replacing with ,
| (24) | ||||
| (25) |
where does not depend on ACE2–virus bindings.
Since each ACE2–virus binding destroys both a virus and a receptor, both the virus and the receptor concentrations are affected. Hence, our model must incorporate variations in the concentrations. Each binding causes the number of viruses, and number of receptors to change as
| (26) | ||||
| (27) |
-
1.
Large : If is large and , the total virus concentration remains constant within the same segment.
-
2.
Large : If is large and , the total ACE2 concentration remains constant within the same segment.
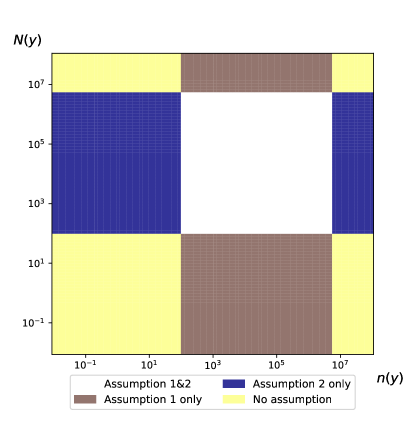
Since is quite low, i.e., on the order of , for some cases, both of these assumptions hold. Fig. 6 illustrates under which conditions these assumptions hold.
As Fig. 6 shows, when both and are large, the assumptions may not hold. Since depends on and , the boundaries may change.
Note that changes in causes a change in the system. As the system parameters change with the input, the system is no longer linear time-invariant. As a result, obtaining the impulse response when (27) does not hold is of no practical use.
V-B1 Large
For large , the virus–ACE2 bindings do not change the receptor number in the same segment. Hence, regardless of how many bindings happen in a given segment, the binding probability of any virus in the same segment is constant. As a result, (17), multiplied by gives the expected number of binding on the segment. Furthermore, (21) multiplied by the incident virus count, , gives us the virus population reaching to any location of the respiratory tract, i.e.,
| (28) |
Hence, the virus concentration is simply the derivative of (28), i.e.,
| (29) |
.
We proceed to obtain impulse response, , by adding the unbounded or free virus distribution, . The free virus population is situated at the location of the respiratory tract, due to the fact that virus movement on the respiratory tract is solely under the influence of mucus flow. The total number of free viruses is equal to the difference between the initial number of viruses and the total number of bound viruses.
| (30) |
where is the Dirac Delta function. Thus, the impulse response becomes
| (31) |
V-B2 Large only
In case , viruses outnumber the ACE2 receptors. This causes all ACE2 receptors to bind to a virus. Bound virus distribution in the respiratory tract is the same as the ACE2 receptor concentration. Note that, since bound ACE2 receptors downregulate, large only case cannot be modelled as a linear time invariant system.
| (32) |
and
| (33) |
where is the step function and is used to assured that virus distribution is limited to the region , i.e., the range of mucus flow. Free virus distribution can be calculated by finding the number of receptors in the given region.
| (34) |
| (35) | ||||
| (36) |
V-B3 No Limiting Case
In case both assumptions fail, active number of ACE2 receptors constantly changes due to the binding viruses. Therefore, no assumption can be made for this case, and neither (31) nor (34) holds. As a result, there is no closed form expression for this case.
Note that, as described in Section III, we assume that the virus containing droplets are captured by the mucus layer at the start of the respiratory tract. The penetration of the virus laden droplets into the respiratory tract can be easily taken into account by finding the convolution of the droplet penetration distribution with the impulse response obtained here.
VI Entry and Life Cycle in the Host Cell
In the host cell, the virus replicate and new virions are released out of the cell via exocytosis. We can model this process with a stationary Markov Chain with six states, namely, binding (), endocytosis (), release of viral RNA (), replication (), degradation (), exocytosis () as illustrated in Fig. 7. The bound virus, can enter the cell via endocytosis, which is mediated by ACE2 receptors. In the state-B, the virus is found bounded to the ACE2 receptor. COVID-19 is an RNA virus, i.e., virus can replicate in the cytoplasm. Thus, in the state- viral RNA is released to the cytoplasm. In the host cell, the virus can be degraded by lysosomes [54], which is represented by the state-.
The transition matrix of the Markov Chain representing the life cycle of the virus in the host cell, , is given by
| (37) |
where we set , , , and . The transition rates are provided in Table II.
| Parameter |
|---|
| - Endocytosis rate |
| - Viral RNA release rate |
| - Degradation rate |
| - Replication rate |
| - Degradation rate |
| - Degradation rate |
| - Exocytosis rate |
represents corresponding state occupancy probabilities. The relation between the states can be expressed as[55]
| (38) |
which has a solution of (38) is in the form of
| (39) |
Using eigenvalue decomposition, we can express as
| (40) |
where is an eigenvector of the matrix and the corresponding eigenvalue. As a result, we can express (39) as
| (41) |
Thus, the probability of transition from the state to the state in time is given by
| (42) |
VII Performance Evaluation
VII-A Physiological Parameters
Morphometric measurements of the respiratory tract such as length, diameter, surface area, and mucosal thickness were obtained from estimation studies, journals, databases, and anatomy literature. Given the non-uniform shape and the continuously narrowing nature of the respiratory tract, as in the tracheobronchial tree, we use median values for branching or narrowing structures. Divided into 23 generations of dichotomous sections, the tracheobronchial tree designates a generation for each divided branch starting from trachea, generation 0, and ending at alveoli, (generation 23). The first 16 generations, from generation 0 to generation 16, are defined as the conducting zone, i.e., no gas exchange takes place in this region. From generation 17 to generation 23 is called the transitional and respiratory zone, where gas is exchanged within functional units [56]. The generation 0 directly gives the dimensions for the trachea. Generations 1 to 4 are assumed to be bronchi, 5 to 16, bronchiole and 17 to 23 alveoli respectively. 111For our parameter data, we mainly use Gehr’s “Annexe A. Anatomy and Morphology of the Respiratory Tract” and Weibel’s “Morphometry of the human lung”. [46, 57].
Although there are studies investigating ACE2 receptor gene and protein expressions across different tissues and in specific cell types using single cell RNA sequencing gene expression profiling datasets, mass spectrometry and immune assay techniques, [58, 59, 60, 25], to the best of our knowledge, data on the number of ACE2 receptors on different tissues is not explicitly stated in studies. Most studies provide relative expressions of the receptor in different tissues, shown as proportions, percentages, or plots with no numeric values. Some studies address circulating ACE2 levels, which we cannot directly utilize as we need tissue-specific values. There exist some studies which report ACE2 expression data in animals, which are not compatible with our work either [61].
The primary challenge of this work is to obtain the ACE2 receptor densities in different tissues of respiratory tract. The lack of studies giving these values is mostly due to the difficulty of measuring ACE2 receptor concentration in a diverse population of all ages. To address this challenge, we exhaustively search among various literature to calculate our estimated values. The specific works that we use are referenced in Table III.
Therefore, we first gather data on the percentage of ACE2 expressing cells for the seven region model described in Section III. Then, we search for the total number of cells in each region. For tissues in which there is no sufficient quantitative data on the percentage of ACE2 expressing cells, the relative proportions of ACE2 expressions of two or more tissues, one of which we have previously calculated are used. Then, we calculate the number of ACE2 expressing cells in each tissue accordingly. Note that these preliminary calculations are the estimates based on the currently available data in the literature.
Due to the lack of data, the effect of age in SARS-CoV2 susceptibility cannot be directly analyzed. However, we investigate the effects of thicker mucus as seen more in elderly and effects of higher ACE2 concentration in nasal cavity as observed in smokers.
| Symbol | Region | Value | Units | Reference | |
| Region Length | Nasal Cavity | 11.2 | [46] | ||
| Pharynx | 14 | [46] | |||
| Larynx | 4.4 | [46] | |||
| Trachea | 12 | [46] | |||
| Bronchi | 8.7 | [46] | |||
| Bronchiole | 6.2 | [46] | |||
| Alveoli | 0.36 | [46] | |||
| Mucus Thickness | Nasal Cavity | 2500 | |||
| Pharynx | 1600 | ||||
| Larynx | 1600 | ||||
| Trachea | 200 | [46] | |||
| Bronchi | 60 | [46] | |||
| Bronchiole | 6 | [46] | |||
| Alveoli | 0.1 | ||||
| ACE2 density | Nasal Cavity | 1000 | [62] | ||
| Pharynx | 65 | [62] | |||
| Larynx | 270 | [62] | |||
| Trachea | 12 | ||||
| Bronchi | 68 | [63] | |||
| Bronchiole | 18 | [63] | |||
| Alveoli | [64, 65, 66] | ||||
| Surface Area | Nasal Cavity | 160 | [67, 68] | ||
| Pharynx | 50 | [69] | |||
| Larynx | 50 | [69] | |||
| Trachea | 70.83 | [70] | |||
| Bronchi | 40.10 | [70] | |||
| Bronchiole | 229 | [70] | |||
| Alveoli | [67] | ||||
| Mucus Flow Rate | 50 | [50] | |||
| Association Constant | |||||
VII-B Simulation Results
In this section, we first present the impulse response simulation and then continue with simulating the effect of mucus flow rate, , ACE2 receptor density, and mucus thickness, , on the virus-ACE2 binding.
VII-B1 Impulse Response of Unobstructed Viral Progression
In Section V, we find an analytic expression for the impulse response of unobstructed viral progression through the respiratory tract. Here, we confirm our analytic expression with a Monte Carlo simulation in Fig. 8.
The physiological parameters that we use in the simulations are presented in Table III.
For the Monte Carlo simulation, we divide the respiratory tract to patches. The initial number of viruses are . Each virus is independent of each other, i.e., a new number is generated using the Marsenne Twister for each virus in each segment. We see that our analytical solution is in full agreement with the Monte Carlo simulation of the system for large .
VII-B2 Mucus Flow Rate
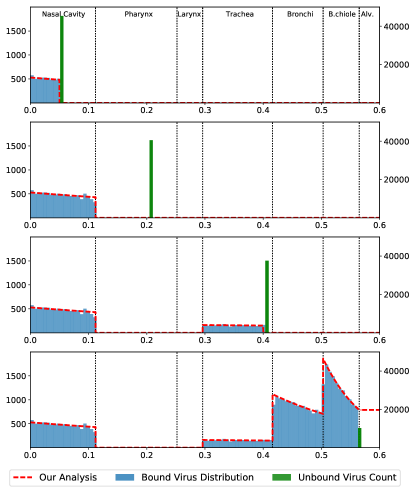
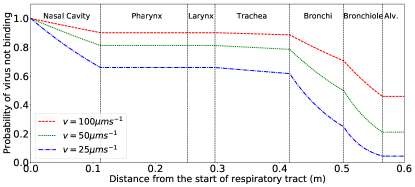
As it can be seen in Fig. 9, mucus flow rate has a significant impact on the reach of the virus population. If the patient suffers from another condition causing nasal drip or any other faster mucus flow, the virus spends less time in the upper respiratory system. Therefore, ACE2–virus bindings in the upper respiratory tract is limited, causing the bulk of the virus population to migrate to the lower parts of the respiratory tract, especially bronchioles and alveoli. The virus population in the alveoli is 20-folds more if the mucus drop rate is compared to . This causes the virus to take hold in the alveoli before an immune response can be launched.
VII-B3 Nasal ACE2 Receptor Density
Fig. 10 shows us the impact of the ACE2 receptor concentration in the nasal cavity. Assuming distribution of the ACE2 receptors in the other parts of the respiratory tract is the same for different age groups, the difference in the ACE2 levels in nasal cavity has a significant effect on the virus population reaching the lower respiratory tract. The impact of ten-fold increase in ACE2 receptor concentration is six-fold increase in virus concentration in the lower respiratory system.
VII-B4 Mucus Thickness
Our model suggests an impact of the mucus thickness. Since we assume that the virus can move freely in the mucus layer via diffusion, thicker mucus implies that there is less chance for the ACE2–virus binding. Fig. 11 shows the effect of the mucus thickness. The virus population in the alveoli is 4.45 times more in the four times thicker mucus compared to the base mucus level.
VIII Conclusion
In this work, we use molecular communication to understand the SARS-CoV-2 transmission in human respiratory system. We use a novel respiratory tract model which captures the existing information on ACE2 receptor distribution and mucus flow simultaneously without the computational complexity due to an irregular shape. Our model transforms the respiratory tract into seven consecutive cylinders with different length and radii, each of which has the same ACE2 density and mucus thickness. For the first time in the literature, we calculate the approximate ACE2 receptor densities for all these segments using the existing qualitative and quantitative researches.
Based on the analysis, we reach that higher mucus flow rate results in virus migration to the lower respiratory tract, which is compatible with the experimental results found in the literature. We also analyzed the effects of nasal ACE2 receptor density and mucus thickness. Our findings are aligned with the experimental results in the literature.
Our work will pave the way for more complicated models to analyze the infection mechanisms, especially in terms of viral load necessary for infection, of airborne viruses.
IX Acknowledgements
This work was supported in part by the AXA Research Fund (AXA Chair for Internet of Everything at Koc University), Huawei Graduate Research Scholarship and by Koc University İş Bank Research Center for Infectious Diseases (KUISCID).
References
- [1] O. B. Akan et al., “Information and communication theoretical understanding and treatment of spinal cord injuries: State-of-the-art and research challenges,” arXiv preprint arXiv:2003.11864, 2020.
- [2] M. Civas and O. B. Akan, “Rate of information flow across layered neuro-spike network in the spinal cord,” IEEE Transactions on NanoBioscience, vol. 19, no. 3, pp. 368 – 377, 2020.
- [3] M. Civas and O. B. Akan, “An information theoretical analysis of multi-terminal neuro-spike communication network in spinal cord,” in Proceedings of the 5th ACM International Conference on Nanoscale Computing and Communication, 2018, pp. 1–6.
- [4] C. Koca and O. B. Akan, “Anarchy versus cooperation on internet of molecular things,” IEEE Internet of Things Journal, vol. 4, no. 5, pp. 1445–1453, 2017.
- [5] S. Pal, N. Islam, S. Misra, and S. Balasubramaniam, “In vivo channel characterization for dengue virus infection,” in Proceedings of the Sixth Annual ACM International Conference on Nanoscale Computing and Communication, 2019, pp. 1–7.
- [6] M. Khalid, O. Amin, S. Ahmed, B. Shihada, and M.-S. Alouini, “Modeling of viral aerosol transmission and detection,” IEEE Transactions on Communications, vol. 68, no. 8, pp. 4859 – 4873, 2020.
- [7] 2020. [Online]. Available: https://www.worldometers.info/coronavirus/
- [8] P. Zhou et al., “A pneumonia outbreak associated with a new coronavirus of probable bat origin,” Nature, vol. 579, no. 7798, pp. 270–273, 2020.
- [9] T. Zhang, Q. Wu, and Z. Zhang, “Probable pangolin origin of SARS-CoV-2 associated with the COVID-19 outbreak,” Current Biology, 2020.
- [10] W. Ji, W. Wang, X. Zhao, J. Zai, and X. Li, “Cross-species transmission of the newly identified coronavirus 2019-nCoV,” Journal of Medical Virology, vol. 92, no. 4, pp. 433–440, 2020.
- [11] Z. Xu et al., “Pathological findings of COVID-19 associated with acute respiratory distress syndrome,” The Lancet Respiratory Medicine, vol. 8, no. 4, pp. 420–422, 2020.
- [12] W.-j. Guan et al., “Clinical characteristics of coronavirus disease 2019 in china,” New England Journal of Medicine, vol. 382, no. 18, pp. 1708–1720, 2020.
- [13] R. Wölfel et al., “Virological assessment of hospitalized patients with COVID-2019,” Nature, vol. 581, no. 7809, pp. 465–469, 2020.
- [14] L. Morawska and J. Cao, “Airborne transmission of SARS-CoV-2: The world should face the reality,” Environment International, p. 105730, 2020.
- [15] J. Liu et al., “Community transmission of severe acute respiratory syndrome coronavirus 2, shenzhen, china, 2020,” Emerging Infectious Diseases, vol. 26, no. 6, pp. 1320–1323, 2020.
- [16] Q. Li et al., “Early transmission dynamics in wuhan, china, of novel coronavirus–infected pneumonia,” New England Journal of Medicine, vol. 382, no. 13, pp. 1199–1207, 2020.
- [17] World Health Organization, “Infection prevention and control of epidemic-and pandemic-prone acute respiratory infections in health care,” 2014.
- [18] N. Van Doremalen et al., “Aerosol and surface stability of SARS-CoV-2 as compared with SARS-CoV-1,” New England Journal of Medicine, vol. 382, no. 16, pp. 1564–1567, 2020.
- [19] B. Pastorino, F. Touret, M. Gilles, X. de Lamballerie, and R. N. Charrel, “Prolonged infectivity of SARS-CoV-2 in fomites,” Emerging Infectious Diseases, vol. 26, no. 9, p. 2256, 2020.
- [20] C. Heneghan, E. Spencer, J. Brassey, and T. Jefferson, “SARS-CoV-2 and the role of orofecal transmission: Systematic review,” medRxiv, 2020.
- [21] H. Gao, H. Yao, S. Yang, and L. Li, “From SARS to MERS: evidence and speculation,” Frontiers of Medicine, vol. 10, no. 4, pp. 377–382, 2016.
- [22] W. Li et al., “Angiotensin-converting enzyme 2 is a functional receptor for the sars coronavirus,” Nature, vol. 426, no. 6965, pp. 450–454, 2003.
- [23] J. Gu and C. Korteweg, “Pathology and pathogenesis of severe acute respiratory syndrome,” The American Journal of Pathology, vol. 170, no. 4, pp. 1136–1147, 2007.
- [24] A. C. Walls et al., “Structure, function, and antigenicity of the SARS-CoV-2 spike glycoprotein,” Cell, vol. 181, no. 2, pp. 281–292, 2020.
- [25] Y. Zhao et al., “Single-cell RNA expression profiling of ACE2, the putative receptor of wuhan 2019-nCov,” BioRxiv, 2020.
- [26] CDC COVID-19 Response Team, “Coronavirus disease 2019 in children, united states, february 12–april 2, 2020,” Morbidity and Mortality Weekly Report, vol. 69, no. 14, pp. 422–426, 2020.
- [27] R. Castagnoli et al., “Severe acute respiratory syndrome coronavirus 2 (SARS-CoV-2) infection in children and adolescents: a systematic review,” JAMA Pediatrics.
- [28] N. Rajapakse and D. Dixit, “Human and novel coronavirus infections in children: a review,” Paediatrics and International Child Health, pp. 1–20, 2020.
- [29] S. Bunyavanich, A. Do, and A. Vicencio, “Nasal gene expression of angiotensin-converting enzyme 2 in children and adults,” Jama, vol. 323, no. 23, pp. 2427–2429, 2020.
- [30] A. Wang et al., “Single nucleus multiomic profiling reveals age-dynamic regulation of host genes associated with SARS-CoV-2 infection,” bioRxiv, 2020.
- [31] N. S. Sharif-Askari et al., “Expression of SARS-CoV-2 receptor, ACE2, and TMPRSS2 in the lung airways is lower in children compared to adults and increases due to smoking and copd,” Molecular Therapy-Methods & Clinical Development, 2020.
- [32] P. C. Williams et al., “SARS-CoV-2 in children: spectrum of disease, transmission and immunopathological underpinnings,” Pathology, 2020.
- [33] D. Schoeman and B. C. Fielding, “Coronavirus envelope protein: current knowledge,” Virology Journal, vol. 16, no. 1, pp. 1–22, 2019.
- [34] R. Yan et al., “Structural basis for the recognition of SARS-CoV-2 by full-length human ACE2,” Science, vol. 367, no. 6485, pp. 1444–1448, 2020.
- [35] J. M. White and G. R. Whittaker, “Fusion of enveloped viruses in endosomes,” Traffic, vol. 17, no. 6, pp. 593–614, 2016.
- [36] N. Yang and H.-M. Shen, “Targeting the endocytic pathway and autophagy process as a novel therapeutic strategy in COVID-19,” International Journal of Biological Sciences, vol. 16, no. 10, p. 1724, 2020.
- [37] H. Wang et al., “SARS coronavirus entry into host cells through a novel clathrin-and caveolae-independent endocytic pathway,” Cell Research, vol. 18, no. 2, pp. 290–301, 2008.
- [38] A. Milewska et al., “Entry of human coronavirus NL63 into the cell,” Journal of Virology, vol. 92, no. 3, 2018.
- [39] Y. Inoue et al., “Clathrin-dependent entry of severe acute respiratory syndrome coronavirus into target cells expressing ACE2 with the cytoplasmic tail deleted,” Journal of Virology, vol. 81, no. 16, pp. 8722–8729, 2007.
- [40] O. O. Glebov, “Understanding SARS-CoV-2 endocytosis for COVID-19 drug repurposing,” The FEBS Journal, 2020.
- [41] W. Sungnak et al., “SARS-CoV-2 entry factors are highly expressed in nasal epithelial cells together with innate immune genes,” Nature Medicine, vol. 26, no. 5, pp. 681–687, 2020.
- [42] J. E. Hall, Guyton and Hall textbook of medical physiology. Elsevier Health Sciences, 2010.
- [43]
- [44] B. K. Rubin, “Physiology of airway mucus clearance.” Respiratory care, vol. 47, no. 7, p. 761, 2002.
- [45] G. Seminara et al., “Biological fluid dynamics of airborne covid-19 infection,” Rendiconti Lincei. Scienze fisiche e naturali, pp. 1–33, 2020.
- [46] P. Gehr, “Annexe a. anatomy and morphology of the respiratory tract,” Annals of the ICRP, vol. 24, no. 1-3, pp. 121–166, 1994.
- [47] Y.-R. Guo et al., “The origin, transmission and clinical therapies on coronavirus disease 2019 (COVID-19) outbreak–an update on the status,” Military Medical Research, vol. 7, no. 1, pp. 1–10, 2020.
- [48] F. Silhol, G. Sarlon, J.-C. Deharo, and B. Vaïsse, “Downregulation of ACE2 induces overstimulation of the renin–angiotensin system in COVID-19: should we block the renin–angiotensin system?” Hypertension Research, pp. 1–3, 2020.
- [49] P. K. Datta, F. Liu, T. Fischer, J. Rappaport, and X. Qin, “SARS-CoV-2 pandemic and research gaps: Understanding SARS-CoV-2 interaction with the ACE2 receptor and implications for therapy,” Theranostics, vol. 10, no. 16, p. 7448, 2020.
- [50] T. Chen and M. Dulfano, “Mucus viscoelasticity and mucociliary transport rate.” The Journal of laboratory and clinical medicine, vol. 91, no. 3, pp. 423–431, 1978.
- [51] S. Block, V. P. Zhdanov, and F. Hook, “Quantification of multivalent interactions by tracking single biological nanoparticle mobility on a lipid membrane,” Nano letters, vol. 16, no. 7, pp. 4382–4390, 2016.
- [52] B. Fain and H. M. Dobrovolny, “Initial inoculum and the severity of covid-19: A mathematical modeling study of the dose-response of sars-cov-2 infections,” Epidemiologia, vol. 1, no. 1, p. 5–15, Oct 2020.
- [53] V. P. Zhdanov and B. Kasemo, “Virions and respiratory droplets in air: Diffusion, drift, and contact with the epithelium,” Biosystems, vol. 198, p. 104241, 2020.
- [54] F. S. Heldt, S. Y. Kupke, S. Dorl, U. Reichl, and T. Frensing, “Single-cell analysis and stochastic modelling unveil large cell-to-cell variability in influenza A virus infection,” Nature Communications, vol. 6, no. 1, pp. 1–12, 2015.
- [55] A. W. Eckford and P. J. Thomas, “Information theory of intercellular signal transduction,” in 49th Asilomar Conference on Signals, Systems and Computers, 2015, pp. 119–122.
- [56] A. Patwa and A. Shah, “Anatomy and physiology of respiratory system relevant to anaesthesia,” Indian Journal of Anaesthesia, vol. 59, no. 9, p. 533, 2015.
- [57] E. R. Weibel, A. F. Cournand, and D. W. Richards, Morphometry of the human lung. Springer, 1963, vol. 1.
- [58] J. Guo et al., “Single-cell RNA analysis on ACE2 expression provides insight into SARS-CoV-2 blood entry and heart injury,” medRxiv, 2020.
- [59] M.-Y. Li, L. Li, Y. Zhang, and X.-S. Wang, “Expression of the SARS-CoV-2 cell receptor gene ACE2 in a wide variety of human tissues,” Infectious Diseases of Poverty, vol. 9, pp. 1–7, 2020.
- [60] G. Descamps et al., “ACE2 protein landscape in the head and neck region: The conundrum of SARS-CoV-2 infection,” Biology, vol. 9, no. 8, p. 235, 2020.
- [61] X. Xudong, C. Junzhu, W. Xingxiang, Z. Furong, and L. Yanrong, “Age-and gender-related difference of ACE2 expression in rat lung,” Life Sciences, vol. 78, no. 19, pp. 2166–2171, 2006.
- [62] Y. J. Hou et al., “SARS-CoV-2 reverse genetics reveals a variable infection gradient in the respiratory tract,” Cell, vol. 182, no. 2, pp. 429–446, 2020.
- [63] R. R. Mercer, M. L. Russell, V. L. Roggli, and J. D. Crapo, “Cell number and distribution in human and rat airways,” American Journal of Respiratory Cell and Molecular Biology, vol. 10, no. 6, pp. 613–624, 1994.
- [64] R. Crapo, A. Morris, P. Clayton, and C. Nixon, “Lung volumes in healthy nonsmoking adults,” Bulletin Europeen de Physiopathologie Respiratoire, vol. 18, no. 3, p. 419, 1982.
- [65] F. A. V. Braga et al., “A cellular census of human lungs identifies novel cell states in health and in asthma,” Nature Medicine, vol. 25, no. 7, pp. 1153–1163, 2019.
- [66] P. A. Reyfman et al., “Single-cell transcriptomic analysis of human lung provides insights into the pathobiology of pulmonary fibrosis,” American Journal of Respiratory and Critical Care Medicine, vol. 199, no. 12, pp. 1517–1536, 2019.
- [67] R. M. Kacmarek, S. Dimas, and C. W. Mack, Essentials of Respiratory Care. Elsevier Health Sciences, 2013.
- [68] S. Gizurarson, “Anatomical and histological factors affecting intranasal drug and vaccine delivery,” Current Drug Delivery, vol. 9, no. 6, pp. 566–582, 2012.
- [69] M. Ali, “Histology of the human nasopharyngeal mucosa,” Journal of Anatomy, vol. 99, no. 3, pp. 657–672, 1965.
- [70] M. Hasan and C. Lange, “Estimating in vivo airway surface liquid concentration in trials of inhaled antibiotics,” Journal of Aerosol Medicine, vol. 20, no. 3, pp. 282–293, 2007.