zhengh@snnu.edu.cn
Pseudorapidity distributions of charged particles in pp(), p(d)A and AA collisions using Tsallis thermodynamics
Abstract
The pseudorapidity distributions of charged particles measured in p+p() collisions for energies ranging from GeV to 13 TeV, d+Au collisions at GeV, p+Pb collisions at TeV and A+A collisions at RHIC and LHC are investigated in the fireball model with Tsallis thermodynamics. We assume that the rapidity axis is populated with fireballs following q-Gaussian distribution and the charged particles follow the Tsallis distribution in the fireball. The theoretical results are in good agreement with the experimental data for all the collision systems and centralities investigated. The collision energy and centrality dependence of the central position and its width of the fireball distribution are also investigated. A possible application of the model to predict the charged particle pseudorapidity distributions for the system size scan program proposed recently for the STAR experiment at RHIC is proposed.
pacs:
25.75.Dw, 25.75.-q, 24.10.Pa, 24.85.+p1 Introduction
High energy heavy-ion collisions performed in the laboratory have been used to study the systems with hadronic or partonic degrees of freedom under extremely high temperature and density. It is commonly agreed that a new dense and hot phase of nuclear matter denoted as quark-gluon plasma (QGP), predicted by Quantum-Chromodynamics (QCD), is created where the partonic degrees of freedom come into play during the dynamical evolution of the system [1, 2]. But in experiment, only the final states of produced particles can be measured, including the charged particle pseudorapidity distributions (), particle transverse momentum spectra and so on. Given those information, we are able to study the properties of QGP, particle production mechanism, particle correlations etc.. The study of the charged particle pseudorapidity distribution over a wide range of pseudorapidity () and its dependence on the colliding system, energy as well as centrality, are benchmark tools to constrain the models [3, 4, 5, 6]. It is important to improve our understanding of the particle production mechanisms and provide insight into the partonic structure of the interacting nuclei. At the same time, the total charged particle multiplicities and the evolution of their distributions with centrality add significant information.
In experiments, abundant data of the pseudorapidity distributions of charged particles have been measured by different experimental collaborations [3, 4, 5, 6, 7, 8, 9, 10, 11, 12, 13, 14, 15, 16, 17, 18, 19], ranging from the small collision systems such as p+p to large ones such as Pb+Pb at different collision energies and centralities. In order to describe , experimentalists have proposed several parameterizations and utilized them to extract the total charged particle multiplicities () produced in the reactions [3, 4, 16, 20]. Some well established models, such as HIJING [21], AMPT [22] (with and without string melting), EPOS-LHC [23], UrQMD [24], CGC based model [25], introduced in the field of high energy heavy-ion collisions, are also adopted to understand the pseudorapidity distributions of charged particles as well as other physics.
In Refs. [26, 27], a multi-source thermal model, the four sources being projectile and target cylinders and the projectile and target leading particles, has been applied to describe the centrality dependence of the charged particle pseudorapidity distribution in Pb+Pb collisions. In Ref. [28], a new revised Landau hydrodynamic model following the same philosophy as in the multi-source thermal model is proposed to systematically study produced in heavy-ion collisions. The system is assumed to be consisted of three sources, i.e., the central, target and projectile sources. The central source is described by the Landau hydrodynamic model and the target and projectile sources are assumed to emit particles in their rest frame isotropically. In Refs. [29, 30], a 1+1 dimensional hydrodynamics model, which is analytically solvable, is adopted by taking into account the collective motion to study the pseudorapidity distributions in both AA and pp collisions at currently available energies. In this model, the final particles have been categorized as the particles governed by the hydrodynamics and the leading particles. In Ref. [31], a relativistic viscous hydrodynamics model considering the longitudinal acceleration effect has been used to study the pseudorapidity distribution of charged particles and estimate the energy density from the most central AA collisions at RHIC and LHC. These models have different scenarios, but their results are in good agreement with the available experimental data.
Recently, the fireball model based on Tsallis thermodynamics had been successfully applied to describe the charged particle (pseudo)rapidity distributions produced in heavy-ion collisions [32, 33]. In this paper, we will systematically analyze the pseudorapidity distributions of charged particles produced in p+p() collisions at energies ranging from GeV to 13 TeV, d+Au collisions at 200 GeV, p+Pb collisions at 5.02 TeV and A+A collisions including Cu+Cu, Au+Au, Pb+Pb and Xe+Xe at RHIC and LHC energies and different centralities. We will also extract the total charged particle multiplicities from the model and compare with the experimental data and study their dependence on centrality as well as collision energy.
The paper is organized as follows: In section II, we briefly introduce the fireball model with Tsallis thermodynamics for the pseudorapidity distribution. Then we extend the model to asymmetric collision system. In section III, we show the model results along with the experimental data of the pseudorapidity distributions of charged particles produced in collision systems selected. The corresponding total charged particle multiplicities are also extracted and studied. Furthermore, the collision energy and centrality dependence of the central position and its width of the fireball distribution are also discussed. In section IV, a brief conclusion is drawn.
2 Theoretical framework and formulas
Recently, the Tsallis distribution has been extensively and successfully applied to describe the particle spectra produced in pp, pA and AA collisions. In Refs. [34, 35], it has been shown that different versions of the Tsallis distribution can reproduce the particle spectra resulting in different fitting parameters. In the framework of the fireball model with Tsallis thermodynamics [32, 36], the transverse momentum distribution of particles is taken as
| (1) |
where is the volume, is the particle state degeneracy, is the transverse mass and is the particle rest mass, is the rapidity, is the chemical potential, is the temperature and is the entropic factor which measures the nonadditivity of the entropy. When , the Tsallis distribution becomes the Boltzmann distribution. There are four parameters , , and in Eq. (1) to describe the particle spectrum. To reduce the number of free parameters and simplify the problem, is assumed to be 0 for all the collision systems in this study. In the mid-rapidity region, Eq. (1) can be written as
| (2) |
which will be used to extract the parameters and by fitting the particle transverse momentum spectrum.
In the framework of the fireball model with Tsallis thermodynamics [32, 33], the rapidity axis is populated with fireballs which follow the distribution function , where is the rapidity of the fireball. The particles emitted from the fireball follow the Tsallis distribution Eq. (1). Therefore, the particle distribution measured can be written as
| (3) |
where is the total particle multiplicity and is the normalization constant that ensures
| (4) |
To deduce the formula of the rapidity density distribution of charged particles, we integrate Eq. (3) over the transverse momentum and obtain [32, 33]
| (5) | |||||
In order to compare with the experimental data, one should convert Eq. (5) to pseudorapidity density distribution of charged particles because data are usually measured in pseudorapidity space. The relation between the pseudorapidity and rapidity is [1]
| (6) |
Substituting Eq. (6) into Eq. (3), we obtain:
| (7) |
Because of the extra term , Eq. (7) cannot be analytically integrated over . Therefore, we perform the numerical integration for the pseudorapidity distribution
| (8) | |||||
where
| (9) |
The distribution of the fireballs has been assumed to be the summation of two q-Gaussian functions for the symmetric collision systems in Refs.[32, 33] as
| (10) |
where and are fitting parameters referring to the central position and its width of the fireball distribution respectively, which are determined by the experimental data. is another fitting parameter which can be different from for the particle transverse momentum spectrum Eq. (1) while is assumed in Refs. [32, 33]. Since the symmetric and asymmetric collision systems will be considered in this work, we extend the fireball model with Tsallis thermodynamics to the asymmetric collision system and modify as
| (11) |
where and () are the central positions and their widths of the fireball distributions. is the relative weight introduced for the asymmetric collision system. For the symmetric collision system, , and and Eq. (10) is recovered. In analogy to Refs. [32, 33], is assumed.
3 Results
As discussed in Sec. 2, we need to extract the parameters and by fitting the particle transverse momentum spectra at the mid-rapidity, given by the experimental collaborations [11, 37, 38, 39, 40, 41, 42, 43, 44, 45, 46, 47, 48, 49, 50, 51], using Eq. (2). We had pointed out that the single Tsallis distribution only can reproduce the particle spectra at low and intermediate region, where most of the particles are produced, in Pb+Pb and Xe+Xe collisions at LHC. Therefore, a cut at 7.5 GeV/c is applied for both collision systems when we fit the charged particle spectra. Since there are plenty of works to study the particle spectra with Tsallis distribution [34, 35, 52, 53, 54, 55, 56, 57], we will not show the figures here. Then we can use these two parameters and the fireball model with Tsallis thermodynamics, Eqs. (8) and (11) (or (10) for the symmetric collision systems) to study the pseudorapidity distribution of charged particles for the system investigated.
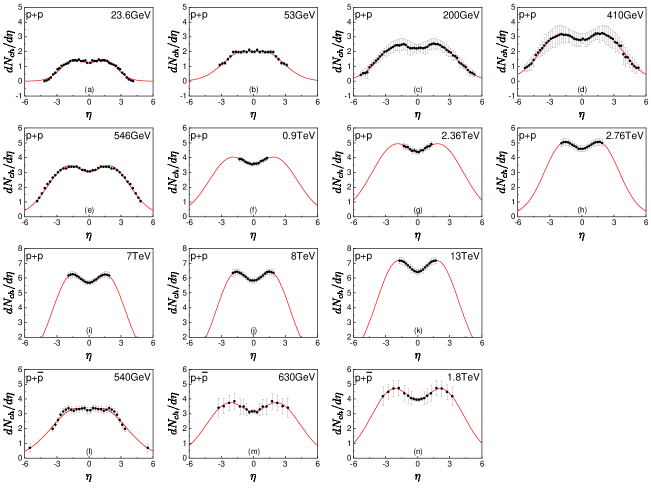
In Fig.1, the results of the pseudorapidity distribution of charged particles produced in proton-(anti)proton collisions, using the fireball model, from different experiments with collision energies ranging from 23.6 GeV up to 13 TeV, as well as the corresponding experimental data are shown. As one can see, the experimental results are well reproduced, analogous to the results shown in Ref. [32] but with more collision energies. One should notice that the scale of the charged particle pseudorapidity density distribution is different for each row in Fig. 1 in order to better visualize the results. One can observe that a valley at is developed and its depth increases with the collision energy for both p+p and p+ collisions. This valley is commonly related to partial transparency and limited stopping power of the colliding (anti)proton [58]. A difference of the pseudorapidity distributions between p+p collisions and p+ collisions that the valley of the pseudorapidity distribution is developed at higher collision energy in p+ collisions can be easily noticed. This may reflect the fact that p and can annihilate each other when they collide while p and p cannot, so this should take off more p from zero pseudorapidity. One also can notice that the pseudorapidity distributions only cover a very limited range at some collision energies, e.g., 0.9 TeV of p+p collisions, because of the limited acceptance of the detectors in the experiment. This results in the large uncertainties of the central position values and its widths of the fireball distributions. Therefore, we will not adopt these collision energies to explore the energy dependence of the central position and its width of the fireball distribution discussed later in this paper.
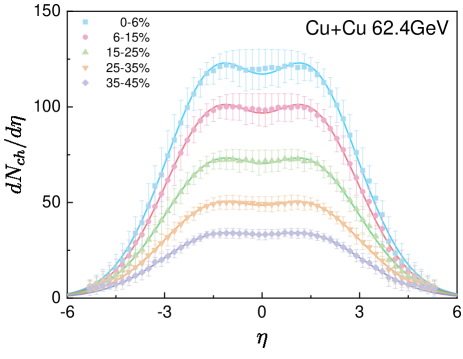
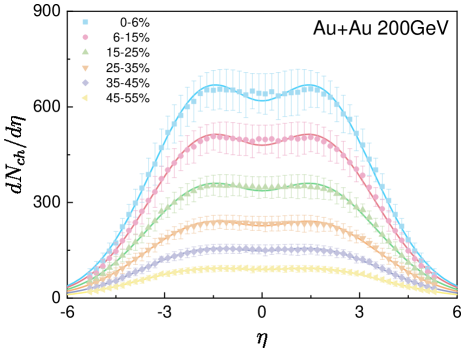
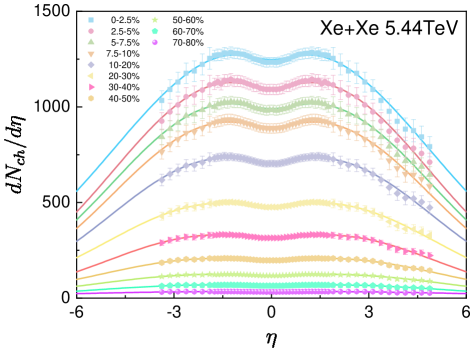
In Figs. 2, 3, 4, the results of the pseudorapidity distributions of charged particles produced in AA collisions, i.e., Cu+Cu collisions at GeV, Au+Au collisions at GeV, Xe+Xe collisions at TeV, at different centrality bins are shown. As one can see, the experimental results at different centralities are well reproduced. We also studied the other nucleus-nucleus collision systems, i.e., Cu+Cu collisions at GeV, Au+Au collisions at GeV and Pb+Pb collisions at TeV, at RHIC and LHC. Similar results are found. Actually, the results for Au+Au collisions at GeV, Pb+Pb collisions at TeV and the prediction for the central collisions of Pb+Pb at TeV were shown in Ref. [33]. It is worth noting that the peak and valley structure of the charged particle pseudorapidity distributions produced in AA collisions are typically shallower and wider than those produced in proton-(anti)proton collisions at the similar collision energies. This can be associated with the dense medium produced in AA collisions and its evolution dynamics.
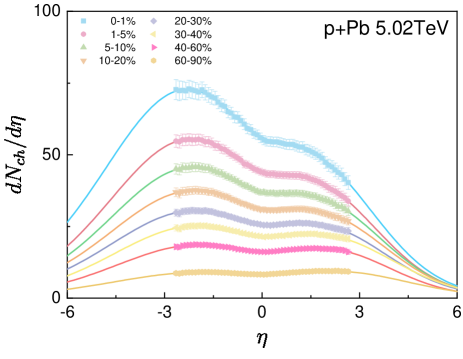
In Fig.5, we studied the asymmetric collision system p+Pb at TeV. Different from the symmetric collision case, the pseudorapidity distribution is no longer symmetric respect to but obviously has forward/backward asymmetry that more charged particles are produced in the p side than the Pb side. The extended fireball model, Eqs. (8) and (11), is adopted to take into account asymmetric fact in this case. The results of the pseudorapidity distributions of charged particles for eight centrality bins are shown. A good agreement between the model results and the experimental data is shown. One can see that the pseudorapidity distribution of the charged particles becomes more symmetric from central to peripheral collisions because the peripheral collisions are more like the p+p collisions for the asymmetric collision system. Similar behavior is also observed in d+Au collisions at GeV [19].
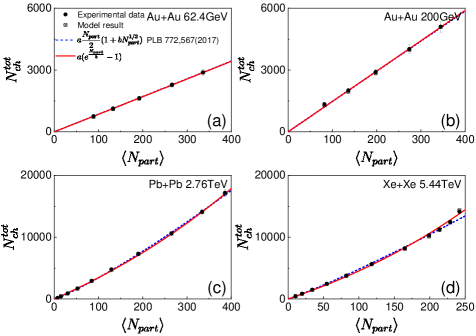
Now we turn to analyze the relation between the centrality (collision energy) and the total charged particle multiplicity produced in different collision systems. By integrating Eq. (8) over , the total number of charged particles produced can be extracted from the fireball model. To compare with the experimental data, the cut has been adopted same as the experiments when available. Here we only show the results for AA collisions. For the pp() collisions, we refer the results to Ref. [6]. While for the p(d)A collisions, we do not have enough data to conduct the analysis. In Fig. 6, we plot the total charged particle multiplicity versus the number of participants for the selected collision systems. As one can see that the model results are almost indistinguishable from the experimental data. Similar results are also obtained for the other collision systems investigated in this paper. The analytical function (see the legend) adopted from Ref. [5] has been used to fit the total charged particle multiplicity as a function of , shown by the dashed lines in the figure. This function can well reproduce all the experimental data except Xe+Xe collisions where there is a deviation for the data at central collisions. We proposed an analytical function , where and are fitting parameters, and it works for all the collision systems. According to the analytical functions, we cannot distinguish whether the total charged particle multiplicity increases with the number of participants exponentially or with a power-law.
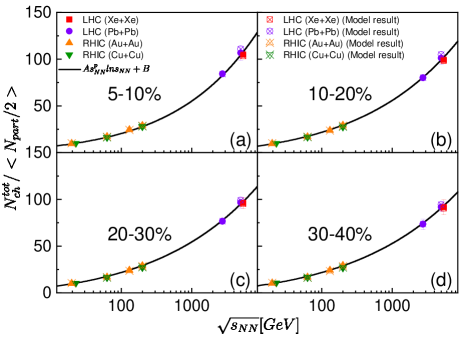
In Fig. 7, we investigate the total charged particle multiplicity per participant pair produced in AA collisions at different centralities as a function of the collision energy. One can see that the model results are in good agreement with the experimental data which is not surprising as one has seen it from Fig. 6. It is found that the analytical function adopted from Ref. [3], applied only to the central collision data, can describe the experimental data well for different centralities. The fitting power decreases from central to peripheral collisions, which qualitatively reflects the fact that the dense medium created in the more central collisions causes more collisions and leads to more charged particle production per participant pair.
| System | |||
| Cu+Cu | 62.4 GeV | ||
| 200 GeV | |||
| Au+Au | 62.4 GeV | ||
| 130 GeV | |||
| 200 GeV | |||
| Pb+Pb | 2.76 TeV | - | |
| 5.02 TeV | - | ||
| Xe+Xe | 5.44 TeV | - |
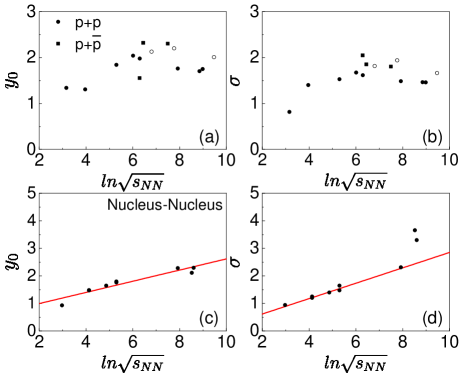
We also analyze the collision energy (centrality) dependence of the central position and its width of the fireball distribution. For the same reason as stated before, the analysis of the collision energy dependence on and for pA collision systems is not conducted. In Fig. 8(a) and (b), the results of and versus collision energy () of proton-(anti)proton collisions are shown respectively. For pp collisions, the pseudorapidity distributions of charged particles do not show the two humps structure because of the limited detector acceptance of the experiments for some energies, i.e., 0.9 TeV, 2.36 TeV, 13 TeV, see Fig. 1. Therefore, we show the model results, which are not well constrained by the experimental data for these energies, with open circles to see the trend. The solid circles show that both and increase with collision energy to a critical value and then saturate to a certain value. Although there are only three collision energies for p collisions, the same trend is observed (solid squares). In Fig. 8(c) and (d), we show the model results for the most central AA collisions. Different from pp, both and show a linear dependence of collision energy for the energies investigated which demonstrates our conjecture made in Ref. [33]. A linear fit has been conducted and shown in the figure respectively. For , we only do the linear fit up to 2.76 TeV. For the other centralities (We put the closest centralities together because the centrality classification is not exactly the same between RHIC and LHC), the similar behavior has been observed.
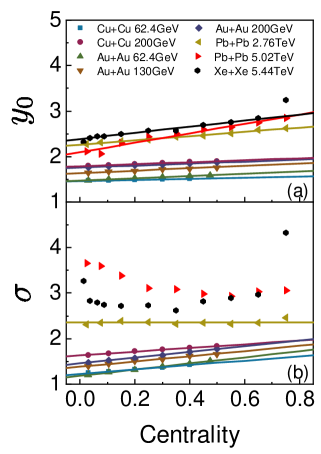
In Fig. 9, the centrality dependence of the and are shown for AA collisions. A nice linear relation between and centrality is found for the collision energy up to 2.76 TeV. While for the reactions Pb+Pb at TeV and Xe+Xe at TeV, the linear behavior is not so great. We performed linear fits shown with the lines in Fig. 9(a). The fitting parameters are listed in Table. 1. The positive slope indicates that the stopping power is decreasing from central to peripheral collisions because there are more collisions and dissipation processes at central collisions comparing with peripheral collisions. The linear behavior of the width versus centrality is also observed at RHIC. The fitting results are shown by the lines Fig. 9(b) and fitting parameters are listed in Table. 1. For the collisions at LHC, shows different dependence on centrality. For Pb+Pb at TeV, tends to be a constant for all the centralities and a constant line is plotted. While the collision energy goes up, i.e., Pb+Pb at TeV and Xe+Xe at TeV, shows a U shape. We also notice a different energy dependence behavior of in Fig. 8(d). We do not have an explanation for these different behaviors. From the results shown in Fig. 9, one also can conclude that the collision system size dependence of the and at the RHIC is weak by comparing the results obtained from Cu+Cu and Au+Au collisions at the same collision energy. Combining the results shown in Figs. 7 and 8, it becomes possible that one can use the fireball model to predict the charged particle pseudorapidity distributions for the system size scan program proposed recently for the STAR experiment at RHIC. A machine learning technique can provide powerful tool to this application of the fireball model.
4 Conclusions
In this paper, the pseudorapidity distributions of charged particles produced in different collision systems at RHIC and LHC energies have been studied in the fireball model based on Tsallis thermodynamics. We have extended the model to the asymmetric collision systems. The theoretical results are in good agreement with the experimental data for all the collision systems investigated. The total charged particle multiplicities are extracted from model and compared with experimental data. Whether the total charged particle multiplicity increases with the number of participants exponentially or with a power-law can not be distinguished. We also investigate the collision energy and centrality dependence of the central position and its width of the fireball distribution. In AA collisions, both the and have a linear relation with the collision energy and centrality, in particular at RHIC energy, respectively. With the results found in this paper, a possible application of the fireball model with Tsallis thermodynamics to predict the charged particle pseudorapidity distributions for the system size scan program proposed recently for the STAR experiment at RHIC is suggested.
Acknowledgments
This work is supported by the National Natural Science Foundation of China (Grants No. 11905120), the Fundamental Research Funds for the Central Universities No. GK201903022 and No. GK202003019 and Natural Science Basic Research Plan in Shaanxi Province of China (program No. 2020JM-289).
References
References
- [1] Wong C Y 1994 Introduction to High-Energy Heavy-Ion Collisions (Singapore: World Scientific Press)
- [2] Csernai L P 1994 Introduction to Relativistic Heavy Ion Collisions (United States of America: Wiley Press)
- [3] Abbas E et al (ALICE Collaboration) 2013 Phys. Lett. B 726 610
- [4] Adam J et al (ALICE Collaboration) 2016 Phys. Lett. B 754 373
- [5] Adam J et al (ALICE Collaboration) 2017 Phys. Lett. B 772 567
- [6] Acharya S et al (ALICE Collaboration) 2019 Phys. Lett. B 790 35
- [7] Alner G J et al (UA5 Collaboration) 1986 Z. Phys. C 33 1
- [8] Alver B et al (PHOBOS Collaboration) 2011 Phy. Rev. C 83 024913
- [9] Aamodt K et al (ALICE Collaboration) 2010 Eur. Phys. J. C 68 89
- [10] Adam J et al (ALICE Collaboration) 2017 Eur. Phys. J. C 77 33
- [11] Adam J et al (ALICE Collaboration) 2016 Phys. Lett. B 753 319
- [12] Abe F et al (CDF Collaboration) 1990 Phys. Rev. D 41 2330
- [13] Arnison G et al (UA1 Collaboration) 1983 Phys. Lett. B 123 108
- [14] Thome W et al (Aachen-CERN-Heidelberg-Munich Collaboration) 1977 Nucl. Phys. B 129 365
- [15] Alver B et al (PHOBOS Collaboration) 2009 Phys. Rev. Lett 102 142301
- [16] Back B B et al (PHOBOS Collaboration) 2003 Phys. Rev. Lett 91 052303
- [17] Back B B et al (PHOBOS Collaboration) 2006 Phys. Rev. C 74 021901(R)
- [18] Aad G et al (ATALS Collaboration) 2016 Eur. Phys. J. C 76 199
- [19] Back B B et al (PHOBOS Collaboration) 2005 Phys. Rev. C 72 031901(R)
- [20] Basu S, Thakur S, Nayak T K and Pruneau C A 2020 Multiplicity and pseudo-rapidity density distributions of charged particles produced in pp, pA and AA collisions at RHIC & LHC energies arXiv:2008.07802[nucl-ex]
- [21] Wang X N and Gyulassy M 1991 Phys. Rev. D 44 3501
- [22] Lin Z W, Ko C M, Li B A, Zhang B and Pal S 2005 Phys. Rev. C 72 064901
- [23] Pierog T, Karpenko I, Katzy J M, Yatsenko E and Werner K 2015 Phys. Rev. C 92 034906
- [24] Mitrovski M, Schuster T, Graf G, Petersen H and Bleicher M 2009 Phys. Rev. C 79 044901
- [25] Albacete J L and Dumitru A 2011 A model for gluon production in heavy-ion collisions at the LHC with rcBK unintegrated gluon densities arXiv: 1011.5161[hep-ph]
- [26] Sun J X, Tian C X, Wang E Q and Liu F H 2013 Chin. Phys. Lett. 30 022501
- [27] Li B C, Wang Y Z, Liu F H, Wen X J and Dong Y E 2014 Phys. Rev. D 89 054014
- [28] Gao L N and Liu F H 2015 Adv. High Energy Phys. 2015 184713
- [29] Jiang Z J, Xu D F and Huang Y 2018 Adv. High Energy Phys. 2018 1369098
- [30] Jiang Z J, Deng H P and Huang Y 2016 Adv. High Energy Phys. 2016 5308084
- [31] Jiang Z F, Yang C B, Ding C and Wu X Y 2018 Chin. Phys. C 42 123103
- [32] Marques L, Cleymans J and Deppman A 2015 Phys. Rev. D 91 054025
- [33] Gao Y, Zheng H, Zhu L L and Bonasera A 2017 Eur. Phys. J. A 53 197
- [34] Zheng H and Zhu L L 2016 Adv. High Energy Phys. 2016 9632126
- [35] Zheng H and Zhu L L 2015 Adv. High Energy Phys. 2015 180491
- [36] Cleymans J and Worku D 2012 J. Phy. G 39 025006
- [37] Adam J et al (ALICE Collaboration) 2003 Phys. Rev. Lett 91 172302
- [38] Khachatryan V et al (CMS Collaboration) 2010 JHEP 02 041
- [39] Acharya S et al (ALICE Collaboration) 2018 JHEP 11 013
- [40] Adam J et al (ALICE Collaboration) 2015 Eur. Phys. J. C 75 226
- [41] Aad G et al (ATALS Collaboration) 2016 Eur. Phys. J. C 76 403
- [42] Arnison G et al (UA1 Collaboration) 1982 Phys. Lett. B 118 167
- [43] Abe F et al (CDF Collaboration) 1988 Phys. Rev. Lett 61 1819
- [44] Adamczyk L et al (STAR Collaboration) 2017 Phys. Rev. C 96 044904
- [45] Back B B et al (PHOBOS Collaboration) 2005 Phys. Rev. Lett 94 082304
- [46] Adler C et al (STAR Collaboration) 2002 Phys. Rev. Lett 89 202301
- [47] Back B B et al (PHOBOS Collaboration) 2005 Phys. Lett. B 578 297
- [48] Alver B et al (PHOBOS Collaboration) 2006 Phys. Rev. Lett 96 212301
- [49] Back B B et al (PHOBOS Collaboration) 2003 Phy. Rev. Lett 91 072302
- [50] Adam J et al (ALICE Collaboration) 2016 Phys. Lett. B 760 720
- [51] Acharya S et al (ALICE Collaboration) 2019 Phys. Lett. B 788 166
- [52] Zheng H, Zhu L L and Bonasera A 2015 Phys. Rev. D 92 074009
- [53] Wang Q, Yang P P and Liu F H 2019 Results in Physics 12 259
- [54] Parvan A S, Teryaev O V and Cleymans J 2017 Eur. Phys. J. A 53 102
- [55] Cleymans J, Azmi M D, Parvan A S and Teryaev O V 2017 EPJ Web of Conferences 137 11004
- [56] Azmi M D and Cleymans J 2015 Eur. Phys. J. C 75 430
- [57] Yassin H and Elyazeed E R A 2019 Acta Phys. Pol. B 50 37
- [58] Wolschin G 2015 Phys. Rev. C 91 014905