,open=,close=,semicolon
Frictional anisotropy of 3D-printed fault surfaces
Abstract
The surface morphology of faults controls the spatial anisotropy of their frictional properties, and hence their mechanical stability. Such anisotropy is only rarely studied in seismology models of fault slip, although it might be paramount to understand the seismic rupture in particular areas, notably where slip occurs in a direction different from that of the main striations of the fault. To quantify how the anisotropy of fault surfaces affects the friction coefficient during sliding, we sheared synthetic fault planes made of plaster of Paris. These fault planes were produced by 3D-printing real striated fault surfaces whose 3D roughness was measured in the field at spatial scales from millimeters to meters. Here, we show how the 3D-printing technology can help for the study of frictional slip. Results show that fault anisotropy controls the coefficient of static friction, with , the friction coefficient along the striations being three to four times smaller than , the friction coefficient along the orientation perpendicular to the striations. This is true both at the meter and the millimeter scales. The anisotropy in friction and the average coefficient of static friction are also shown to decrease with the normal stress applied to the faults, as a result of the increased surface wear under increased loading.
I Introduction
Faults in the Earth’s crust are complex systems along which earthquakes nucleate and propagate (e.g., Wibberley et al. (2008)). Faults hold structures and heterogeneities at all scales (Renard et al. (2006); Candela et al. (2012); Brown and Scholz (1985)). While they are often simplified to their simplest two-dimensional description (i.e., the fault plane), increasing complexity is now added to faults models (e.g., Rice and Ben-Zion (1996)). It is indeed considered that, to fully understand seismicity in various areas, it is paramount to account for some disorder in the faults frictional properties such as secondary faulting, off-fault damage or roughness of the fault plane (Pechmann and Kanamori (1982); Tesei et al. (2014); Ando et al. (2012); Aochi and Ide (2009); Sagy and Lyakhovsky (2019); Candela et al. (2011); Allam et al. (2019); Bruhat et al. (2019)). For instance, the volume of damaged rocks, during the activation of a fault, depends on the initial contact roughness (Queener et al. (1965)) and, thus, a fault with a stronger roughness presents a different energy budget than a flat fault, as more energy is converted into surface area energy. In particular, roughness encourages the triggering of local events, but is believed to prevent the propagation of large-slip earthquakes (Bruhat et al. (2019)). Additionally, large scale roughness tends to inhibit the propagation of any rupture faster than the shear wave velocity of surrounding rocks (Bouchon et al. (2010)).
Another degree of complexity is more rarely considered when modelling geological contacts and fault slip: the possible anisotropy in their frictional properties.
Morphological anisotropy is a known feature of faults, notably impacting the seismic waves velocity in their vicinity (Evans (1984); Cochran et al. (2003); Li et al. (2015)) or the mobility of natural and injected fluids (Vadacca et al. (2018)) in the subsurface. Frictional anisotropy, interestingly, is also regularly studied in other fields than seismology, for instance the tribology of rubber tires (Carbone et al. (2009); Tiwari et al. (2016)), the strength of advanced adhesives (Jin et al. (2012)), or the mitigation of water condensation (Pionnier et al. (2018)). It is also considered to play a major role in nature (Filippov and Gorb (2013)), for instance in the motion of numerous animals (Jin et al. (2012); Filippov et al. (2018); Zheng et al. (2007)) and the hydration of some plants (Roth-Nebelsick et al. (2012); Wang et al. (2017a)). In most cases, frictional anisotropy derives from the existence of preferential topographical orientations on, at least, one of the contact surfaces (Yu and Wang (2012); Tapia et al. (2016)). The length scale for such structural directivity can be as small as micrometer (Stupkiewicz et al. (2014)) to nanometer (Fessler et al. (2019); Gong et al. (2018)).
In seismic faults, such preferential orientations in their topography are observed at all scales (Renard et al. (2006); Candela et al. (2012); Brown and Scholz (1985)) and originate from several processes. At the molecular level, rock forming crystals may display some frictional anisotropy. It is notably the case for antigorite, a mineral abundant in the Earth’s upper mantle (Campione and Capitani (2013)). At the mesoscopic scale, the shear strength of foliated rocks is known to be anisotropic, due to the oriented planes in their constitutive mineralogy (Shea and Kronenberg (1993); Rawling et al. (2002)). Fault zones in sedimentary basins are initiated by early fractures that often propagate in layered sediments. It can result in an anisotropic ramp-flat morphology of these fracture surfaces (Peacock and Sanderson (1992)). For more mature faults having accumulated enough displacement, and above a given length scale (Candela and Brodsky (2016)), the topography of the fault planes is also marked by slip induced wear, with striations and grooves of various wavelengths and amplitudes oriented along the main direction of slip (Engelder (1974); Edwards et al. (2018)). If such morphological anisotropy of fault surfaces is well-known, its effect on the anisotropy of the frictional properties remains to be characterised.
Such a characterisation of frictional anisotropy could also be of interest for other types of rock contacts than strictly seismic faults, in particular for shallow rock joints and fractures, whose three-dimensional geometry is key in geotechnical engineering and for the structural stability of many man-made constructions (Barton and Choubey (1977); Seidel and Haberfield (1995); Grasselli and Egger (2003); Li et al. (2020)).
Here, we study how the morphology of faults controls the static coefficient of friction and the anisotropy of friction with regards to the main stress orientation during slip. To reach this goal, we produce 3D-prints of actual faults surfaces whose topography was measured in the field (Candela and Renard (2012)). We perform friction experiments with plaster of Paris casts of these 3D-printed faults. Results show that the coefficient of static friction along faults is highly anisotropic, a property that should henceforward be considered in numerical models of slip on seismic faults. We also show that this anisotropy is stress dependent, and should decrease with depth (e.g., Byerlee (1978)).
II 3D printing and plaster casting of fault planes
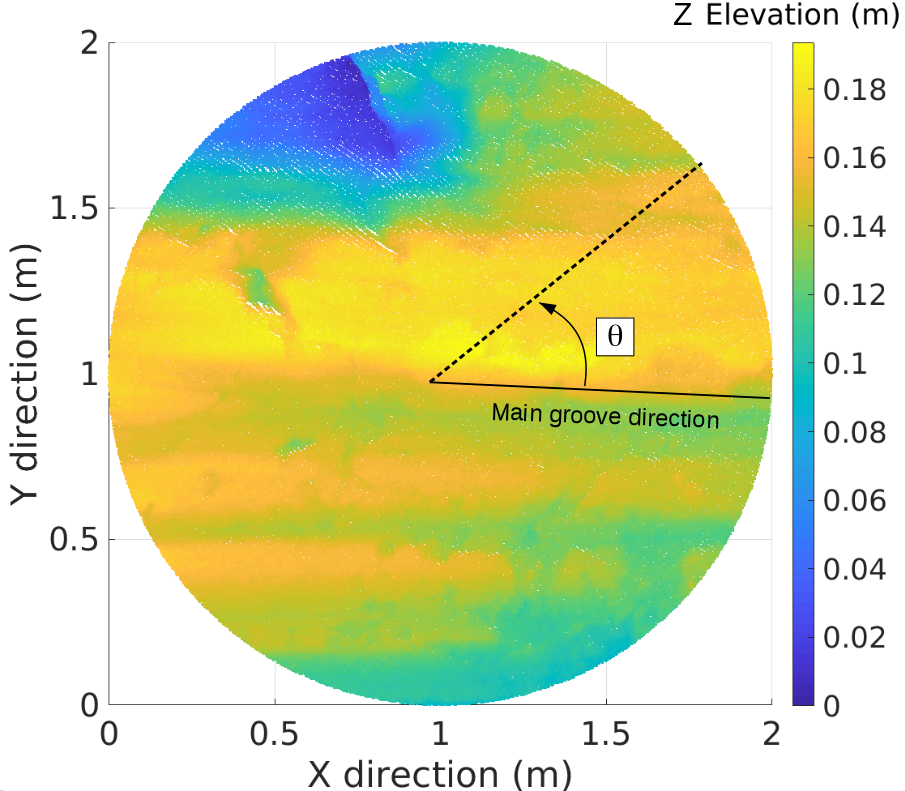
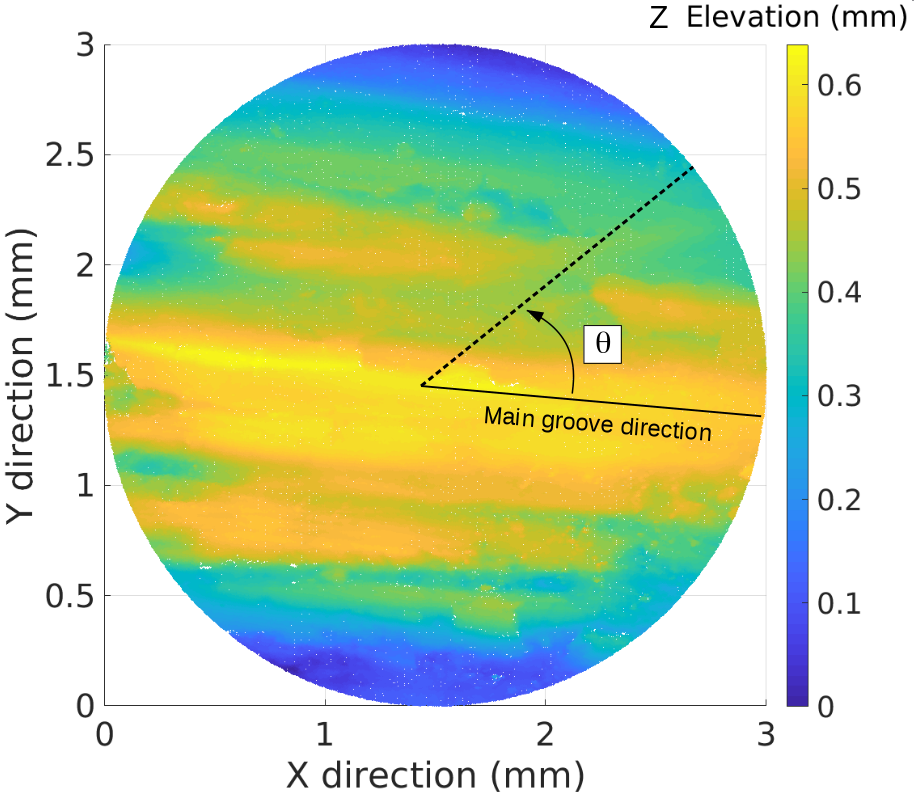
The actual morphology of natural faults can be difficult to assess, even if their long wavelength structures can be inferred by surface or subsurface imaging techniques (Edwards et al. (2018); Massonnet et al. (1993); Blakely et al. (2002)). Yet, some fault planes are accessible to direct, high resolution, measurements, notably as they were exhumed by erosion and tectonic processes. For this study, we have used a series of digital fault surfaces. These fault roughness data were acquired with Light Detection And Ranging (LiDAR), laboratory laser profilometry, or white light interferometry techniques (Candela et al. (2012)). These data are available on an online public database (Candela and Renard (2012)), and in a repository with a doi number (Renard (2020)). Should the reader hold some similar data, these authors welcome additions to this database. We have specifically selected fault roughness measurements performed on the Corona Heights fault (Candela et al. (2011)) that outcrops near the Peixotto playground in San Francisco, California. These data cover surface areas with spatial scales in the range of millimeters to meters. Figures 1 and 2 show the fault surface at two spatial scales, one surface at the meter scale, defined on a mmmm grid, and one surface at the millimeter scale, defined on a mm grid. We will further on refer to these two surfaces as respectively and . Already, one can notice some preferential orientations in these topographies, and that the amplitude of fault roughness is, relatively to their size, somewhat larger at smaller scales () than at larger scales () (Brodsky et al. (2016)).
For our tests, we chose to limit these anisotropic surfaces to a circular sample geometry. We also applied a mild running-window median filter to smooth out spikes in the measured surfaces that could be associated to measurement noise. The window length of the filter was space steps, accounting for cm for and for m for . In order to run the friction experiments, we generated some opposing surfaces to the ones presented in Figs. 1 and 2. These opposing surfaces could not be measured, as the actual fault walls that were facing and are now eroded. To reconstruct them, we have applied the following transformation to the 3D coordinates of and :
| (1) |
where , and are the coordinates of the generated opposing surfaces and give the map location of a given surface point of elevation , as represented in Fig. 1. We have thus assumed that the missing fault walls are complementary to the measured ones, so that, when pressed together before the friction tests, they form a bulk with negligible aperture between the two blocks. Such assumption for natural faults would only be partly verified. When having accumulated enough slip, a granular layer of gouge material may there have formed, and the two opposing sliding surfaces may not always perfectly match. However, our assumption is relevant for the youngest faults with a small amount of slip. We have also assumed that erosion did not significantly alter the fault plane, such that the measured topography is representative of the one of an actual buried fault. For the Corona Heights fault, this assumption is valid because the fault offsets silica-rich chert rocks with a high resistance to weathering.
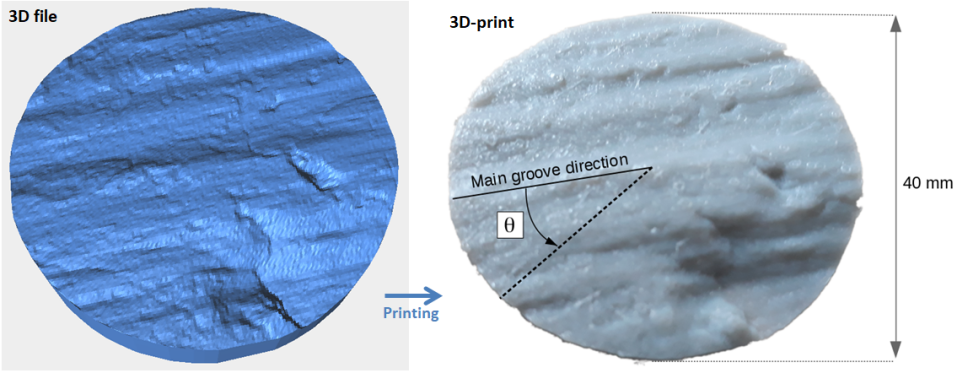
After having obtained the surfaces, we isotropically (i.e., with the same factor in all directions) down- or up-scaled and to fit a standard cm diameter disk that matches the clamp size of our shear deformation apparatus. We also re-gridded the surfaces to match the lateral resolution of our 3D-printer (Ultimaker2 Extended+ (Ultimaker )) that has a nozzle size of m. The four surfaces (two fault surfaces and two opposing surfaces) were then 3D-printed into polylactic acid (PLA) material, as shown in Fig. 3.
It should be noted that, even when designed to be flat, printed objects can present a natural roughness (Quinsat et al. (2018)), at a scale however smaller that the grooves observed on the printed faults. These intrinsic imperfections shall be comparable to m, the elementary thickness of the PLA layers deposited by our 3D printer. In comparison, the 2D standard deviation of the elevation in our printed objects topography are mm for and mm for . The maximal elevation of these objects are, respectively, mm and mm. We thus consider that the small scale roughness (m) from the printer’s limit in resolution has a second order effect on the frictional properties of the surfaces.
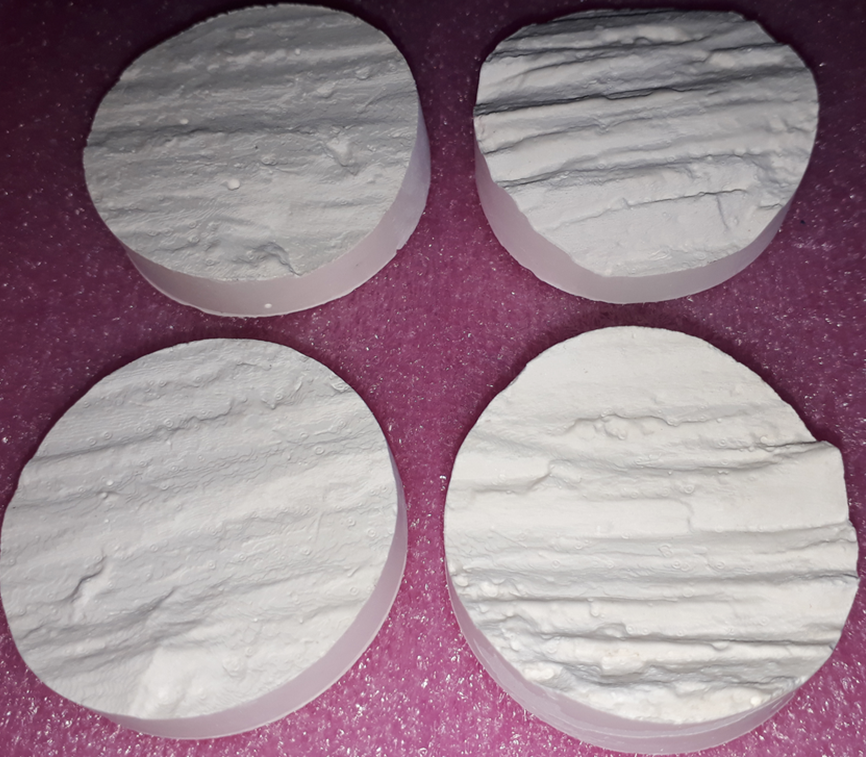
Although we could have performed the friction experiments with the plastic pieces produced with the 3D printer, we have rather produced samples of plaster of Paris (gypsum) blocks moulded from the plastic faults. Plaster is known to be a reasonable model of porous brittle materials (Vekinis et al. (1993)), and the main goal of these casts was to work with a rock-like material, notably because plaster may wear and deform differently than plastic under shear. The fragile nature of plaster, and the potential friction-induced wear that the plaster was subjected to in our experiments, made us use new casts for each experimental realisation. The casts were generated with the following protocol: five volumes of water and eight volumes of powder of plaster of Paris were mixed and poured over the plastic moulds, then let to dry during one and half hour. The moulds, an example of which is shown in Fig. 3, were sprayed before each cast with a thin layer of silicon grease to avoid some of the fine plaster details to stick to the plastic during the mould release. The last step in the casts preparation was to dry them in an oven at a temperature of C for one hour. As a result, we produced fault planes in blocks made of plaster of Paris, as shown in Fig. 4.
III Experimental set-up and experimental conditions
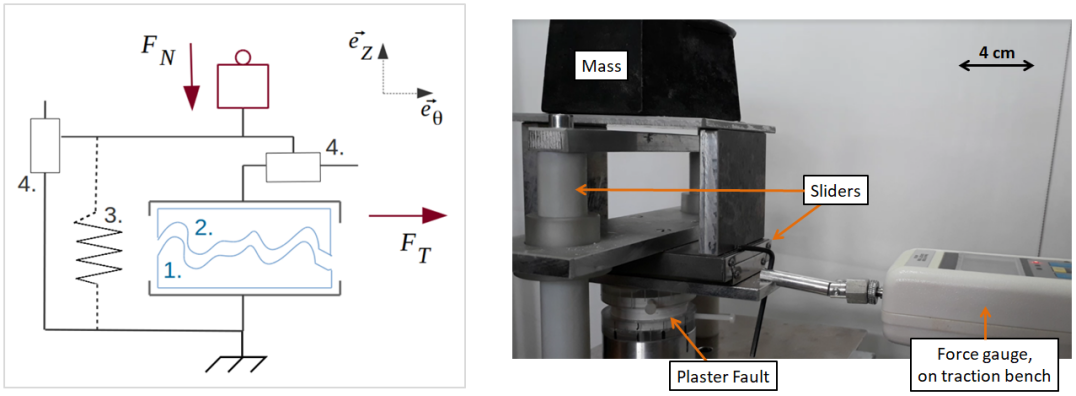
The shear apparatus used to perform the friction tests is shown in Fig. 5. The two complementary surfaces are pressed together and mounted one on top of the other between the clamps of the shear apparatus. A normal force is applied on the top surface by using adjustable weights. In addition, a spring system of stiffness N m-1 allows, if desired, to compensate for the machine empty weight of N (i.e., the normal weight transmitted to the friction surfaces by the machine top clamp and structure and the top cast when no extra mass is used). A tangential driving shear force is then applied to the top fault wall in a given direction of the plane. The amplitude of the force is measured by a Sauter® force gauge (Sauter ). The shear orientation is defined by the angle from the orientation of main grooves on the fault surface, as defined in Figs. 1 and 2. A horizontal mechanical slider makes sure that the friction is evaluated in the direction of interest only, and a vertical slider allows upward or downward displacement of the top surface. While these sliders would ideally be perfectly lubricated, we have estimated their frictional resistance at the sliding velocity of our experiments, NN by performing a friction test with no fault installed in the machine (that is, with only air between the two clamps represented in Fig. 5).
The target speed of the test bench speed (that is, the demanded slip velocity) was fixed to a constant and equal to mm s-1. Of course, such a velocity may be orders of magnitude above that of typical tectonic solicitations (for instance, an ultra-fast oceanic ridge may reach an opening rate of to cm yr-1 (Renard et al. (1985))). Here, we define the static friction in the experiments as the peak shear stress reached before sliding occurs, divided by the normal stress.
We characterise the anisotropy of this laboratory static friction coefficient for both the and surfaces by performing a series of experiments where we vary the angle of loading with respect to the grooves. We ran friction tests every on both plaster faults. At each angle, the experiment was repeated at least three times in order to ensure that results are reproducible (with new casts each time, to avoid any wear related deviation). The standard deviation computed on these multiple measurements (typically to N) was used to compute the error bars on our characteristics coefficients of static friction. was sheared under a normal stress kPa, while the tests performed on the rougher surface were performed under kPa. A total of 76 experiments were performed, 37 using and 39 using .
At the onset of slip, the laboratory static friction coefficient is defined using a standard Coulomb’s law (Bowden and Tabor (1951)):
| (2) |
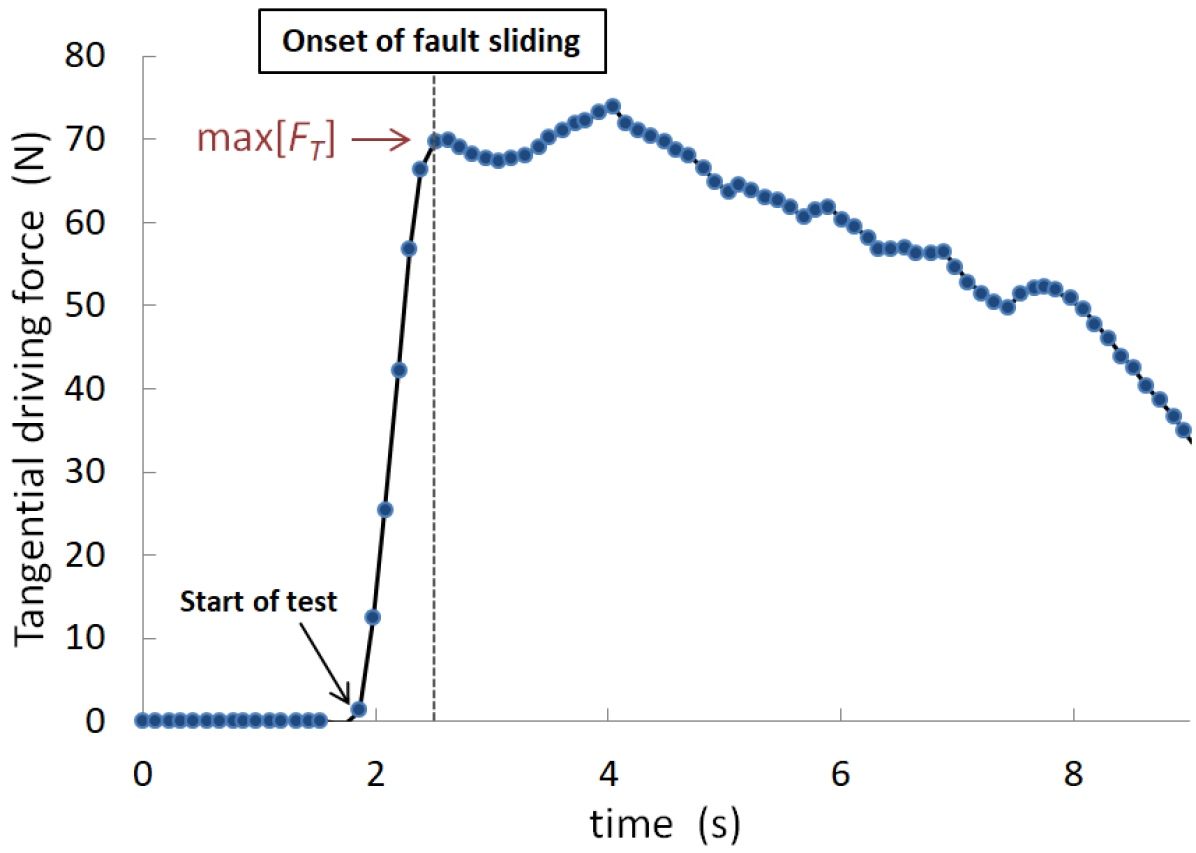
where is the coefficient of static friction and is the (local) maximum tangential force applied at the onset of slip. In the following, we will also consider the mean driving and normal stresses, denoted and , where cm is the radius of the cast. Figure 6 shows a typical measurement of a friction test, from which , and hence , are calculated.
IV Results
IV.1 Friction anisotropy
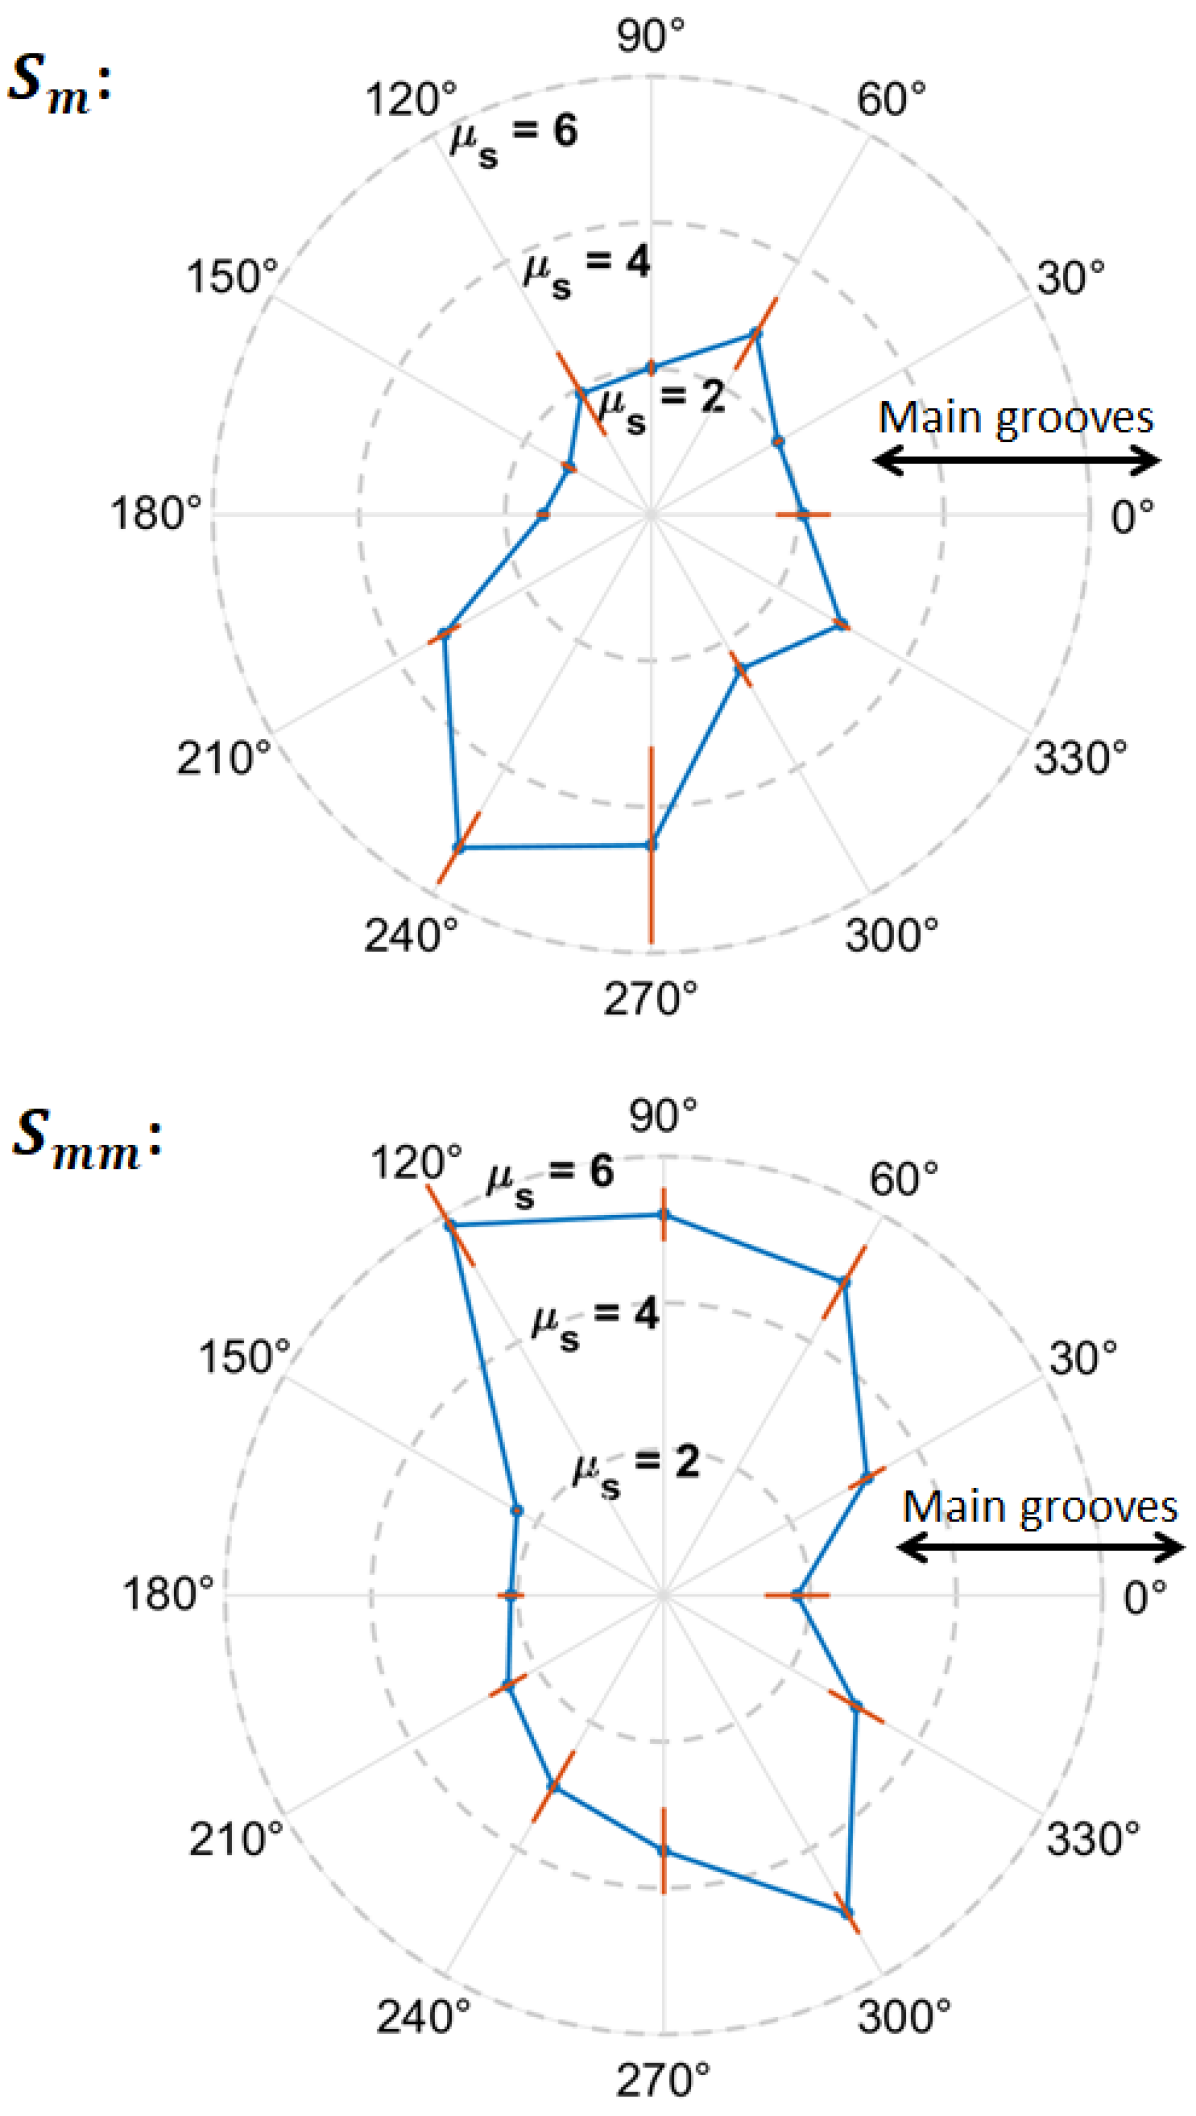
The results are presented in Fig. 7. The derived coefficient of frictions are larger than , which does not come as a surprise due to the non negligible roughness of our fault samples. Indeed, a large part of the contact area is bound to be perpendicular to the demanded slip (in any direction), inducing a strong resistance to motion.
On both fault samples, one can observe the strong anisotropy of the coefficient of static friction, with the maximum value of being about four times larger than its minimum for and about three times larger for . In most experiments, the minimal friction is obtained along the main groove orientation (i.e., at or ), and the resistance to shear is larger perpendicularly to this orientation. The maximum of value is however never obtained exactly at or but rather along a neighbouring direction. Local maxima are indeed obtained for or when shearing and for or when shearing .
IV.2 Damage and stress dependence
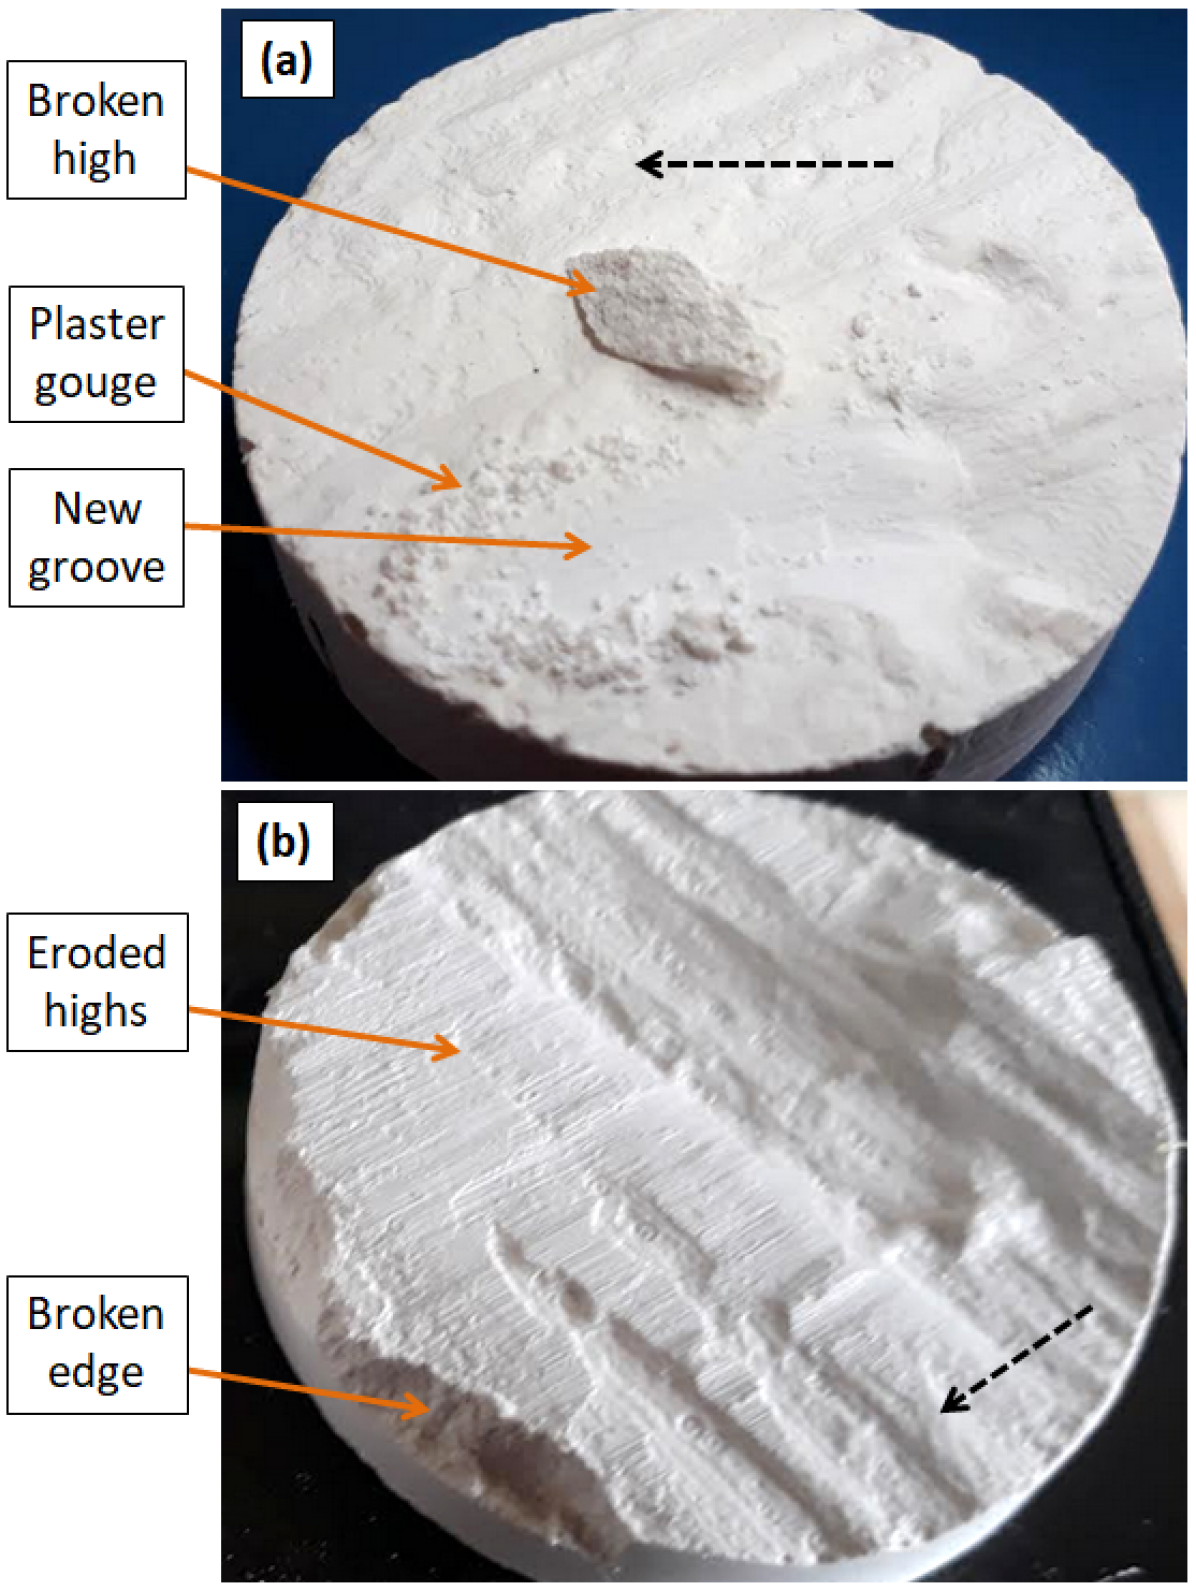
Most of our experiments were destructive, with visible wear on the plaster samples after the shearing tests. This wear was the main reason calling for the production of new plaster casts for each experimental realisation, as we verified that repeating a same experiment with a previously used cast led to a significant (and here unwanted) drop in friction. The observed damage consists either in the formation of plaster powder (gouge) or in the rupture of topographic highs of the fault surfaces. Part of it might have initiated at the onset of the fault displacement (and hence be related to the static friction), while some of it has rather been induced by the subsequent sliding. Figure 8 shows some examples of these damage types.
Wear of seismic faults has been studied (e.g., Wang and Scholz (1994); Kim et al. (2004)) to, in particular, better understand the energy budget of the deformation, but also because this process may lubricate faults during slip (e.g., Di Toro et al. (2011); Rempel and Rice (2006)) or modify the fault permeability to fluid flow (e.g., Blanpied et al. (1992); Mitchell and Faulkner (2008)). The present study focuses on the measurement of the coefficient of static friction and on its anisotropy, but we suggest that our 3D-print-based set-up could also enable the quantitative characterisation of damage during sliding along analogue fault surfaces.
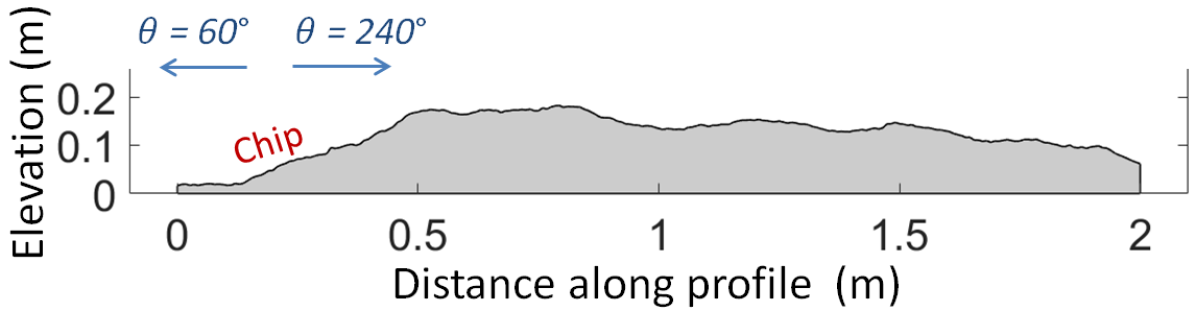
We here keep to a qualitative assessment of which parts of the surfaces were mainly worn during each experiment. It seems that most of the shear resistance of the Corona Heights fault, at the millimeter scale (), arises from its grooves. By contrast, the friction of (representing a metric scale) is dominated by one chip in its field-scanned morphology (i.e., the main topographic low in Fig. 1). This chip being on the edge of the 3D-printed surface, but not on the edge of the real word fault, a finite size effect (inducing an artificial asymmetry of the fault wall) is certainly at play in the results reported in Fig. 7 (top), notably explaining the strong asymmetry in for the opposite directions and . Indeed, due to the finite size of our tested pieces, the interlocking of the chip is relatively free to unlock laterally along the direction, but is strongly locked by the surrounding plaster along the direction (see Fig. 9).
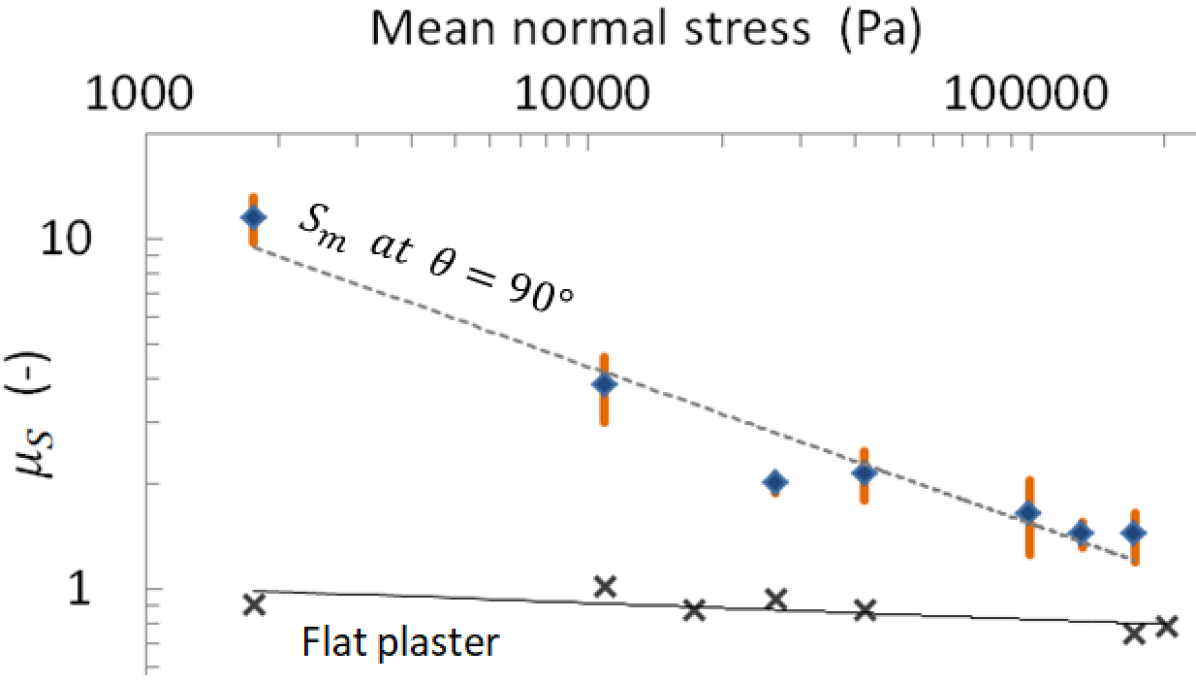
Because the overall friction is likely to be affected by the surface wear, and because this wear is likely stress dependent, we have performed some friction tests on under various loads , at a given angle . The results are shown in Fig. 10. At the highest tested stresses, seems, to an extent stress independent, with its mean variations lying within the measured error bars. While this result is compatible with the classical Coulomb theory (e.g., Bowden and Tabor (1951)), one can observe, over a wider range of normal stresses, a consistent decrease in the friction coefficient with a higher normal stress. It could, in part, emanate from some limitations in our experimental set-up. For instance, at lower , the internal friction of the device () accounts for a more significant portion of the total measured tangential force, and the friction characterisation could thus be less accurate. We have however run similar tests on flat plaster surfaces, showing no significant variations in over the same stress range (see Fig. 10). The drop in friction coefficient with is then likely related to the increased damage under higher normal loading (see Fig. 8), reducing the overall shear resistance as asperities are easier to break. It might also result from the change in effective contact area with a higher load, with, proportionally, more pressure being borne by the surfaces parallel to the demanded motion, causing proportionally less of a resistance to slip. Such a drop of with the normal stress has already been reported for tilted contacts (Ben-David and Fineberg (2011)), as the static coefficient of friction is not an absolute material constant (Ben-David and Fineberg (2011); Hanaor et al. (2016)).
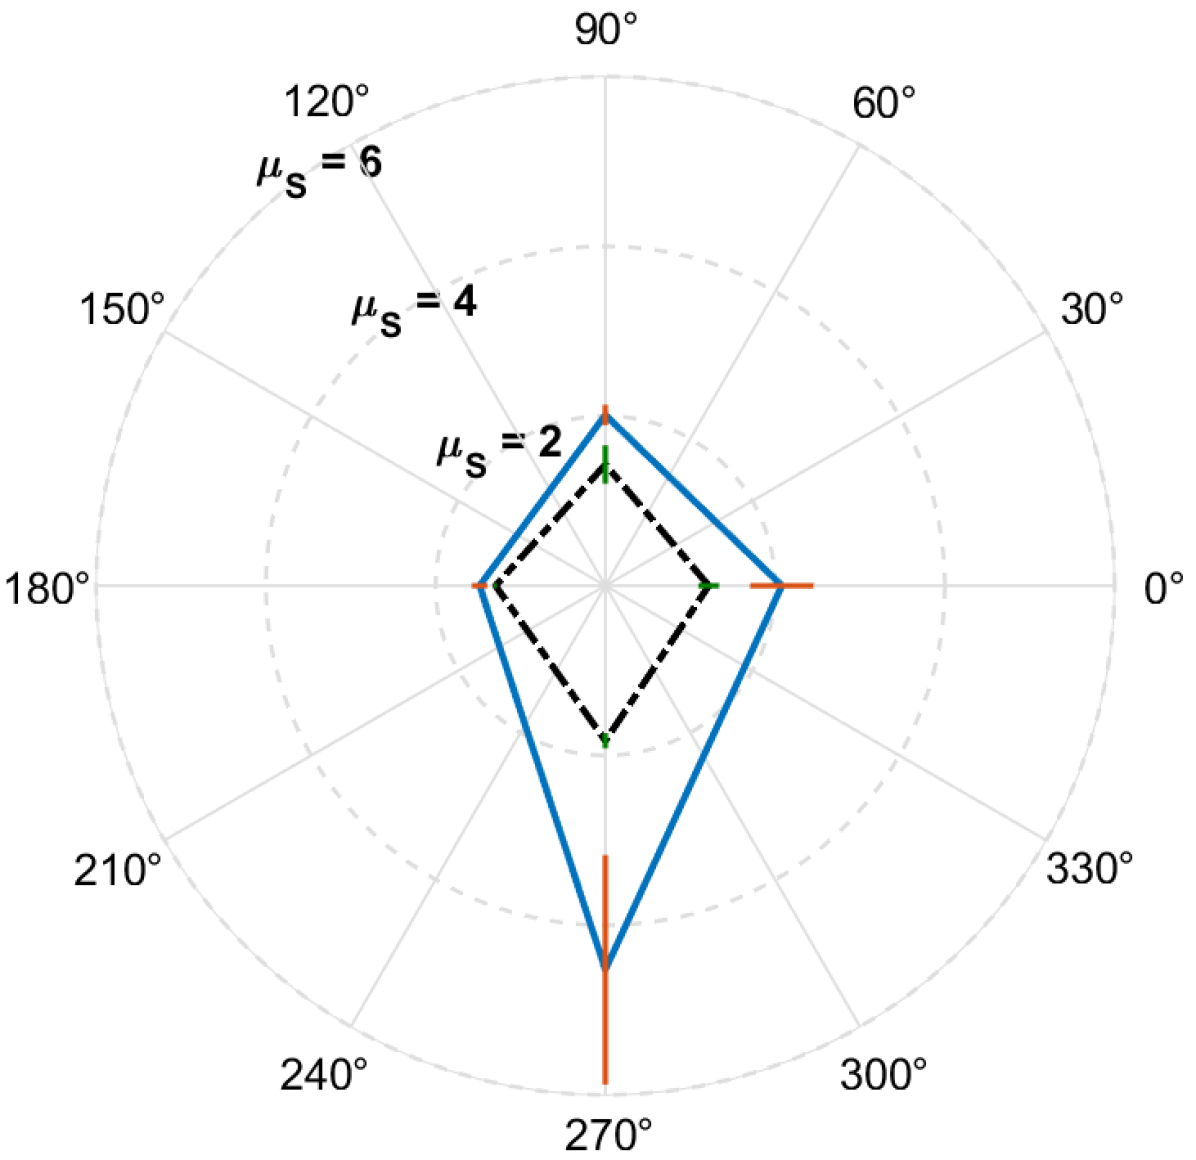
We have then assessed the effect of the normal stress on the anisotropy of the static friction coefficient. We performed frictional tests on the four poles of () at a higher load ( kPa) than the load used before (i.e., kPa, as reported in Fig. 7). The newly measured coefficients of static friction are shown in Fig. 11. One can notice the reduced friction anisotropy at high . The ratio between the maximum and the minimum value of indeed drops from at kPa to at kPa. This result suggests that the frictional anisotropy of faults is smaller at depth. This concept is naturally linked with the seminal Byerlee (1978)’s law, stating that the roughness of fault planes (as well as the type of their constitutive rocks) has less effect on their maximum static frictional properties at larger depths.
V Discussion and conclusion
Here, we show how the multiscale anisotropy of fault plane topography leads to an anisotropy in the frictional properties. Results confirm that seismic faults are prone to slide along some preferential orientations. The orientation that is the most likely is the one that faults have previously slid along, and which has shaped some guiding grooves in their morphology. Yet, displacements following other orientations are possible. Predicting the rupture direction of the next earthquake on a fault is thus not only dependent on assessing the main regional stress. The question should rather be along which orientation a rupture criterion (e.g., Bowden and Tabor (1951)) will first be exceeded. Such a subtlety might be of little importance for mature faults for which the stress principle orientations have not changed with time, because, in this case, the main stress is likely to act along the lowest coefficient of friction anyway. Yet, it could be paramount for faults under a changing geological load, where this alignment is not verified, or for immature faults, where the slip could be mainly governed by the anisotropy of early surfaces (i.e., where the slip does not coincide with the stress principal orientation, but is non-associated). Examples of slickensides (i.e., fault planes) commonly exist with several overlapping striations orientations (e.g., Cashman and Ellis (1994)), with rake and striations oblique to the actual orientation of the fault plane (e.g., Sagy and Hamiel (2017)). These observations indicate that the original slip direction (if assumed to initiate following Andersonian criterion (Célérier (2008))) does not completely determine the direction of the next episode. Earthquakes occurring along abnormal directions (i.e., not in agreement with the local stress state) have been observed (e.g., Avouac et al. (2014); Satake and Kanamori (1991); Célérier (2008)), and their understanding might be eased by accounting for the possible frictional anisotropy of their surfaces (Bott (1959); Pollard et al. (1993)).
Note that frictional anisotropy should not only be considered at the full fault scale, but this property may spatially vary along the fault walls. Analytical solutions demonstrate that the stress around a fault is perturbed by its roughness, and a local slip can occur much before the entire fault is under yielding conditions in a given direction (Sagy and Lyakhovsky (2019)).
While we have here only measured the static coefficient of friction, we suggest that similar studies could be performed to characterise the coefficient of dynamic friction (i.e., by analysing the evolution of the resistance to motion, after the plaster faults start moving, as a function of the sliding orientation). Hence, not only the initial slip direction of an earthquake could be impacted by frictional anisotropy, but the complete slip trajectory (Tapia et al. (2016)). Changes in the slip direction within single earthquake rupture events are indeed sometimes observed, notably from bent grooves on post-mortem fault walls (Otsubo et al. (2013)).
We have, additionally, measured how the anisotropy in friction becomes less significant when the normal stress acting on a fault increases (i.e., with the fault depth), in general agreement with Byerlee’s law (Byerlee (1978)).
Such an effect likely derives from the stress related changes in rupture rheology and in damage type. The transition from a highly anisotropic to a relatively isotropic regime should typically occur when local stresses on the fault reach the yield strength of the material, MPa in the case of plaster (Vekinis et al. (1993)). This is about two orders of magnitude above the transition kPa at which we observed a strong reduction in anisotropy (see Fig. 11), but our computed is an average value which does not account for the potential strong stress concentrations at play in our faults.
Considering that the strength of rocks (e.g., Brady et al. (1993)) is about two orders of magnitude (100 times) larger than that of plaster, fault frictional anisotropy could thus be only at play at pressures less than about MPa. This would correspond to the shallowest faults, at depths less than m, where is the volumetric mass of rocks (kg m-3) and the gravity acceleration. Some care should however be taken when deriving such a conclusion by analysing resized samples as ours (mm diameter samples representing meter or millimeter topographies), as the way matter breaks is length-scale dependent (e.g., Brodsky et al. (2016)).
Note also that other fault geometries than the one we have here studied may induce lesser stress concentration, so that a significant damage only occurs at a mean stress level directly comparable to the yield stress of rocks. Thus, the possibility of frictional anisotropy should not be overlooked when studying fault buried up to km. The heterogeneity of fault planes, and thus the anisotropy in this heterogeneity, may also still play a role under high stress, as roughness does not only encourage local yield, but also helps to suppress large slip events on moving faults (Bruhat et al. (2019)).
Additionally to the assessment of the stability of (at least) shallow seismic faults, the characterisation of the frictional anisotropy of rock surfaces may be of importance in geotechnical engineering, for instance, for the stability of tunnels and foundations. There, the intrinsic strength anisotropy of foliated rocks is well studied (Shea and Kronenberg (1993); Rawling et al. (2002)). Our work shows how one can also characterise the mechanical anisotropy of rough rock contacts, for instance, along joints (Barton and Choubey (1977); Seidel and Haberfield (1995); Grasselli and Egger (2003); Li et al. (2020)) and fractures (Ponson et al. (2006a, b)) between or inside rock formations.
A main point of this manuscript is, finally, to illustrate how the 3D-printing technology can help with new experimental designs in Earth Sciences, and this technology is getting a growing attention from the community (Wang et al. (2017b); Feng et al. (2019); Squelch (2017); Wang et al. (2018); Braun et al. (2020)), including the study of the frictional properties of 3D-printed fault analogues (Braun et al. (2020)). A direct continuation of the present work, for instance, could be to 3D-print and to test some faults surfaces beforehand filtered with various band-pass filters, in order to understand how the various wavelengths of the topography contribute to the global static friction coefficient, to the dynamical friction coefficient and to analyse the spatial distribution of the fault wear produced under various stresses and amounts of slip.
Acknowledgement
Author contributions: RT proposed the guidelines of this work, AS built the test machine and, with TVD, printed the faults and performed the friction experiments. FR advised on the mechanics of seismic faults. TVD wrote the first version of this manuscript and all authors contributed to the writing of its final version. We are grateful for the early experimental explorations performed by Marine-Sophie Jacob, Céline Fliedner, Aldo Mellado Aguilar, Gaëtan Leca and Laifa Rahmi, all students from the EOST/IPGS faculty at the University of Strasbourg. We also thank Amir Sagy from the Geological Survey of Israel for fruitful discussions, and acknowledge the support of the University of Strasbourg, of the IRP France-Norway D-FFRACT, and of SFF Porelab (project number 262644 of the Research Council of Norway). We thank the Strasbourg AV.Lab association for the use of their 3D printer.
Author declarations: The authors declare no competing interest. A funding support from the University of Strasbourg is acknowledged. Readers are welcome to comment and correspondence should be addressed to vincentdospitalt@unistra.fr or renaud.toussaint@unistra.fr.
References
- Allam et al. (2019) Allam, A. A., Kroll, K. A., Milliner, C. W. D. and Richards-Dinger, K. B. Effects of fault roughness on coseismic slip and earthquake locations. Journal of Geophysical Research: Solid Earth, 124(11):11336–11349, 2019. doi: 10.1029/2018JB016216.
- Ando et al. (2012) Ando, R., Takeda, N. and Yamashita, T. Propagation dynamics of seismic and aseismic slip governed by fault heterogeneity and newtonian rheology. Journal of Geophysical Research: Solid Earth, 117(B11), 2012. doi: 10.1029/2012JB009532.
- Aochi and Ide (2009) Aochi, H. and Ide, S. Complexity in earthquake sequences controlled by multiscale heterogeneity in fault fracture energy. Journal of Geophysical Research: Solid Earth, 114(B3), 2009. doi: 10.1029/2008JB006034.
- Avouac et al. (2014) Avouac, J.-P., Ayoub, F., Wei, S., Ampuero, J.-P., Meng, L., Leprince, S., et al. The 2013, Mw 7.7 Balochistan earthquake, energetic strike-slip reactivation of a thrust fault. Earth and Planetary Science Letters, 391:128 – 134, 2014. doi: 10.1016/j.epsl.2014.01.036.
- Barton and Choubey (1977) Barton, N. and Choubey, V. The shear strength of rock joints in theory and practice. Rock mechanics, 10:1–54, 1977. doi: 10.1007/BF01261801.
- Ben-David and Fineberg (2011) Ben-David, O. and Fineberg, J. Static friction coefficient is not a material constant. Phys. Rev. Lett., 106:254301, 2011. doi: 10.1103/PhysRevLett.106.254301.
- Blakely et al. (2002) Blakely, R. J., Wells, R. E., Weaver, C. S. and Johnson, S. Y. Location, structure, and seismicity of the Seattle fault zone, Washington: Evidence from aeromagnetic anomalies, geologic mapping, and seismic-reflection data. GSA Bulletin, 114(2):169–177, 2002. doi: 10.1130/0016-7606(2002)114¡0169:LSASOT¿2.0.CO;2.
- Blanpied et al. (1992) Blanpied, M. L., Lockner, D. A. and Byerlee, J. D. An earthquake mechanism based on rapid sealing of faults. Nature, 358:574–576, 1992. doi: 10.1038/358574a0.
- Bott (1959) Bott, M. H. P. The mechanics of oblique slip faulting. Geological Magazine, 96(2):109–117, 1959. doi: 10.1017/S0016756800059987.
- Bouchon et al. (2010) Bouchon, M., Karabulut, H., Bouin, M.-P., Schmittbuhl, J., Vallée, M., Archuleta, R., et al. Faulting characteristics of supershear earthquakes. Tectonophysics, 493(3):244 – 253, 2010. doi: 10.1016/j.tecto.2010.06.011.
- Bowden and Tabor (1951) Bowden, F. P. and Tabor, D. The friction and lubrication of solids. American Journal of Physics, 19(7):428–429, 1951. doi: 10.1119/1.1933017.
- Brady et al. (1993) Brady, B. T., Duvall, W. I. and Horino, F. G. An experimental determination of the true uniaxial stress-strain behavior of brittle rock. Rock mechanics, 5:107–120, 1993. doi: 10.1007/BF01240161.
- Braun et al. (2020) Braun, P., Tzortzopoulos, G. and Ioannis, S. Design of sand-based, 3d-printed analogue faults with controlled frictional properties. preprint, doi: 10.1002/essoar.10503633.1, 2020.
- Brodsky et al. (2016) Brodsky, E. E., Kirkpatrick, J. D. and Candela, T. Constraints from fault roughness on the scale-dependent strength of rocks. Geology, 44(1):19–22, 2016. doi: 10.1130/G37206.1.
- Brown and Scholz (1985) Brown, S. R. and Scholz, C. H. Broad bandwidth study of the topography of natural rock surfaces. Journal of Geophysical Research: Solid Earth, 90(B14):12575–12582, 1985. doi: 10.1029/JB090iB14p12575.
- Bruhat et al. (2019) Bruhat, L., Klinger, Y., Vallage, A. and Dunham, E. M. Influence of fault roughness on surface displacement: from numerical simulations to coseismic slip distributions. Geophysical Journal International, 220(3):1857–1877, 2019. doi: 10.1093/gji/ggz545.
- Byerlee (1978) Byerlee, J. Friction of rocks. pure and applied geophysics, 116(4):615–626, 1978. doi: 10.1007/BF00876528.
- Campione and Capitani (2013) Campione, M. and Capitani, G. C. Subduction-zone earthquake complexity related to frictional anisotropy in antigorite. Nature Geoscience, 6:847, 2013. doi: 10.1038/ngeo1905.
- Candela and Brodsky (2016) Candela, T. and Brodsky, E. E. The minimum scale of grooving on faults. Geology, 44(8):603–606, 2016. doi: 10.1130/G37934.1.
- Candela and Renard (2012) Candela, T. and Renard, F. Fault morphology database, 2012. URL https://www.isterre.fr/french/recherche-observation/equipes/mecanique-des-failles/moyens-et-outils/article/donnees.html.
- Candela et al. (2011) Candela, T., Renard, F., Schmittbuhl, J., Bouchon, M. and Brodsky, E. E. Fault slip distribution and fault roughness. Geophysical Journal International, 187(2):959–968, 2011. doi: 10.1111/j.1365-246X.2011.05189.x.
- Candela et al. (2012) Candela, T., Renard, F., Klinger, Y., Mair, K., Schmittbuhl, J., and Brodsky, E. E. Roughness of fault surfaces over nine decades of length scales. Journal of Geophysical Research: Solid Earth, 117(B8), 2012. doi: 10.1029/2011JB009041.
- Carbone et al. (2009) Carbone, G., Lorenz, B., Persson, B. N. J. and Wohlers, A. Contact mechanics and rubber friction for randomly rough surfaces with anisotropic statistical properties. The European Physical Journal E, 29(3):275–284, 2009. doi: 10.1140/epje/i2009-10484-8.
- Cashman and Ellis (1994) Cashman, P. H. and Ellis, M. A. Fault interaction may generate multiple slip vectors on a single fault surface. Geology, 22(12):1123–1126, 1994. doi: 10.1130/0091-7613(1994)022¡1123:FIMGMS¿2.3.CO;2.
- Cochran et al. (2003) Cochran, E. S., Vidale, J. E. and Li, Y.-G. Near-fault anisotropy following the Hector Mine earthquake. Journal of Geophysical Research: Solid Earth, 108(B9), 2003. doi: 10.1029/2002JB002352.
- Célérier (2008) Célérier, B. Seeking anderson’s faulting in seismicity: A centennial celebration. Reviews of Geophysics, 46(4), 2008. doi: 10.1029/2007RG000240.
- Di Toro et al. (2011) Di Toro, G., Han, R., Hirose, T., De Paola, N., Nielsen, S., Mizoguchi, K., et al. Fault lubrication during earthquakes. Nature, 471:494–498, 2011. doi: 10.1038/nature09838.
- Edwards et al. (2018) Edwards, J. H., Kluesner, J. W., Silver, E. A., Brodsky, E. E., Brothers, D. S., Bangs, N. L., et al. Corrugated megathrust revealed offshore from costa rica. Nature Geoscience, 11:197–202, 2018. doi: 10.1038/s41561-018-0061-4.
- Engelder (1974) Engelder, J. T. Microscopic wear grooves on slickensides: Indicators of paleoseismicity. Journal of Geophysical Research, 79(29):4387–4392, 1974. doi: 10.1029/JB079i029p04387.
- Evans (1984) Evans, R. Anisotropy: a pervasive feature of fault zones? Geophysical Journal International, 76(1):157–163, 1984. doi: 10.1111/j.1365-246X.1984.tb05031.x.
- Feng et al. (2019) Feng, X.-T., Gong, Y.-H., Zhou, Y.-Y., Li, Z.-W. and Liu, X.-F. The 3D-printing technology of geological models using rock-like materials. Rock Mechanics and Rock Engineering, 52:2261–2277, 2019. doi: 10.1007/s00603-018-1703-y.
- Fessler et al. (2019) Fessler, G., Sadeghi, A., Glatzel, T., Goedecker, S. and Meyer, E. Atomic friction: Anisotropy and asymmetry effects. Tribology Letters, 67(2):59, 2019. doi: 10.1007/s11249-019-1172-9.
- Filippov and Gorb (2013) Filippov, A. and Gorb, S. N. Frictional-anisotropy-based systems in biology: structural diversity and numerical model. Scientific Reports, 3:1240, 2013. doi: 10.1038/srep01240.
- Filippov et al. (2018) Filippov, A. E., Westhoff, G., Kovalev, A. and Gorb, S. N. Numerical model of the slithering snake locomotion based on the friction anisotropy of the ventral skin. Tribology Letters, 2018. doi: 0.1007/s11249-018-1072-4.
- Gong et al. (2018) Gong, H., Zhu, P., Si, L., Zhang, X. and Xie, G. “M-shape” nanoscale friction anisotropy of phosphorene. Computational Materials Science, 150:364 – 368, 2018. doi: 10.1016/j.commatsci.2018.04.013.
- Grasselli and Egger (2003) Grasselli, G. and Egger, P. Constitutive law for the shear strength of rock joints based on three-dimensional surface parameters. International Journal of Rock Mechanics and Mining Sciences, 40(1):25 – 40, 2003. doi: 10.1016/S1365-1609(02)00101-6.
- Hanaor et al. (2016) Hanaor, Dorian A.H., Gan, Yixiang and Einav, Itai. Static friction at fractal interfaces. Tribology International, 93:229 – 238, 2016. doi: 10.1016/j.triboint.2015.09.016.
- Jin et al. (2012) Jin, K., Tian, Y., Erickson, J. S., Puthoff, J., Autumn, K., and Pesika, N. S. Design and fabrication of gecko-inspired adhesives. Langmuir, 28:5737–5742, 2012. doi: 10.1021/la204040p.
- Kim et al. (2004) Kim, Y.-S., Peacock, D. C.P and Sanderson, D. J. Fault damage zones. Journal of Structural Geology, 26(3):503 – 517, 2004. doi: 10.1016/j.jsg.2003.08.002.
- Li et al. (2020) Li, Y., Tang, C.’A., Li, D. and Wu, C. A New Shear Strength Criterion of Three-Dimensional Rock Joints. Rock Mechanics and Rock Engineering, 53:1477–1483, 2020. doi: 10.1007/s00603-019-01976-5.
- Li et al. (2015) Li, Z., Peng, Z., Ben-Zion, Y. and Vernon, F. L. Spatial variations of shear wave anisotropy near the San Jacinto fault zone in southern California. Journal of Geophysical Research: Solid Earth, 120(12):8334–8347, 2015. doi: 10.1002/2015JB012483.
- Massonnet et al. (1993) Massonnet, D., Rossi, M., Carmona, C., Adragna, F., Peltzer, G., Feigl, K., and Rabaute, T. The displacement field of the Landers earthquake mapped by radar interferometry. Nature, 364:138–142, 1993. doi: 10.1038/364138a0.
- Mitchell and Faulkner (2008) Mitchell, T. M. and Faulkner, D. R. Experimental measurements of permeability evolution during triaxial compression of initially intact crystalline rocks and implications for fluid flow in fault zones. Journal of Geophysical Research: Solid Earth, 113(B11), 2008. doi: 10.1029/2008JB005588.
- Otsubo et al. (2013) Otsubo, M., Shigematsu, N., Imanishi, K., Ando, R., Takahashi, M., and Azuma, T. Temporal slip change based on curved slickenlines on fault scarps along itozawa fault caused by 2011 iwaki earthquake, northeast japan. Tectonophysics, 608:970 – 979, 2013. doi: 10.1016/j.tecto.2013.07.022.
- Peacock and Sanderson (1992) Peacock, D. C.P. and Sanderson, D. J. Effects of layering and anisotropy on fault geometry. Journal of the Geological Society, 149(5):793–802, 1992. doi: 10.1144/gsjgs.149.5.0793.
- Pechmann and Kanamori (1982) Pechmann, J. C. and Kanamori, H. Waveforms and spectra of preshocks and aftershocks of the 1979 imperial valley, california, earthquake: Evidence for fault heterogeneity? Journal of Geophysical Research: Solid Earth, 87(B13):10579–10597, 1982. doi: 10.1029/JB087iB13p10579.
- Pionnier et al. (2018) Pionnier, N., Vera, J., Contraires, E., Benayoun, S., Berger, R., and Valette, S. The effect of the orientation and the height of periodic sub-micrometric texturing on dropwise condensation. Journal of Colloid and Interface Science, 526:184 – 193, 2018. doi: 10.1016/j.jcis.2018.04.043.
- Pollard et al. (1993) Pollard, D.D., Saltzer, S.D. and Rubin, A. M. Stress inversion methods: are they based on faulty assumptions? Journal of Structural Geology, 15(8):1045 – 1054, 1993. doi: 10.1016/0191-8141(93)90176-B.
- Ponson et al. (2006a) Ponson, L., Bonamy, D., Auradou, H., Mourot, G., Morel, S., Bouchaud, E., et al. Anisotropic self-affine properties of experimental fracture surfaces. International Journal of Fracture, 140:27–37, 2006a. doi: 10.1007/s10704-005-3059-z.
- Ponson et al. (2006b) Ponson, L., Bonamy, D. and Bouchaud, E. Two-dimensional scaling properties of experimental fracture surfaces. Phys. Rev. Lett., 96:035506, 2006b. doi: 10.1103/PhysRevLett.96.035506.
- Queener et al. (1965) Queener, C. A., Smith, T. C. and Mitchell, W. L. Transient wear of machine parts. Wear, 8(5):391 – 400, 1965. doi: 10.1016/0043-1648(65)90170-5.
- Quinsat et al. (2018) Quinsat, Y., Lartigue, C., Brown, C. A. and Hattali, L. Characterization of surface topography of 3d printed parts by multi-scale analysis. International Journal on Interactive Design and Manufacturing, 12(3):1007–1014, 2018. doi: 10.1007/s12008-017-0433-9.
- Rawling et al. (2002) Rawling, G. C., Baud, P. and Wong, T.-F. Dilatancy, brittle strength, and anisotropy of foliated rocks: Experimental deformation and micromechanical modeling. Journal of Geophysical Research: Solid Earth, 107(B10):ETG 8–1–ETG 8–14, 2002. doi: 10.1029/2001JB000472.
- Rempel and Rice (2006) Rempel, A. W. and Rice, J. R. Thermal pressurization and onset of melting in fault zones. Journal of Geophysical Research: Solid Earth, 111(B9), 2006. doi: 10.1029/2006JB004314.
- Renard (2020) Renard, F. Fault roughness data [data set]. 2020. doi: 10.11582/2020.00059.
- Renard et al. (2006) Renard, F., Voisin, C., Marsan, D. and Schmittbuhl, J. High resolution 3d laser scanner measurements of a strike-slip fault quantify its morphological anisotropy at all scales. Geophysical Research Letters, 33(4), 2006. doi: 10.1029/2005GL025038.
- Renard et al. (1985) Renard, V., Hekinian, R., Francheteau, J., Ballard, R.D. and Backer, H. Submersible observations at the axis of the ultra-fast-spreading east pacific rise. Earth and Planetary Science Letters, 75(4):339 – 353, 1985. doi: 10.1016/0012-821X(85)90178-5.
- Rice and Ben-Zion (1996) Rice, J. R. and Ben-Zion, Y. Slip complexity in earthquake fault models. Proceedings of the National Academy of Sciences, 93(9):3811–3818, 1996. doi: 10.1073/pnas.93.9.3811.
- Roth-Nebelsick et al. (2012) Roth-Nebelsick, A., Ebner, M., Miranda, T., Gottschalk, V., Voigt, D., Gorb, S., et al. Leaf surface structures enable the endemic namib desert grass Stipagrostis Sabulicola to irrigate itself with fog water. Journal of The Royal Society Interface, 9(73):1965–1974, 2012. doi: 10.1098/rsif.2011.0847.
- Sagy and Hamiel (2017) Sagy, A. and Hamiel, Y. Three-dimensional structure and evolution of an asymmetric pull-apart basin. International Journal of Earth Sciences, 106:1619 – 1630, 2017. doi: 10.1007/s00531-016-1374-4.
- Sagy and Lyakhovsky (2019) Sagy, A. and Lyakhovsky, V. Stress patterns and failure around rough interlocked fault surface. Journal of Geophysical Research: Solid Earth, 124(7):7138–7154, 2019. doi: 10.1029/2018JB017006.
- Satake and Kanamori (1991) Satake, K. and Kanamori, H. Abnormal tsunamis caused by the june 13, 1984, torishima, japan, earthquake. Journal of Geophysical Research: Solid Earth, 96(B12):19933–19939, 1991. doi: 10.1029/91JB01903.
- (63) Sauter. Technical information, Sauter FH-S. Technical report, Sauter. URL https://dok.kern-sohn.com/manuals/files/English/FH-S-BA-e-1819.pdf.
- Seidel and Haberfield (1995) Seidel, J. P. and Haberfield, C. M. The application of energy principles to the determination of the sliding resistance of rock joints. Rock Mechanics and Rock Engineering, 28:211–226, 1995. doi: 10.1007/BF01020227.
- Shea and Kronenberg (1993) Shea, W. T. and Kronenberg, A. K. Strength and anisotropy of foliated rocks with varied mica contents. Journal of Structural Geology, 15(9):1097 – 1121, 1993. doi: 10.1016/0191-8141(93)90158-7.
- Squelch (2017) Squelch, A. 3D printing rocks for geo-educational, technical, and hobbyist pursuits. Geosphere, 14(1):360–366, 2017. doi: 10.1130/GES01364.1.
- Stupkiewicz et al. (2014) Stupkiewicz, S., J. Lewandowski, M. and Lengiewicz, J. Micromechanical analysis of friction anisotropy in rough elastic contacts. International Journal of Solids and Structures, 51(23):3931 – 3943, 2014. doi: 10.1016/j.ijsolstr.2014.07.013.
- Tapia et al. (2016) Tapia, F., Tourneau, D. Le and Géminard, J.-C. Anisotropic friction: assessment of force components and resulting trajectories. EPJ Techniques and Instrumentation, 3:1, 2016. doi: 10.1140/epjti/s40485-016-0029-y.
- Tesei et al. (2014) Tesei, T., Collettini, C., R. Barchi, M., M. Carpenter, B. and Di Stefano, G. Heterogeneous strength and fault zone complexity of carbonate-bearing thrusts with possible implications for seismicity. Earth and Planetary Science Letters, 408:307 – 318, 2014. doi: 10.1016/j.epsl.2014.10.021.
- Tiwari et al. (2016) Tiwari, A., Dorogin, L., Steenwyk, B., Warhadpande, A., Motamedi, M., G., Fortunat, et al. Rubber friction directional asymmetry. Europhysics Letters, 116(6):66002, 2016. doi: 10.1209/0295-5075/116/66002.
- (71) Ultimaker. Technical information, Ultimaker2 Extended+. Technical report, Ultimaker. URL https://ultimaker.com/download/7386/UserManual-UM2Extended-v2.1.pdf.
- Vadacca et al. (2018) Vadacca, L., Colciago, C. Maria, Micheletti, S. and Scotti, A. Effects of the anisotropy of the fault zone permeability on the timing of triggered earthquakes: Insights from 3d-coupled fluid flow and geomechanical deformation modeling. Pure and Applied Geophysics, 175(12):4131–4144, 2018. doi: 10.1007/s00024-018-1936-4.
- Vekinis et al. (1993) Vekinis, G., Ashby, M. F. and Beaumont, P. W. R. Plaster of Paris as a model material for brittle porous solids. Journal of Materials Science, 28:3221–3227, 1993. doi: 10.1007/BF00354239.
- Wang et al. (2017a) Wang, F., Wang, L., Wu, H., Pang, J., Gu, D., and Li, S. A lotus-leaf-like sio2 superhydrophobic bamboo surface based on soft lithography. Colloids and Surfaces A: Physicochemical and Engineering Aspects, 520:834 – 840, 2017a. doi: 10.1016/j.colsurfa.2017.02.043.
- Wang et al. (2018) Wang, J., Stewart, R. R. and Dyaur, N. I. Seismic response analysis of a 3D-printed dual-porosity physical model: Marine case, pages 301–305. Society of Exploration Geophysicist, 2018. doi: 10.1190/segam2018-2997200.1.
- Wang et al. (2017b) Wang, L., Ju, Y., Xie, H., Ma, G., Mao, L., and He, K. The mechanical and photoelastic properties of 3D printable stress-visualized materials. Scientific Reports, 2017b. doi: 10.1038/s41598-017-11433-4.
- Wang and Scholz (1994) Wang, W. and Scholz, C. H. Wear processes during frictional sliding of rock: A theoretical and experimental study. Journal of Geophysical Research: Solid Earth, 99(B4):6789–6799, 1994. doi: 10.1029/93JB02875.
- Wibberley et al. (2008) Wibberley, C. A. J., Yielding, G. and Di Toro, G. Recent advances in the understanding of fault zone internal structure: a review. Geological Society, London, Special Publications, 299(1):5–33, 2008. doi: 10.1144/SP299.2.
- Yu and Wang (2012) Yu, C. and Wang, Q. J. Friction anisotropy with respect to topographic orientation. Scientific Reports, 2:988, 2012. doi: 10.1038/srep00988.
- Zheng et al. (2007) Zheng, Y., Gao, X. and Jiang, L. Directional adhesion of superhydrophobic butterfly wings. Soft Matter, 3:178–182, 2007. doi: 10.1039/B612667G.