11email: oliver.muller@astro.unistra.fr 22institutetext: European Southern Observatory, Karl-Schwarzschild Strasse 2, 85748, Garching, Germany 33institutetext: School of Physics and Astronomy, Cardiff University, Queens Buildings, The Parade, Cardiff,CF24 3AA, UK 44institutetext: Leibniz-Institut für Astrophysik Potsdam (AIP), An der Sternwarte 16, D-14482 Potsdam, Germany 55institutetext: Institute for Astronomy, University of Hawaii, 2680 Woodlawn Drive, Honolulu, HI 96822, USA 66institutetext: Research School of Astronomy and Astrophysics, Australian National University, Canberra, ACT 2611, Australia
The properties of dwarf spheroidal galaxies in the Cen A group:
Dwarf spheroidal galaxies (dSphs) have been extensively investigated in the Local Group, but their low luminosity and surface brightness make similar work in more distant galaxy groups challenging. Modern instrumentation unlocks the possibility of scrutinizing these faint systems in other environments, expanding the parameter space of group properties. We use MUSE spectroscopy to study the properties of 14 known or suspected dSph satellites of Cen A. Twelve targets are confirmed to be group members based on their radial velocities. Two targets are background galaxies at 50 Mpc: KK 198 is a face-on spiral galaxy, and dw1315-45 is an ultra-diffuse galaxy with an effective radius of 2300 pc. The 12 confirmed dSph members of the Cen A group have old and metal-poor stellar populations and follow the stellar metallicity-luminosity relation defined by the dwarf galaxies in the Local Group. In the three brightest dwarf galaxies (KK 197, KKs 55, and KKs 58), we identify globular clusters, as well as a planetary nebula in KK 197, although its association with this galaxy and/or the extended halo of Cen A is uncertain. Using four discrete tracers, we measure the velocity dispersion and dynamical mass of KK 197. This dSph appears dark matter dominated and lies on the radial acceleration relation of star-forming galaxies within the uncertainties. It also is consistent with predictions stemming from modified Newtonian dynamics (MOND). Surprisingly, in the dwarf KK 203 we find an extended H ring. Careful examination of Hubble Space Telescope photometry reveals a very low level of star formation at ages between 30-300 Myr. The H emission is most likely linked to a 40 Myr old supernova remnant, although other possibilities for its origin cannot be entirely ruled out.
Key Words.:
galaxies: dwarf; galaxies: kinematics & dynamics; galaxies: stellar content; galaxies: abundances1 Introduction
Dwarf galaxies make up the bulk of galaxies in the Universe (Binggeli et al., 1990; Ferguson & Binggeli, 1994). Typically, they are defined as galaxies less luminous than mag in the -band (Tammann, 1994; Tolstoy et al., 2009), as galaxies with stellar masses below a few times M⊙ (Bullock & Boylan-Kolchin, 2017; McGaugh et al., 2017), or as galaxies with circular velocities below 100 km s-1 (Lelli et al., 2014). These contraints roughly coincide with the properties of the Small Magellanic Cloud (SMC) and set dwarf galaxies apart from giant galaxies. Dwarf galaxies are separated into gas-rich dwarfs with ongoing star formation – including dwarf irregulars (dIrrs) and blue compact dwarfs (BCDs) – and gas-poor dwarfs with predominantly old stellar populations. The former ones are typically found in the field environment, in galaxy groups, and in the outer parts of galaxy clusters, while the latter are almost exclusively found in galaxy clusters and as satellites of massive spirals and ellipticals (Binggeli et al., 1990; Geha et al., 2012).
For historical reasons, the taxonomy of gas-poor dwarfs is complex (Binggeli, 1994) and includes three common nomenclatures: (i) Dwarf ellipticals (dEs) have been predominantly found in galaxy clusters (Sandage & Binggeli, 1984) and make up the bright end of the dwarf galaxy population from 109 down to 107 ; (ii) dwarf spheroidals (dSphs) have traditionally been studied in the Local Group (Mateo, 1998) and constitute an intermediate luminosity range from 107 to 105 ; and (iii) ultra-faint dwarfs (UFDs) were discovered in the Local Group after the advent of the Sloan Digital Sky Survey (SDSS, York et al. 2000) and other deep optical surveys and represent the faintest galaxies known, with luminosities from 105 to 103 (e.g., Willman et al., 2005; Belokurov et al., 2007; Koposov et al., 2015; Kim & Jerjen, 2015; Mau et al., 2020). All these gas-poor dwarfs, however, form a single sequence in structural diagrams comparing stellar luminosity, effective radius, and effective surface brightness (Tolstoy et al., 2009; Kormendy et al., 2009). In fact, next-generation surveys of the Virgo and Fornax clusters have started to probe gas-poor dwarfs down to luminosities of 10 (Ferrarese et al., 2016; Eigenthaler et al., 2018; Venhola et al., 2019), blurring the traditional difference between cluster dEs and Local Group dSphs.
The most detailed studies of dSphs have been carried out in the Local Group (e.g., Tolstoy et al., 2004, 2009; Koch et al., 2006; Battaglia et al., 2006, 2011; Martin et al., 2008; Tafelmeyer et al., 2010; Kirby et al., 2011; Hidalgo et al., 2013; Weisz et al., 2014; Taibi et al., 2018, 2020), where we can observe their stars down to faint main sequence evolutionary phases and measure individual stellar velocities and their chemical abundances, thereby constraining the formation and evolution of the hosts. Due to their low luminosities and low surface brightnesses, the physical characterization of dSphs beyond the Local Group is inherently difficult. However, as these low-mass systems hold some of the fundamental observational constraints for cosmology (Bullock & Boylan-Kolchin, 2017), there is a growing effort to search for and study them in a range of environments, as enabled by modern, highly sensitive instruments (e.g., Jerjen & Rejkuba, 2001; Rejkuba et al., 2006; Lisker et al., 2008; Da Costa et al., 2010; Lianou et al., 2010; Crnojević et al., 2010, 2011b; Weisz et al., 2011; Ryś et al., 2013; Makarov et al., 2015; Toloba et al., 2015; Stein et al., 2018; Danieli et al., 2019; Müller et al., 2019b; Chilingarian et al., 2019; Bennet et al., 2019; Hamraz et al., 2019; Venhola et al., 2019; Scott et al., 2020; Gannon et al., 2020).
Globular clusters (GCs) do exist in all major galaxies. In the regime of dwarf galaxies, however, the presence of GC systems around them becomes stochastic (e.g., Georgiev et al., 2010). In the Milky Way system, only four dwarf galaxies have a population of old and massive globular clusters. These are the SMC (Mackey & Gilmore, 2003a), the tidally disrupting Sagittarius dwarf spheroidal (Mackey & Gilmore, 2003b), Fornax (Mackey & Gilmore, 2003b), and the ultra-faint dwarf Eridanus 2 (Crnojević et al., 2016b). The remaining dwarfs host no known GCs (Huang & Koposov, 2020). Thus, a key question arises: Are the Milky Way dwarf galaxies a representative sample of the general population of dwarf galaxies (see e.g., Geha et al., 2017)? In galaxy clusters, a plethora of GCs have been found associated with dwarf galaxies (e.g., Strader et al., 2006; Prole et al., 2019; Forbes et al., 2020), with observed numbers of GCs larger than for the Milky Way dwarfs. This is explained by a higher GC formation efficiency in dwarf galaxies living in denser environments (Peng et al., 2008). However, for the intermediate range of galactic environments there is still a lack of data. Surveys like the Mass Assembly of early Type gaLAxies with their fine Structures (MATLAS, Duc et al. 2015) or the Dwarf Galaxy Survey with Amateur Telescopes (DGSAT, Javanmardi et al. 2016) aim to fill this gap by targeting massive elliptical and spiral galaxies in the nearby field ( Mpc).
The closest giant elliptical galaxy to us – Centaurus A (Cen A) at a distance of 3.8 Mpc (Harris et al., 2010) – is the ideal environment for detailed studies of dwarf galaxies since it is possible to investigate their physical properties using both deep imaging observations that resolve individual bright stars (Karachentsev et al., 2002; Rejkuba et al., 2006; Crnojević et al., 2010, 2012, 2019; Müller et al., 2019c) and imaging of their integrated light properties (Crnojević et al., 2016a; Taylor et al., 2016, 2017, 2018; Müller et al., 2017). Regarding spectroscopic observations, the most recent integral-field observations of the two dSphs KKs58 and KK197 in the Cen A group revealed nuclear star clusters (NSCs) and GCs associated with them (Fahrion et al., 2020b). The simultaneous extraction of the metallicity of both the NSC and the galaxy stellar body showed that these NSCs are more metal-poor than their hosts, suggesting that they have formed through the process of in-spiraling GCs. Intriguingly, the masses, sizes, and metallicities of these two NSCs are consistent with the properties of known ultra-compact dwarfs (Misgeld & Hilker, 2011; Voggel et al., 2018, 2020; Fahrion et al., 2019a), suggesting that stripped nuclei of dwarf galaxies are the progenitors of low-mass ultra-compact dwarfs (Strader et al., 2013).
These two dwarf galaxies are part of a larger survey aiming to study the phase-space distribution of the dwarf galaxy satellites around Cen A (Tully et al., 2015; Müller et al., 2016, 2018a). The survey has two main components: (i) deep imaging to resolve individual bright red giant stars and measure distances to dwarf galaxies by means of the tip of the red giant branch (TRGB) method, and (ii) integrated light spectroscopy to measure the dwarfs’ radial velocities. In the first part we used FORS2@VLT to derive accurate distances, thereby also confirming group membership, and measure mean photometric metallicities and structural parameters for nine dwarf satellites of Cen A (Müller et al., 2019c). In this article, we present the MUSE spectroscopic data analysis of 14 putative dwarf galaxies in our survey, study their individual properties, and compare them the to Local Group dwarf galaxies. In a companion paper, we will explore the dynamical properties of the whole satellite system.
2 Observations and data reduction
The data were acquired with the MUSE integral field spectrograph mounted at UT4 of the VLT on Cerro Paranal, Chile (Bacon et al., 2010) as part of a 46 hour program (PI: Müller, proposal ID: 0101.A-0193) designed to measure distances (requiring 26h with FORS2) and line-of-sight velocities (20h with MUSE) of dwarf galaxy candidates. The targets were selected from Müller et al. (2017) and Karachentsev et al. (2004, 2013) as the most likely members of the Cen A group that could be detected by MUSE with reasonable integration times. We used the Wide Field Mode (WFM) of MUSE, providing a field-of-view (FOV) of 1′1′ sampled at pix-1. The observed galaxies have sizes of 1, which fit well in the MUSE FOV. The instrument was used in its nominal wavelength setting covering 480-930 nm with a mean resolution of 3000111The resolving power ranges between 1770 at 480 nm and 3590 at 930nm in the WFM.. Given that our primary goal was to obtain the systemic velocity by binning the signal from the entire target galaxy, it was possible to conduct the observations under relatively poor seeing conditions and sometimes with thin clouds, meaning filler conditions, in service mode between April and June 2018.
Depending on the galaxy’s mean surface brightness we required one or two Observation Blocks (OBs). For eight targets with higher surface brightness, the single OB included four science exposures (), each 500 s long, interleaved with two offset sky exposures () of 250 s. Hence, the OB had the following sequence of exposures: OSO OSO. The other six targets with lower surface brightness had two OBs per target, each with an OSO strategy. In this case, the science and offset exposures had 1160 s and 580 s, respectively. We employed our FORS2 images – where possible – to select empty regions for the offset sky exposures, otherwise we used DECam or DSS images.

The MUSE Internal Data Products are available from the ESO Science Archive, which includes products run through the MUSE pipeline version 2.2 (Weilbacher et al., 2012, 2020). The data have been preprocessed, bias and flat-field corrected, astrometrically calibrated, sky-subtracted, wavelength and flux calibrated (Hanuschik et al., 2017)222see also http://www.eso.org/observing/dfo/quality/PHOENIX/MUSE/processing.html. The sky subtraction makes use of the offset sky exposures. To further reduce the sky residual lines, we applied the Zurich Atmosphere Purge (ZAP) principal component analysis algorithm (Soto et al., 2016). We tested whether the offset sky exposure or empty patches on the science exposure lead to better results in removing sky residuals. For objects having at least 20% of sky in the science exposure, we got better results with these empty patches than using the offset sky exposure, therefore we used the former where applicable. To select the empty sky patches on the science exposures we ran the MTObjects tool (Teeninga et al., 2013, 2015), which creates a segmented fits file with all detected sources. This segmentation map served as input mask for ZAP. In some cases, we also manually masked the outskirts of the target galaxies or undetected objects to further improve the quality of the sky subtraction.
| Name | Observing | Nexp | Exptime | AM | IQ | S/N | Note | ||
|---|---|---|---|---|---|---|---|---|---|
| (hh:mm:ss.s) | (dd:mm:ss) | Date | (s) | (”) | |||||
| (1) | (2) | (3) | (4) | (5) | (6) | (7) | (8) | (9) | |
| KK189 | 13:12:45.1 | 41:49:55 | 7/8 May 2018 | 4 | 500 | 1.07 | 0.7 | 28.5 | thin clouds |
| KKs54 | 13:21:32.3 | 31:53:10 | 7/8 May 2018 | 4 | 500 | 1.09 | 0.7 | 12.1 | thin clouds |
| KK197 | 13:22:01.9 | 42:32:07 | 15/16 Apr 2018 | 2 | 1160 | 1.20 | 1.2 | 27.6 | clear sky |
| 8/9 May 2018 | 3 | 1160 | 1.05 | 1.2 | extra exposure due to thin/thick clouds | ||||
| KKs55 | 13:22:12.4 | 42:43:50 | 19/20 May 2018 | 2 | 1160 | 1.05 | 0.8 | 14.4 | clear/thin |
| 20/21 May 2018 | 2 | 1160 | 1.09 | 0.7 | thin clouds | ||||
| dw1322-39 | 13:22:32.0 | 39:54:19 | 8/9 May 2018 | 4 | 500 | 1.17 | 1.5 | 11.9 | thin clouds |
| dw1323-40b | 13:23:55.0 | 40:50:08 | 5/6 Jun 2018 | 4 | 1160 | 1.11 | 1.3 | 13.1 | thin/clear |
| dw1323-40a | 13:24:53.0 | 40:45:40 | 8/9 May 2018 | 4 | 500 | 1.35 | 1.7 | 9.3 | thin clouds |
| KK203 | 13:27:27.6 | 45:21:08 | 19/20 May 2018 | 5 | 1160 | 1.28 | 0.6 | 24.0 | extra exposure due to a technical issue |
| dw1341-43 | 13:41:36.9 | 43:51:16 | 5/6 Jun 2018 | 4 | 1160 | 1.06 | 1.3 | 12.9 | mostly clear sky |
| KKs57 | 13:41:37.9 | 42:34:54 | 7/8 May 2018 | 4 | 500 | 1.20 | 0.8 | 13.3 | thin clouds |
| dw1342-43 | 13:42:43.9 | 43:15:18 | 11/12 May 2018 | 4 | 500 | 1.16 | 1.4 | 17.8 | clear sky |
| KKs58 | 13:46:00.1 | 36:19:43 | 8/9 May 2018 | 4 | 500 | 1.04 | 1.5 | 17.7 | thin clouds |
| KK198 | 13:22:56.0 | 33:34:21 | 9/10 Jun 2018 | 4 | 500 | 1.09 | 0.8 | — | not Cen A group member; thin clouds |
| dw1315-45 | 13:15:56.0 | 45:45:02 | 7/8 May 2018 | 4 | 1160 | 1.28 | 0.6 | — | not Cen A group member; thin clouds |
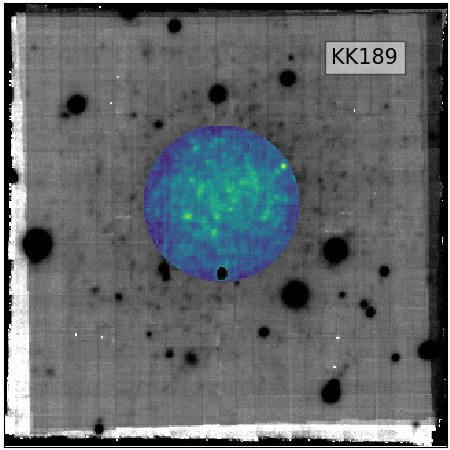
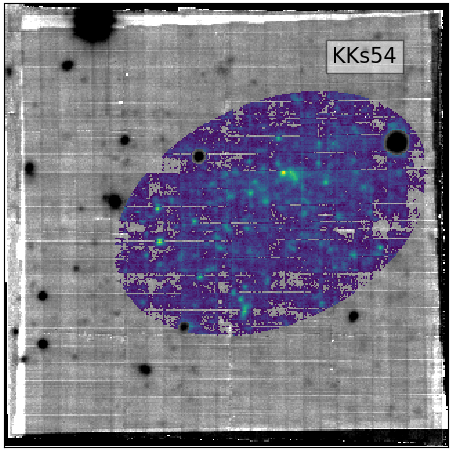
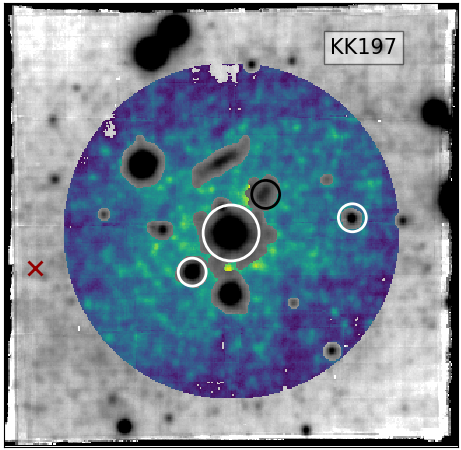
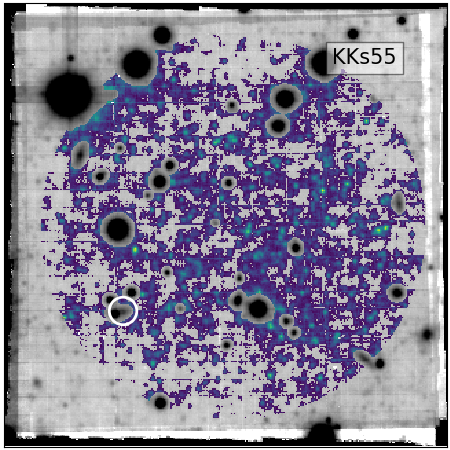
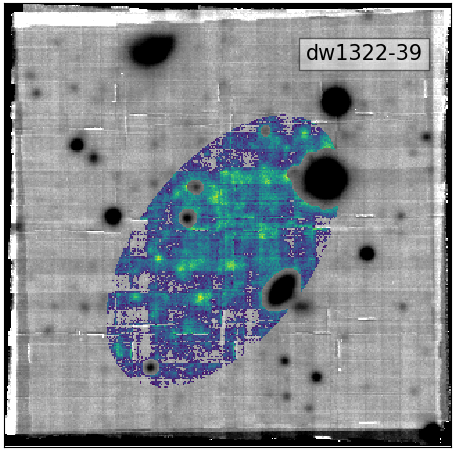
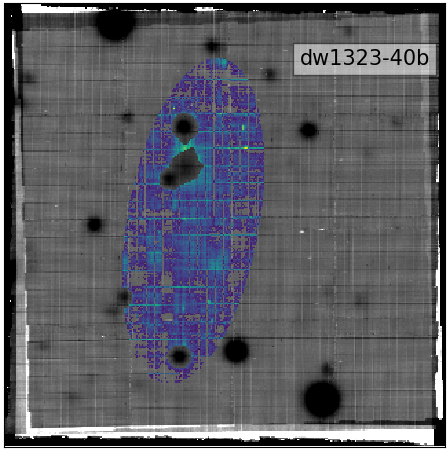
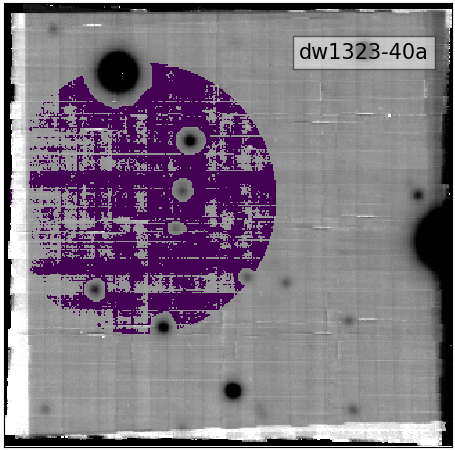
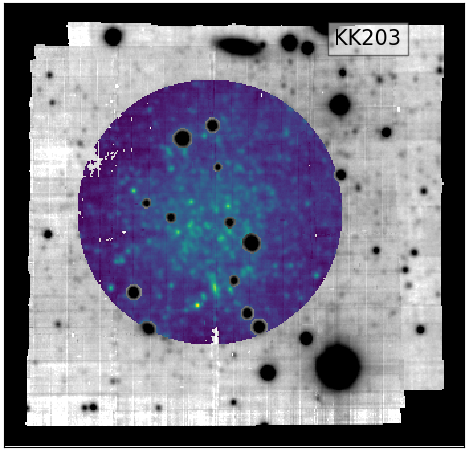
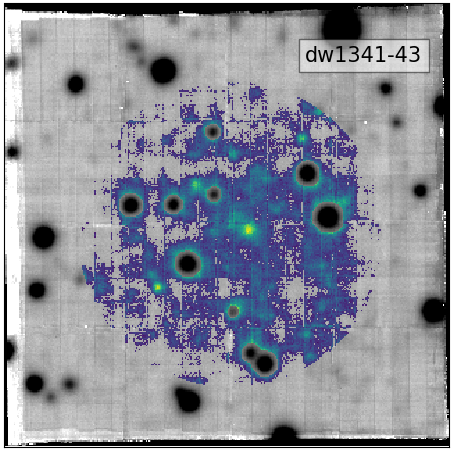
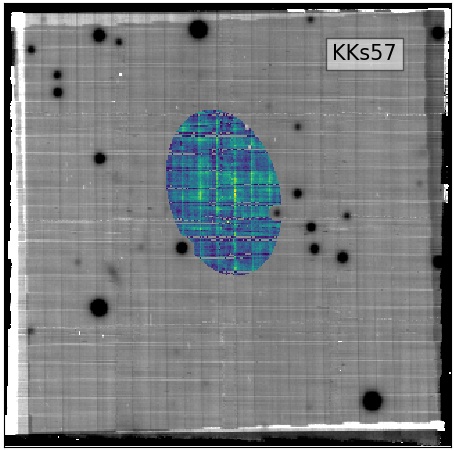
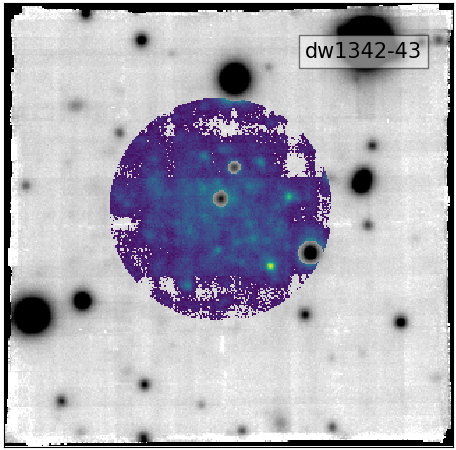
We extracted the integrated spectra using an elliptical aperture, which was derived from the optical images of the galaxies. Foreground stars and background objects were masked using the python implementation sep (Barbary, 2016) of Source Extractor (Bertin & Arnouts, 1996). Furthermore, we masked pixels with negative mean flux as a simple constrain on the signal-to-noise ratio (S/N) per spaxel. The size of the aperture was chosen to optimize the S/N. Fig. 1 shows the white light images with highlighted target extraction areas.
2.1 Radial velocity and stellar population measurements
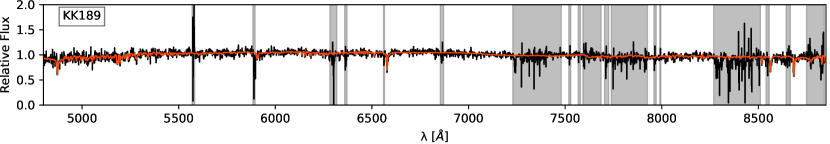
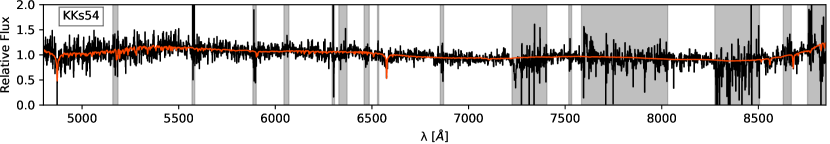
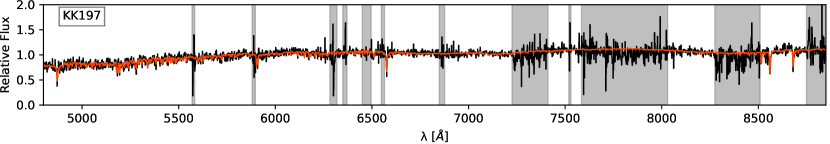
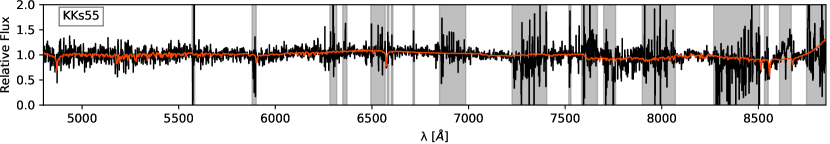
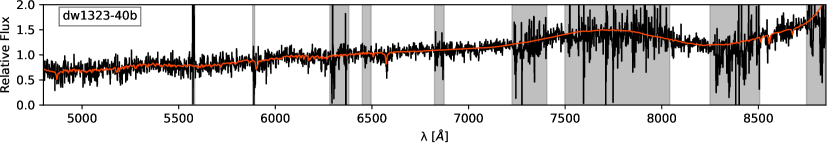
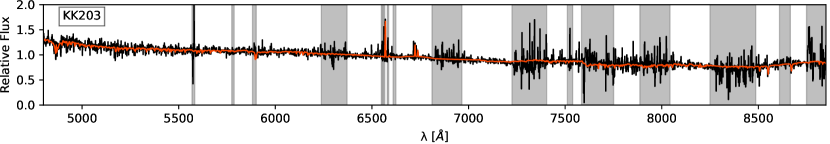
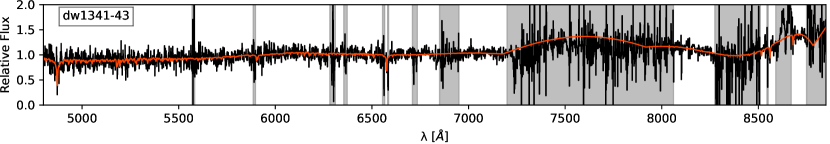
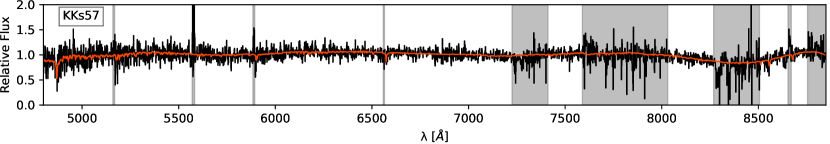
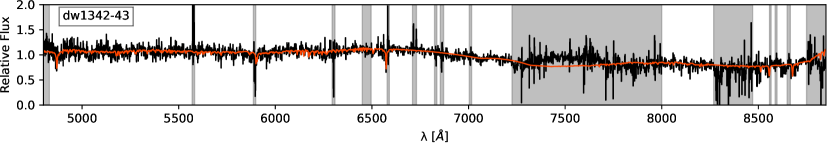
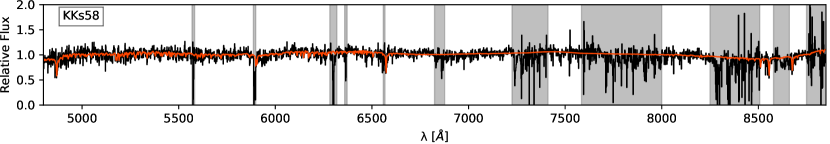
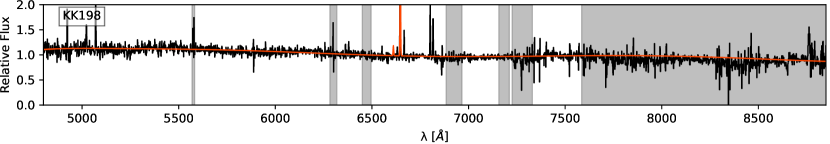
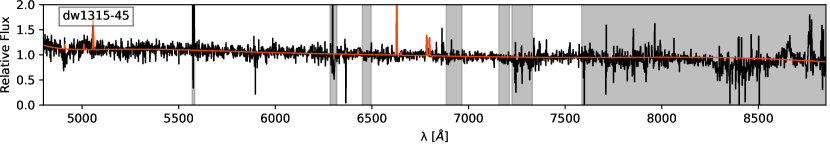
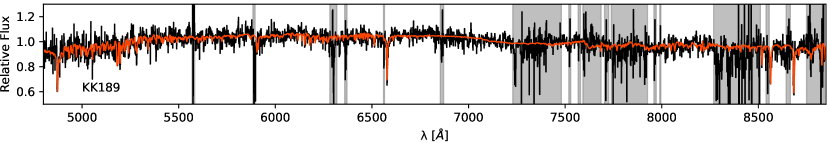
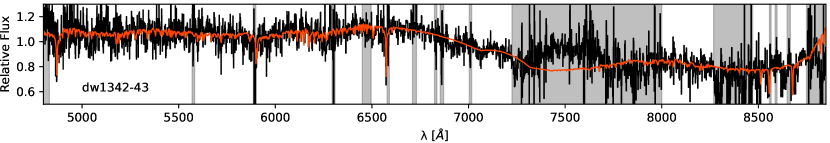
To extract line-of-sight velocities and stellar population properties from the galaxy spectra, we employed pPXF (Cappellari & Emsellem, 2004), a standard routine in fitting line-of-sight velocity distributions from absorption-line spectra. We followed the same methodology as described in several previous studies (Emsellem et al., 2019; Fensch et al., 2019; Müller et al., 2020). In short, we use a set of Single Stellar Population (SSP) spectra from the eMILES library (Vazdekis et al., 2016), with metallicities [M/H] ranging from solar down to 2.27 dex and ages from 70 Myr to 14.0 Gyr. We assume a Kroupa initial mass function (IMF, Kroupa 2001). The spectra from the SSP library are convolved with the line-spread function as described in Guérou et al. (2017, see also the Appendix of ). A variance spectrum was measured on the masked data cube and added to pPXF to improve the fitting. For the kinematic fit, we used 8 and 12 degrees of freedom for the multiplicative and additive polynomials, respectively (Emsellem et al., 2019). For the age and metallicity fits, we fixed the velocity and used no additive polynomials, but kept the 12th degree in the multiplicative polynomial (Fensch et al., 2019). Then we used the weights provided by pPXF to derive the mean metallicities and mean ages from the SSP models for each galaxy. Similarly, we calculated the stellar mass-to-light ratio from the weights given by pPXF and the photometric predictions from the eMILES library (Vazdekis et al., 2010) in the -band. Fig. 2 shows the spectra and the best pPXF fits for three dwarfs. To improve the fits, we masked the remaining sky lines, which were not removed by ZAP. The errors on the best-fit parameters were estimated with a Monte Carlo method where we reshuffle the residuals in a bootstrap approach. The 16 and 84 percent interval (1 in frequentist statistics) give the uncertainty. The S/N ratio per pixel is measured in a region between 6600 and 6800 devoid of strong absorption or emission lines. It is calculated as the mean fraction between the flux and the square root of the variance. The variance itself has to be multiplied with the value estimated by pPXF.
A note on the velocity extraction of KK 197 and KKs 58. In Fahrion et al. (2020b) we derived for these two galaxies line-of-sight velocities of 643.23.5 km/s and 482.612.6 km/s, respectively. This differs slightly from the values measured here, due to a different set of SSP models used, as well as different ways of extracting the spectra from the cube. However, the values here and the values in Fahrion et al. (2020b) are consistent within 1. The same goes for the the metallicities and ages. In Fahrion et al. (2020b) we estimated a slightly more metal-rich (0.840.12 dex and 1.350.23 dex) and younger (101.0 Gyr and 7 Gyr) population than we estimate here. For the metallicity, this is within 3 and 1, respectively. The age estimation from data with a low S/N ratio is highly uncertain, therefore a discrepancy within a few Gyr is not uncommon.
2.2 Globular clusters and planetary nebulae detection
To search for any GCs, we identified all the point sources with Source Extractor and extracted their spectra. For this purpose, we created a 2D image by collapsing the cube along the wavelength axis. We then inspected all the individual spectra to create a catalog of GCs. Two of our galaxies – KKs 58 and KK 197 – have already been analyzed in Fahrion et al. (2020b). These two dSphs contain a NSC, and KK 197 furthermore hosts two GCs and an extended stellar association. Here, we find one new GC in KKs 55, which is also visible in Hubble Space Telescope (HST) images available for this galaxy. For the remaining dwarfs, the data is either too shallow or there are simply no GCs within the MUSE FOV.
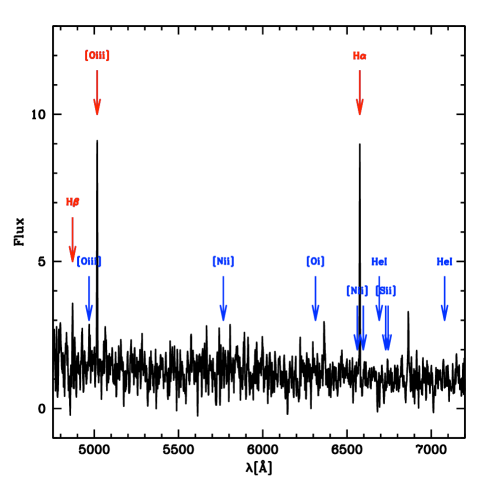
Furthermore, we searched the MUSE cubes for planetary nebulae (PNe) that might serve as additional kinematic tracers. For this purpose, we derived a narrow band image for each galaxy at the expected redshifted position of the [OIII]5007 Å emission line. By subtracting this narrow-band image from a collapsed image of the nearby stellar continuum, PNe should stand out as residual point sources. Using this approach we detected one PN in KK 197 at the following location: 13:22:04.51/42:32:14.09, which is 0.5 arcmin from the center of the galaxy. Its spectrum is shown in Fig. 5 indicating the location of typical emission lines shifted to the velocity of the object. Only the strongest emission lines are visible due to too low S/N. The other galaxies either contain no PNe within the MUSE FOV, or the data is too shallow to detect them.
3 Results
In this section, we discuss the overall properties of the stellar populations of the observed dwarf galaxies (Sect. 3.1). Our radial velocity measurements confirm the Cen A group membership for 12 out of 14 targets. Then, we look into their GC and PNe population (Sect. 3.2 and 3.3) and derive the velocity dispersion and dynamical mass of KK 197 (Sect. 3.4) using these discrete tracers. We also report the surprising discovery of a heart-shaped extended H ring in the dSph KK 203 (Sect. 3.5).
3.1 Properties of the stellar populations
| KK 189 | KKs 54 | KK 197 | KKs 55 | dw1322-39 | dw1323-40b | dw1323-40a | KK 203 | dw1341-43 | KKs 57 | dw1342-43 | KKs58 | |
| (km s-1) | ||||||||||||
| [Fe/H] (dex) | ||||||||||||
| age (Gyr) | ||||||||||||
| MV/LV | ||||||||||||
| MV (mag) | ||||||||||||
| (arcsec) | 14.4 | 16.6 | 44.4 | 36.4 | 20.7 | 17.1 | 15.2 | 19.8 | 20.2 | 12.0 | 15.5 | 26.4 |
| (mag/) | 24.5 | 25.6 | 24.8 | 25.5 | 25.9 | 26.1 | 25.4 | 24.6 | 26.2 | 24.8 | 25.5 | 24.6 |
The integrated spectra of the 12 dSphs (see, e.g., Fig. 2) display several absorption features and no strong emission lines, as expected for passive galaxies dominated by old stars. The velocities derived from these absorption lines are consistent with the velocity range of the Centaurus group (Müller et al., 2018a). The pPXF fits indicate that these spectra are consistent with old ( Gyr) and metal poor ( dex) stellar populations. For an accurate estimation of the weighted mean ages of the stellar populations, however, we would need high S/N ratios (see Fig. 1 in the Appendix of Fahrion et al. 2019b for the required S/N ratios for measuring velocities, metallicities, and ages with E-MILES SSP templates), which is not reached here. Nevertheless, we have estimated ages for all the objects and where pPXF did not converge to a single value, we give the 80% bounds. All the properties of the dwarfs are compiled in Table 2, but the mean stellar ages should be taken with a grain of salt. It is interesting to note that for the dwarf galaxy with one of the highest S/N ratio – KK 203 – we find the youngest age ( Gyr). For two targets we measure strong emission lines, for which the derived velocities put them far in the background (see Appendix B).
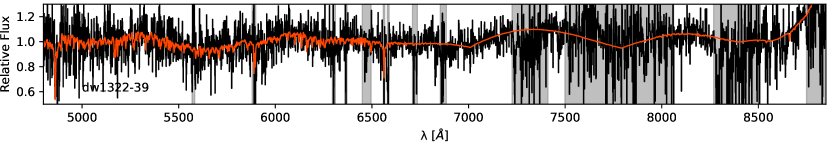
Dwarf galaxies in the Local Group follow several scaling relations (Martin et al., 2008; Kirby et al., 2013). One of the most important is the stellar metallicity-luminosity relation. In Fig. 3 we investigate this relation for our 12 dSphs and compare them with a compilation of Local Group and nearby galaxies from McConnachie (2012), as well as with previously studied dwarfs in the Cen A group (Rejkuba et al., 2006; Crnojević et al., 2010, 2012, 2019; Müller et al., 2019c). We note that the mean metallicity for these different samples is based on several different techniques. The extended catalog from McConnachie (2012) includes metallicity measurements based on photometric methods such as RGB colors, isochrones fitting, or full CMD fitting, as well as spectroscopic metallicities from low-resolution Ca triplet or from spectral synthesis based on medium to high-resolution spectra. The latter measurements are based on observations of individual stars and it is interesting therefore to compare alongside with the mean metallicity of Cen A dwarfs obtained from resolved stellar population studies (Rejkuba et al., 2006; Crnojević et al., 2010, 2012, 2019; Müller et al., 2019c), as well as integrated light analysis with MUSE. The dwarf galaxies of the Cen A group follow the same stellar metallicity-luminosity relation as dwarf galaxies in the Local Group (Fig. 3). While the MUSE spectroscopic metallicities lie exactly on top of the McConnachie (2012) metallicity-luminosity relation, there is a much larger scatter for photometric measurements. This is not surprising because at the distance of the Cen A group, only few magnitudes of the upper RGB can be resolved, and from optical photometry it is impossible to distinguish between 5 and 10 Gyr old RGB stars. The age-metallicity degeneracy and possibly incorrect assumptions for the uniform old ( Gyr) age of the population lead to larger uncertainties in photometric metallicities. Furthermore, a systematic offset in metallicity scale may result from a choice of a specific isochrone set or empirical RGB calibration (Rejkuba et al., 2014; Streich et al., 2014).
3.2 Globular clusters properties
In our sample of 12 dwarf galaxies, three host stellar clusters: KK 197, KKs 55, and KKs 58. Fahrion et al. (2020b) analyzed two GCs, one NSC, and one extended stellar association in KK 197 and one NSC in KK 58. Around KKs 55, Georgiev et al. (2010) found one GC based on deep HST data that lies outside the MUSE FOV. For this galaxy, we discovered an additional GC in the MUSE data that is visible in the HST data as well, although it can easily be confused with a background galaxy shining through KKs 55. Its spectrum unambiguously confirms the association with the dwarf galaxy. The coordinates for this new GC are RA=13:22:13.869 and Dec=42:44:05.04. Performing simple aperture photometry on the HST data we derive apparent magnitudes of mag and mag in the Vega system. With a distance modulus of 27.93 mag (Karachentsev et al., 2013), this gives extinction corrected absolute magnitudes of mag and mag, respectively, with a color of mag. From the MUSE spectrum, we determined a velocity of km s-1, a metallicity of dex, a mean age of Gyr, and a mass-to-light ratio of M⊙/L⊙. This GC seems to be more metal-poor than the stellar population of its host dwarf galaxy ([M/H] dex).
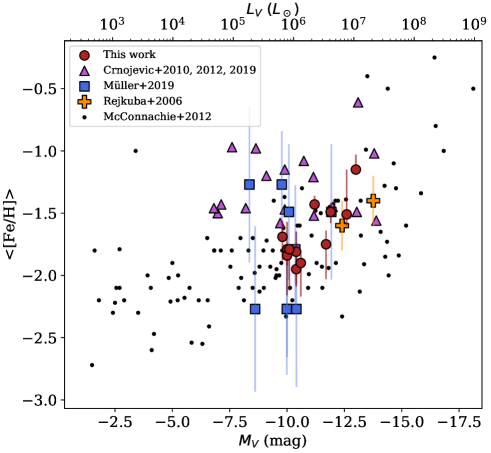
To characterize the GC systems, we derived the specific frequency (Harris & van den Bergh, 1981) for each dwarf. The results are presented in Fig 4. Where no GC is detected, is assigned a value of zero, although it is possible that some GCs are outside the MUSE FOV or are too faint to be detected in our data. For KK 197 and KKs 58, the are 18.2 and 16.9, respectively (Fahrion et al., 2020b), and for KKs 55 it is 17.9. These numbers are compatible with the specific frequencies of dwarf galaxies from the Local Group (Grebel, 2016) and other nearby dwarf galaxies (Georgiev et al., 2010; Harris et al., 2013), as well as dwarf galaxies in clusters (Lim et al., 2018; Prole et al., 2019; Saifollahi et al., 2020), but we note that the has a significant scatter in the classical dwarf galaxy regime.
3.3 Planetary nebula properties
Do we expect to find PNe in our dwarf galaxies? Considering the small number of PNe in Local Group dwarfs, we expect very few PNe in our sample (Reid, 2015). The number of PNe scales with the total sampled luminosity as (Buzzoni et al., 2006). There is a considerable uncertainty in theoretical predictions for the value of , which depends on the PN lifetime and specific evolutionary flux (i.e., how many PNe are produced per simple stellar population luminosity), which in turn depends on the star formation rate and metallicity of the population. The Local Group PN census confirms theoretical expectations that metal-poor populations host fewer PNe. For example for the SMC metallicity of dex Reid (2015) derived L⊙. Some of our dwarfs are significantly more metal-poor than the SMC and similar to Local Group dSph that have no known PN. Hence, it is not surprising that we only detect one PN, which is potentially associated with the brightest dwarf in our sample: KK 197.
In Fig. 5 we present the spectrum for this PN and indicate the typical emission lines of PNe. There is clear [OIII] and H emission and likely H emission. The line-of-sight velocity of the PN from the emission lines ( km s-1) differs by about 55 km s-1 from the systemic velocity of KK 197 measured from the stellar absorption lines in the same datacube ( km s-1), which may be interpreted as a real physical association. However, it is also possible that the PN is associated with Cen A itself and appears in the MUSE FOV only by chance, as the PNe population of the Cen A halo extends to the position of KK 197 (Walsh et al., 2015). With an offset of 50 km s-1 to the mean of the PNe population ( km/s) it is entirely plausible that the PN is an interloper, since the standard deviation of the 1107 PNe studied in Walsh et al. (2015) is 141 km s-1.
3.4 Internal dynamics of KK 197
The simultaneous extraction of the spectrum of the stellar body of a galaxy and the spectra of its associated star clusters makes it possible to estimate the galaxy’s velocity dispersion555To directly measure the velocity dispersion of the stellar body, we would need deeper data. See for example Emsellem et al. (2019) for a study with MUSE of the velocity dispersion measured on the spectra of a comparable dwarf galaxy. and therefore probe its dynamical mass and dark matter content (e.g., van Dokkum et al., 2018, 2019; Martin et al., 2018; Müller et al., 2020). More and more such studies are now conducted in the dwarf galaxy regime. A reliable dynamical mass estimate, however, requires the presence of multiple kinematic tracers of the underlying gravitational potential, such as GCs or PNe (Côté et al., 2001; Pota et al., 2013; Forbes et al., 2017; Laporte et al., 2019; Fahrion et al., 2020a). For the brightest galaxy in our sample – KK 197 – five discrete tracers are available. For the detailed methodology, we refer to Müller et al. (2020). The tracers are listed in Table 3.
| Name | ||
|---|---|---|
| (km/s) | (km/s) | |
| KK197 | 642.7 | 2.9 |
| KK197-NSC | 635.4 | 1.5 |
| KK197-1 | 636.4 | 16 |
| KK197-3 | 642.6 | 3.8 |
| KK197-SA | 619.3 | 10.3 |
| KK197-PN | 588.4 | 2.5 |
In short, we used a Markov Chain Monte Carlo (MCMC) approach with the logarithmic likelihood function given as
| (1) |
where is the number of tracers, is the observed line-of-sight velocity of an individual tracer , is the systemic velocity of the whole system, and is the observed velocity dispersion given by a combination of the true velocity dispersion and the observational uncertainties:
| (2) |
The two variables and are the parameters we are interested in. A non-informative prior is imposed to suppress a too small velocity dispersion (Agnello & Bruun in prep.):
| (3) |
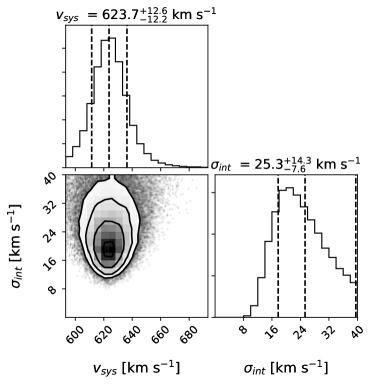
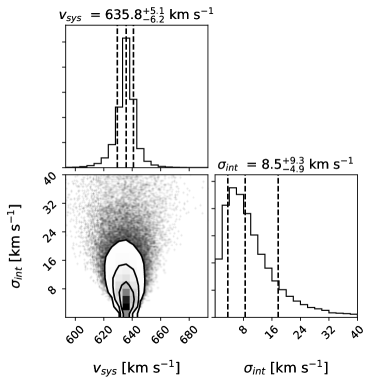
where is the mean velocity error. We used 100 walkers with a chain length of 10000 each. The sampled posterior distribution is shown in Fig. 6 for two different cases: considering the newly discovered PN bound to KK 197 (left, with ) or assuming it is an interloper associated with Cen A (right, with ).
From a dynamical perspective, it is very unlikely that the PN belongs to KK 197 because the line-of-sight velocity difference of 55 km s-1 to the putative host is comparable to the inferred escape velocity when the PN is included in the estimate of ( km s-1) and much larger when the PN is excluded ( km s-1). Moreover, the systemic velocity of KK 197 from the stellar absorption lines ( km s-1) is closer to the maximum-likelihood value of when the PN is excluded ( km s-1) rather than when it is included ( km s-1). In the following, for the sake of completeness, we provide dynamical mass measurements using both values of but the one excluding the PN should be considered more reliable despite the lower number of kinematic tracers.
From the intrinsic velocity dispersion, the dynamical mass enclosed within the de-projected half light radius can be estimated using the following formula (Wolf et al., 2010):
| (4) |
with . The resulting dynamical mass within is M⊙ considering only the GCs and M⊙ including the uncertain PN. To estimate the dynamical mass-to-light ratio, we transform the -band magnitude of KK 197 into solar luminosities. This gives M⊙/L⊙ and M⊙/L⊙ excluding and including the PN, respectively.
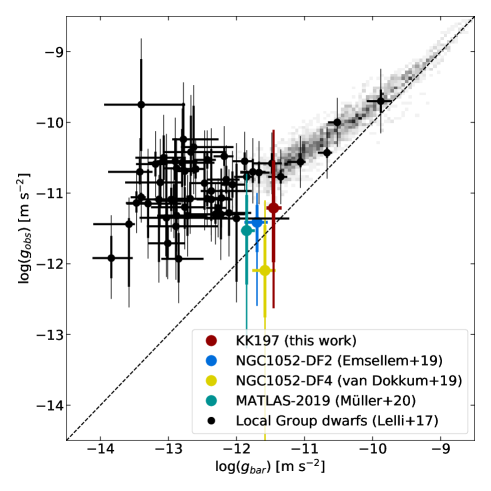
The dynamical mass-to-light ratios of galaxies are known to anti-correlate with galaxy luminosity and surface brightness (e.g., McGaugh & de Blok, 1998). A more comprehensive representation of galaxy dynamics is offered by the radial acceleration relation (RAR, Lelli et al. 2017), in which the observed kinematic acceleration is compared to the Newtonian gravitational field from the baryonic mass distribution. If the data follows the line of unity, the observed dynamics can be fully explained by the visible matter. If the observed acceleration is larger than the one caused by the baryons, an additional gravitational component (i.e., dark matter), is necessary.
For spherical, pressure-supported systems, the observed acceleration can be computed as
| (5) |
and the baryonic gravitational field is given by
| (6) |
where is the stellar mass-to-light ratio. From the spectroscopy of KK 197, we measured . Fig. 7 shows the location of KK 197 on the RAR established using rotation-supported disk galaxies (gray color scale) together with measurements of other pressure-supported dwarf galaxies from the literature. KK 197 follows the same RAR as rotation-supported galaxies within 2, independently of whether we include or exclude the PN in the estimate of the velocity dispersion.
The dynamics of dwarf galaxies can be used to test alternative gravity models like modified Newtonian dynamics (MOND, Milgrom 1983, see also its review by Famaey & McGaugh 2012). In MOND, rather than adding dark matter to a galaxy to explain the high dynamical mass-to-light ratio, the law of gravity is modified such that the baryons produce the dark matter-like behavior. Due to the nonlinear modification of the Poisson equation in MOND, a so-called external field effect (EFE, see e.g., Haghi et al. 2019) emerges when the galaxy is embedded in an external gravitational field. If the internal acceleration is stronger than the external one, the galaxy can be treated as in isolation, however in the opposite case the EFE has to be considered and it will lower the expected internal acceleration. (Kroupa et al., 2018; Famaey et al., 2018)
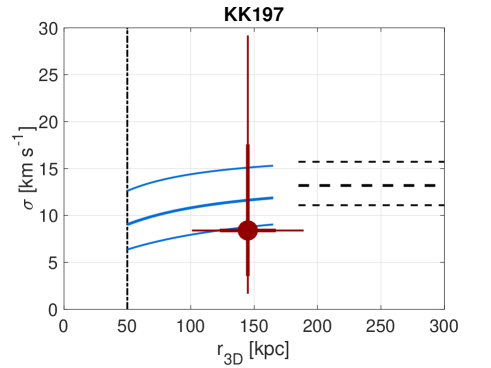
Following the methodology presented in Müller et al. (2019a), we calculated the velocity dispersion for KK 197 as a function of its 3D separation to Cen A. The measured separation is kpc (Karachentsev et al., 2007, 2013).
In Fig. 8, we present the MOND prediction and compare it to the observations. In isolation, the expected velocity dispersion is km s-1. However, at this 3D separation from Cen A, the galaxy is already affected by the EFE, lowering the expected velocity dispersion to km s-1.
This prediction is in close agreement with the measured velocity dispersion of km s-1 when the PN is excluded, as it is likely associated with Cen A. When the PN is included in the fit, the measured dispersion increases to km s-1 (i.e., a 2 tension with the predicted MOND value).
3.5 H emission of KK 203
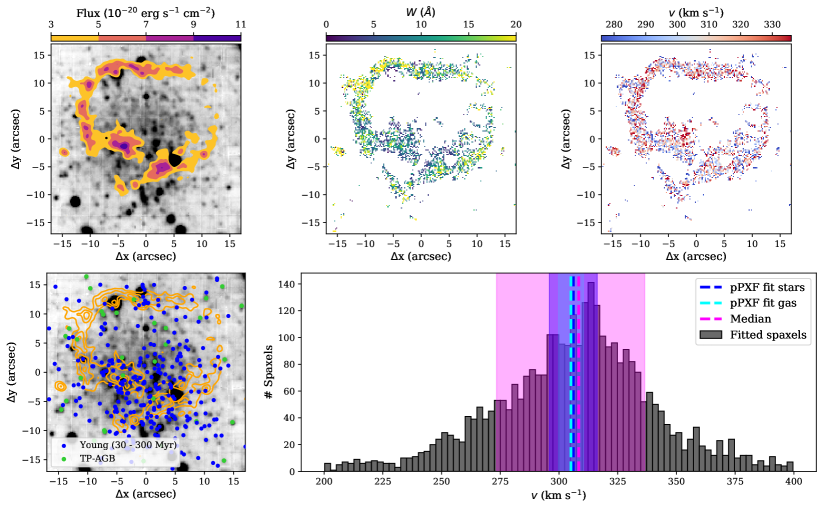
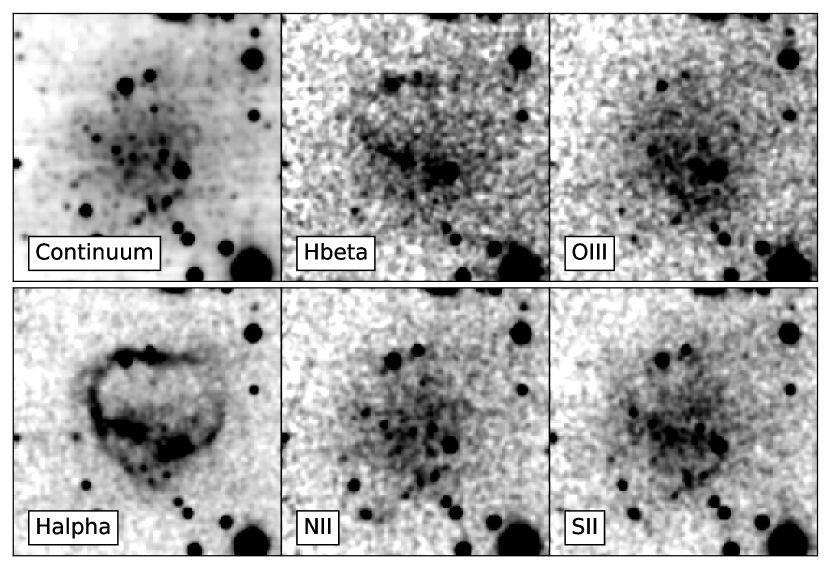
Unexpectedly, in the spectrum of one of the dSphs (KK 203) we detected conspicuous H emission, forming an extended heart-shaped region around the galaxy (see Fig. 9). This seems to be a continuous ring, somewhat off-centered from the galaxy, with a diameter of 24′′ (440 pc). On average, the H velocities obtained from fitting individual spaxels are well in agreement with the systemic velocity of KK 203, making their physical association extremely likely. Only H and perhaps H emissions are detected forming this ring, other potential emission lines do not stand out above the continuum of the galaxy (see Fig 10).
Where does this H emission come from? H emission is typically associated with the presence of star formation, AGN, or shocks. In late-type spiral galaxies, on the order of 50% of H emission is coming from a warm diffuse component of the interstellar medium (ISM, Oey et al. 2007), which can be ionized by photons leaking from HII regions, evolved field stars, shocks, or cosmic rays. This so-called diffuse interstellar gas (DIG) or warm ionized medium is also observed in early-type galaxies (Phillips et al., 1986; Martel et al., 2004; Jaffé et al., 2014). The DIG has a lower electron density, higher electron temperature, and enhanced line ratios between collisionally excited and recombination lines when compared to HII regions. Unfortunately, the lack of unambiguous detection of forbidden emission lines such as [SII] and [NII] within the same heart-shaped ring region means that we cannot use the usual diagnostics based on integrated spectra (Levesque et al., 2010; Kewley et al., 2019).
There is no detection of neutral hydrogen in HIPASS at the location of KK 203 (Barnes et al., 2001), so the amount of cold gas (the fuel for any potential star formation) is rather low as expected for a dSph galaxy. However, the non-detection might also be due to the fact that the dwarf is smaller than the HIPASS spatial resolution element (15 arcmin) and that the HIPASS detection limit is around M M⊙ for dwarf galaxies in the Centaurus group (Müller et al., 2017).
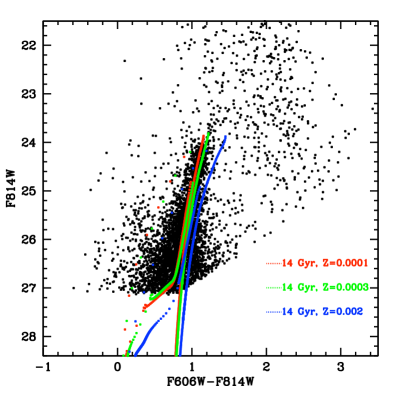
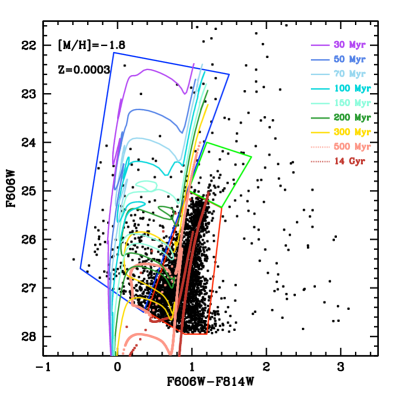
There are no obvious individual HII regions detected in the MUSE data-cube. To ensure that we are not missing a possible low fraction of young or intermediate-age stars due to relatively low S/N of our spectroscopic data we carefully examined the available optical imaging from the HST archive. Based on DOLPHOT PSF fitting photometry (Dolphin, 2016) applied to the ACS@HST images (HST program 13442, PI: Tully) we derive (wide -band) versus (equivalent to ) color-magnitude diagram (CMD) shown in Fig. 11. We first verified that the bulk of the stars in the CMD is well fit with an old and metal-poor population by overlaying 14 Gyr BASTI solar-scaled isochrones (Pietrinferni et al., 2004) with metallicities that bracket the mean value derived from the MUSE spectrum. We find an excellent agreement between spectroscopic metallicity from the integrated MUSE spectrum and the photometric metallicity from the color of the red giant branch (RGB) sequence.
The foreground MW stars are primarily found at , which is redder than most of the KK 203 stars, but some compact blue galaxies may contaminate star counts at and , where young stars of KK 203 are located. We cleaned the CMD from foreground/background stellar sources by applying statistical subtraction from a neighboring patch of the sky selected in the same image (see Müller et al., 2018b, for more details). The cleaned CMD still presents an excess of blue stars. The detection limit at mag, visible as a diagonal limit in the versus CMD (right panel of Fig. 11), implies that main sequence stars with ages older than Myr are not observable. The right panel of Fig. 11 shows the statistically cleaned CMD with the solar-scaled BASTI isochrones for [M/H]= dex and a range of ages. It shows that evolved supergiants younger than Myr can be detected. Their short evolutionary lifetime leads to a relatively sparsely populated CMD area on the blue side of the RGB. We verified by overplotting more metal-rich isochrones that there are likely no stars younger than Myr present in KK 203 and that stars indicated in the blue selection box span a range of ages between 30-300 Myr. Due to the age-metallicity degeneracy in the photometric bands it is not possible to assign unambiguous ages to these blue stars. Deeper observations are needed to constrain the metallicity and thus derive more accurate ages for at least a handful of brightest supergiants. Such data could be obtained with adaptive optics assisted MUSE observations (e.g., Della Bruna et al., 2020).
In Fig. 11 we identify regions of the CMD according to age: the RGB (red) contains predominantly old stars, the green area indicates the region where intermediate-age thermally pulsing asymptotic giant branch (TP-AGB) stars are located, and we show young supergiants in the blue selection box. After selecting stars on the statistically cleaned CMD of KK203 according to region, we plot them on top of the MUSE white-light cube image with color coding of dots reflecting the CMD region color (except for RGB stars), and overplotting in cyan contours the H gas (bottom left panel in Fig. 9). The youngest stars are most centrally concentrated and are displaced southwards with respect to the galaxy center. Our conclusion from the analysis of the HST data is that, although there are some young stars with ages between 30-300 Myr, the low-level star formation is likely not sufficient to photoionize the extended H emission in a ring surrounding KK 203.
Another common source of H emission in massive galaxies is represented by supermassive black holes powering active galactic nuclei (AGN). In this case, however, we would expect the H emission to be concentrated toward the galaxy center rather than forming an extended ring. Unfortunately, given the low metallicity of the galaxy, we do not detect oxygen and nitrogen emission lines, which could have been used to build BPT diagrams (Baldwin et al., 1981) and study the nature of the radiation field.
Another possibility is that the H emission comes from winds of AGB and post-AGB stars or young supergiants. For this purpose, we have used the HST photometry of this galaxy, plotted all potential AGB stars (extending the TRGB to brighter magnitudes) and post-AGB and supergiant stars (bluer than the RGB branch) over the collapsed MUSE cube, and compared it to the H emission. The candidate AGB stars are roughly uniformly distributed over the galaxy, whereas the candidate bluer stars are somewhat clustered toward the southwest, overlaying at least partially with the southern part of the H ring. However, there is no clear correlation between these stars and the H ring, especially for the northern part. If we reverse the approach and use the H ring as a mask to select the stars in the CMD, mainly RGB stars are selected. This indicates that there is no evidence for a connection between AGB or post-AGB stars and the H ring.
Could the H emission have an external or environmental origin? One possibility is that some interstellar gas in KK 203 is excited by an exterior radiation field, namely that of Cen A. The 3D separation between Cen A and KK 203 is 230 kpc. This seems to be at a distance from Cen A where the radiation density is too low for exciting/shocking the gas in the dwarf. Perhaps KK 203 had a closer passage to Cen A in the past and its interstellar medium was tidally shocked, so what we see in H is the aftereffect of this encounter. A more speculative idea is that KK 203 has accreted a much smaller dwarf galaxy or DM halo with some diffuse ionized gas, so the ring would represent a gaseous stream.
Yet another explanation could be that we see an old supernova remnant (SNR). Karachentsev & Kaisin (2020) conducted an H survey in dwarf galaxies with the 6-m BTA telescope of the Special Astrophysical Observatory. In their sample of 309 irregular and transitional type dwarf galaxies a number of different emission features were uncovered. Among them, there were so-called B-bubbles, which they describe as ring-like structures similar to SNRs. About 17% percent of their dwarf galaxies contained such B-bubbles with an average diameter of 120-240 pc, which is somewhat smaller than what we observe here (we note though that Karachentsev & Kaisin (2020) simply assumed a distance of 5 Mpc for all their targets and transformed the average angular size into a physical one, but also none of them is as large as the ring around KK 203, private communication with I. Karachentsev). Evans et al. (2019) found two bubbles reminiscent of the one discovered here in the nearby dIrr Leo P (see their Fig. 10). To confirm whether this heart-shaped ring in KK 203 is an SNR, one would need to use the emission line ratios as diagnostics (Moumen et al., 2019), for which our current observations are too shallow. Moreover, given the low metallicity of the system, it is unclear whether deeper observations could be able to detect other gas emission lines beyond the Balmer series of atomic hydrogen. An SNR is the most satisfactory explanation for the following reason. Assuming that the SNR expanded with a constant velocity of 100 km s-1 (Kirshner & Taylor 1976), it would have needed years to expand into its current form. This is consistent with the age of some of the brightest blue and red supergiants observed in the HST CMD (right panel of Fig. 11).
4 Summary and conclusions
We used MUSE spectroscopic observations to study the properties of a sample of dSphs in the Cen A galaxy group. Out of the 14 targeted objects, only two were revealed to be background galaxies based on their redshifts of 0.01. The remaining galaxies have been confirmed as Cen A members based on their line-of-sight velocities. We found the following results:
-
1.
The integrated spectra of these 12 dSphs are consistent with old and metal-poor stellar populations, as expected from observations of dSphs in the Local Group. Moreover, the dSphs in the Cen A group follow a similar stellar metallicity-luminosity relation as dwarf galaxies in the Local Group.
-
2.
For the three brightest dSphs in our sample (KK 197, KKs 55 and KKs 58), we found associated GCs. The specific frequency of GCs for these three dwarfs is around 18, which falls on the expected range from previous studies of other nearby galaxies.
-
3.
We found a PN near the dwarf galaxy KK 197, revealed by its strong [OIII] and H emission lines. It is quite likely, however, that this PN belongs to the outer halo of Cen A based on dynamical considerations.
-
4.
For the brightest dSph – KK 197 – we estimated the intrinsic velocity dispersion using discrete tracers. Depending on whether the PN is considered or not, the velocity dispersion ranges from 8.5 to 25.3 km s-1 and the corresponding dynamical mass-to-light ratio from 4 to 37 M⊙/L⊙.
-
5.
KK 197 lies on the same radial acceleration relation of rotationally supported galaxies within the errors. The measured velocity dispersion also agrees with the MOND prediction.
-
6.
For one of our dSphs – KK 203 – we found a surprising H emission, which forms a 400-pc wide, heart-shaped ring. The H emission is not powered by recent star-formation. Its origin remains unclear but several possibilities are discussed, including a central supermassive black hole, AGB and post-AGB stars, a Myr old supernova remnant, or past interaction/accretion events. Our favorite interpretation is that H is powered by an SNR, but deeper data are necessary to establish that on a firmer ground.
In a companion paper, we use the measured line-of-sight velocities of these 12 dSphs to study the overall dynamics of the Cen A group and, in particular, to confirm or disprove the presence of a rotating satellite system (Müller et al., 2018a).
Acknowledgements.
We thank the referee for the constructive report, which helped to clarify and improve the manuscript. O.M. is grateful to the Swiss National Science Foundation for financial support. The authors thank Aku Venhola, and Yvez Revaz for the interesting discussions on the H content of KK 203. This work has made use of BaSTI web tools. M.S.P. and O.M. thank the Deutscher Akademischer Austauschdienst for PPP grant 57512596 funded by the Bundesministerium für Bildung und Forschung, and the Partenariat Hubert Curien (PHC) for PROCOPE project 44677UE. M.S.P. thanks the Klaus Tschira Stiftung and German Scholars Organization for support via a KT Boost Fund. G.S.A acknowledges support for this work provided by NASA through grant number HST-SNAP-15922 from the Space Telescope Science Institute. Based on observations made with the NASA/ESA Hubble Space Telescope, obtained from the data archive at the Space Telescope Science Institute. STScI is operated by the Association of Universities for Research in Astronomy, Inc. under NASA contract NAS 5-26555.References
- Bacon et al. (2010) Bacon, R., Accardo, M., Adjali, L., et al. 2010, in Proc. SPIE, Vol. 7735, Ground-based and Airborne Instrumentation for Astronomy III, 773508
- Baldwin et al. (1981) Baldwin, J. A., Phillips, M. M., & Terlevich, R. 1981, PASP, 93, 5
- Barbary (2016) Barbary, K. 2016, The Journal of Open Source Software, 1, 58
- Barnes et al. (2001) Barnes, D. G., Staveley-Smith, L., de Blok, W. J. G., et al. 2001, MNRAS, 322, 486
- Battaglia et al. (2011) Battaglia, G., Tolstoy, E., Helmi, A., et al. 2011, MNRAS, 411, 1013
- Battaglia et al. (2006) Battaglia, G., Tolstoy, E., Helmi, A., et al. 2006, A&A, 459, 423
- Bellazzini et al. (2004) Bellazzini, M., Ibata, R., Monaco, L., et al. 2004, MNRAS, 354, 1263
- Belokurov et al. (2007) Belokurov, V., Zucker, D. B., Evans, N. W., et al. 2007, ApJ, 654, 897
- Bennet et al. (2019) Bennet, P., Sand, D. J., Crnojević, D., et al. 2019, ApJ, 885, 153
- Bertin & Arnouts (1996) Bertin, E. & Arnouts, S. 1996, A&AS, 117, 393
- Binggeli (1994) Binggeli, B. 1994, in European Southern Observatory Conference and Workshop Proceedings, Vol. 49, European Southern Observatory Conference and Workshop Proceedings, 13
- Binggeli et al. (1990) Binggeli, B., Tarenghi, M., & Sandage, A. 1990, A&A, 228, 42
- Bullock & Boylan-Kolchin (2017) Bullock, J. S. & Boylan-Kolchin, M. 2017, ARA&A, 55, 343
- Buzzoni et al. (2006) Buzzoni, A., Arnaboldi, M., & Corradi, R. L. M. 2006, MNRAS, 368, 877
- Caldwell et al. (2017) Caldwell, N., Strader, J., Sand, D. J., Willman, B., & Seth, A. C. 2017, PASA, 34, e039
- Cappellari & Emsellem (2004) Cappellari, M. & Emsellem, E. 2004, PASP, 116, 138
- Chilingarian et al. (2019) Chilingarian, I. V., Afanasiev, A. V., Grishin, K. A., Fabricant, D., & Moran, S. 2019, ApJ, 884, 79
- Collins et al. (2013) Collins, M. L. M., Chapman, S. C., Rich, R. M., et al. 2013, ApJ, 768, 172
- Collins et al. (2015) Collins, M. L. M., Martin, N. F., Rich, R. M., et al. 2015, ApJ, 799, L13
- Correnti et al. (2009) Correnti, M., Bellazzini, M., & Ferraro, F. R. 2009, MNRAS, 397, L26
- Côté et al. (2001) Côté, P., McLaughlin, D. E., Hanes, D. A., et al. 2001, ApJ, 559, 828
- Crnojević et al. (2011a) Crnojević, D., Grebel, E. K., & Cole, A. A. 2011a, A&A, 530, A59
- Crnojević et al. (2012) Crnojević, D., Grebel, E. K., & Cole, A. A. 2012, A&A, 541, A131
- Crnojević et al. (2010) Crnojević, D., Grebel, E. K., & Koch, A. 2010, A&A, 516, A85
- Crnojević et al. (2011b) Crnojević, D., Rejkuba, M., Grebel, E. K., Da Costa, G., & Jerjen, H. 2011b, A&A, 530, A58
- Crnojević et al. (2019) Crnojević, D., Sand, D. J., Bennet, P., et al. 2019, ApJ, 872, 80
- Crnojević et al. (2016a) Crnojević, D., Sand, D. J., Spekkens, K., et al. 2016a, ApJ, 823, 19
- Crnojević et al. (2016b) Crnojević, D., Sand, D. J., Zaritsky, D., et al. 2016b, ApJ, 824, L14
- Cusano et al. (2016) Cusano, F., Garofalo, A., Clementini, G., et al. 2016, ApJ, 829, 26
- Da Costa et al. (2010) Da Costa, G. S., Rejkuba, M., Jerjen, H., & Grebel, E. K. 2010, ApJ, 708, L121
- Danieli et al. (2019) Danieli, S., van Dokkum, P., Conroy, C., Abraham, R., & Romanowsky, A. J. 2019, ApJ, 874, L12
- Della Bruna et al. (2020) Della Bruna, L., Adamo, A., Bik, A., et al. 2020, A&A, 635, A134
- Dolphin (2016) Dolphin, A. 2016, DOLPHOT: Stellar photometry
- Duc et al. (2015) Duc, P.-A., Cuillandre, J.-C., Karabal, E., et al. 2015, MNRAS, 446, 120
- Eigenthaler et al. (2018) Eigenthaler, P., Puzia, T. H., Taylor, M. A., et al. 2018, ApJ, 855, 142
- Emsellem et al. (2019) Emsellem, E., van der Burg, R. F. J., Fensch, J., et al. 2019, A&A, 625, A76
- Evans et al. (2019) Evans, C. J., Castro, N., Gonzalez, O. A., et al. 2019, A&A, 622, A129
- Fahrion et al. (2019a) Fahrion, K., Georgiev, I., Hilker, M., et al. 2019a, A&A, 625, A50
- Fahrion et al. (2020a) Fahrion, K., Lyubenova, M., Hilker, M., et al. 2020a, A&A, 637, A26
- Fahrion et al. (2019b) Fahrion, K., Lyubenova, M., van de Ven, G., et al. 2019b, A&A, 628, A92
- Fahrion et al. (2020b) Fahrion, K., Müller, O., Rejkuba, M., et al. 2020b, A&A, 634, A53
- Famaey et al. (2018) Famaey, B., McGaugh, S., & Milgrom, M. 2018, MNRAS, 480, 473
- Famaey & McGaugh (2012) Famaey, B. & McGaugh, S. S. 2012, Living Reviews in Relativity, 15, 10
- Fensch et al. (2019) Fensch, J., van der Burg, R. F. J., Jeřábková, T., et al. 2019, A&A, 625, A77
- Ferguson & Binggeli (1994) Ferguson, H. C. & Binggeli, B. 1994, A&A Rev., 6, 67
- Ferrarese et al. (2016) Ferrarese, L., Côté, P., Sánchez-Janssen, R., et al. 2016, ApJ, 824, 10
- Forbes et al. (2017) Forbes, D. A., Alabi, A., Brodie, J. P., et al. 2017, AJ, 153, 114
- Forbes et al. (2020) Forbes, D. A., Alabi, A., Romanowsky, A. J., Brodie, J. P., & Arimoto, N. 2020, MNRAS, 492, 4874
- Gannon et al. (2020) Gannon, J. S., Forbes, D. A., Romanowsky, A. J., et al. 2020, MNRAS, 495, 2582
- Geha et al. (2012) Geha, M., Blanton, M. R., Yan, R., & Tinker, J. L. 2012, ApJ, 757, 85
- Geha et al. (2010) Geha, M., van der Marel, R. P., Guhathakurta, P., et al. 2010, ApJ, 711, 361
- Geha et al. (2017) Geha, M., Wechsler, R. H., Mao, Y.-Y., et al. 2017, ApJ, 847, 4
- Georgiev et al. (2010) Georgiev, I. Y., Puzia, T. H., Goudfrooij, P., & Hilker, M. 2010, MNRAS, 406, 1967
- Grebel (2016) Grebel, E. K. 2016, in IAU Symposium, Vol. 312, Star Clusters and Black Holes in Galaxies across Cosmic Time, ed. Y. Meiron, S. Li, F. K. Liu, & R. Spurzem, 157–170
- Guérou et al. (2017) Guérou, A., Krajnović, D., Epinat, B., et al. 2017, A&A, 608, A5
- Haghi et al. (2019) Haghi, H., Kroupa, P., Banik, I., et al. 2019, MNRAS, 487, 2441
- Hamraz et al. (2019) Hamraz, E., Peletier, R. F., Khosroshahi, H. G., et al. 2019, A&A, 625, A94
- Hanuschik et al. (2017) Hanuschik, R., Data Processing, & Quality Control Group. 2017, in ESO Calibration Workshop: The Second Generation VLT Instruments and Friends, 15
- Hargis et al. (2016) Hargis, J. R., Kimmig, B., Willman, B., et al. 2016, ApJ, 818, 39
- Harris et al. (2010) Harris, G. L. H., Rejkuba, M., & Harris, W. E. 2010, PASA, 27, 457
- Harris et al. (2013) Harris, W. E., Harris, G. L. H., & Alessi, M. 2013, ApJ, 772, 82
- Harris & van den Bergh (1981) Harris, W. E. & van den Bergh, S. 1981, AJ, 86, 1627
- Henden et al. (2009) Henden, A. A., Welch, D. L., Terrell, D., & Levine, S. E. 2009, in American Astronomical Society Meeting Abstracts, Vol. 214, American Astronomical Society Meeting Abstracts #214, 669
- Hidalgo et al. (2013) Hidalgo, S. L., Monelli, M., Aparicio, A., et al. 2013, ApJ, 778, 103
- Huang & Koposov (2020) Huang, K.-W. & Koposov, S. E. 2020, arXiv e-prints, arXiv:2005.14014
- Jaffé et al. (2014) Jaffé, Y. L., Aragón-Salamanca, A., Ziegler, B., et al. 2014, MNRAS, 440, 3491
- Javanmardi et al. (2016) Javanmardi, B., Martinez-Delgado, D., Kroupa, P., et al. 2016, A&A, 588, A89
- Jerjen et al. (2000) Jerjen, H., Binggeli, B., & Freeman, K. C. 2000, AJ, 119, 593
- Jerjen & Rejkuba (2001) Jerjen, H. & Rejkuba, M. 2001, A&A, 371, 487
- Karachentsev & Kaisin (2020) Karachentsev, I. D. & Kaisin, S. S. 2020, MNRAS, 495, 3592
- Karachentsev et al. (2004) Karachentsev, I. D., Karachentseva, V. E., Huchtmeier, W. K., & Makarov, D. I. 2004, AJ, 127, 2031
- Karachentsev et al. (2013) Karachentsev, I. D., Makarov, D. I., & Kaisina, E. I. 2013, AJ, 145, 101
- Karachentsev et al. (2002) Karachentsev, I. D., Sharina, M. E., Dolphin, A. E., et al. 2002, A&A, 385, 21
- Karachentsev et al. (2007) Karachentsev, I. D., Tully, R. B., Dolphin, A., et al. 2007, AJ, 133, 504
- Kewley et al. (2019) Kewley, L. J., Nicholls, D. C., & Sutherland, R. S. 2019, ARA&A, 57, 511
- Kim & Jerjen (2015) Kim, D. & Jerjen, H. 2015, ApJ, 808, L39
- Kirby et al. (2013) Kirby, E. N., Cohen, J. G., Guhathakurta, P., et al. 2013, ApJ, 779, 102
- Kirby et al. (2011) Kirby, E. N., Lanfranchi, G. A., Simon, J. D., Cohen, J. G., & Guhathakurta, P. 2011, ApJ, 727, 78
- Kirshner & Taylor (1976) Kirshner, R. P. & Taylor, K. 1976, ApJ, 208, L83
- Koch et al. (2006) Koch, A., Grebel, E. K., Wyse, R. F. G., et al. 2006, AJ, 131, 895
- Koch et al. (2009) Koch, A., Wilkinson, M. I., Kleyna, J. T., et al. 2009, ApJ, 690, 453
- Koposov et al. (2015) Koposov, S. E., Belokurov, V., Torrealba, G., & Evans, N. W. 2015, ApJ, 805, 130
- Kormendy et al. (2009) Kormendy, J., Fisher, D. B., Cornell, M. E., & Bender, R. 2009, ApJS, 182, 216
- Kroupa (2001) Kroupa, P. 2001, MNRAS, 322, 231
- Kroupa et al. (2018) Kroupa, P., Haghi, H., Javanmardi, B., et al. 2018, Nature, 561, E4
- Laporte et al. (2019) Laporte, C. F. P., Agnello, A., & Navarro, J. F. 2019, MNRAS, 484, 245
- Lelli et al. (2014) Lelli, F., Fraternali, F., & Verheijen, M. 2014, A&A, 563, A27
- Lelli et al. (2017) Lelli, F., McGaugh, S. S., Schombert, J. M., & Pawlowski, M. S. 2017, ApJ, 836, 152
- Levesque et al. (2010) Levesque, E. M., Kewley, L. J., & Larson, K. L. 2010, AJ, 139, 712
- Lianou et al. (2010) Lianou, S., Grebel, E. K., & Koch, A. 2010, A&A, 521, A43
- Lim et al. (2018) Lim, S., Peng, E. W., Côté, P., et al. 2018, ApJ, 862, 82
- Lisker et al. (2008) Lisker, T., Grebel, E. K., & Binggeli, B. 2008, AJ, 135, 380
- Lupton (2005) Lupton, R. 2005, Transformations between SDSS magnitudes and other systems https://www.sdss3.org/dr10/algorithms/sdssUBVRITransform.php/
- Mackey & Gilmore (2003a) Mackey, A. D. & Gilmore, G. F. 2003a, MNRAS, 338, 120
- Mackey & Gilmore (2003b) Mackey, A. D. & Gilmore, G. F. 2003b, MNRAS, 340, 175
- Makarov et al. (2015) Makarov, D. I., Sharina, M. E., Karachentseva, V. E., & Karachentsev, I. D. 2015, A&A, 581, A82
- Martel et al. (2004) Martel, A. R., Ford, H. C., Bradley, L. D., et al. 2004, AJ, 128, 2758
- Martin et al. (2014) Martin, N. F., Chambers, K. C., Collins, M. L. M., et al. 2014, ApJ, 793, L14
- Martin et al. (2018) Martin, N. F., Collins, M. L. M., Longeard, N., & Tollerud, E. 2018, ApJ, 859, L5
- Martin et al. (2008) Martin, N. F., de Jong, J. T. A., & Rix, H.-W. 2008, ApJ, 684, 1075
- Martin et al. (2009) Martin, N. F., McConnachie, A. W., Irwin, M., et al. 2009, ApJ, 705, 758
- Mateo et al. (2008) Mateo, M., Olszewski, E. W., & Walker, M. G. 2008, ApJ, 675, 201
- Mateo (1998) Mateo, M. L. 1998, ARA&A, 36, 435
- Mau et al. (2020) Mau, S., Cerny, W., Pace, A. B., et al. 2020, ApJ, 890, 136
- McConnachie (2012) McConnachie, A. W. 2012, AJ, 144, 4
- McGaugh & de Blok (1998) McGaugh, S. S. & de Blok, W. J. G. 1998, ApJ, 499, 41
- McGaugh et al. (2016) McGaugh, S. S., Lelli, F., & Schombert, J. M. 2016, Phys. Rev. Lett., 117, 201101
- McGaugh et al. (2017) McGaugh, S. S., Schombert, J. M., & Lelli, F. 2017, ApJ, 851, 22
- Milgrom (1983) Milgrom, M. 1983, ApJ, 270, 365
- Misgeld & Hilker (2011) Misgeld, I. & Hilker, M. 2011, MNRAS, 414, 3699
- Moumen et al. (2019) Moumen, I., Robert, C., Devost, D., et al. 2019, MNRAS, 488, 803
- Muñoz et al. (2018) Muñoz, R. R., Côté, P., Santana, F. A., et al. 2018, ApJ, 860, 66
- Müller et al. (2019a) Müller, O., Famaey, B., & Zhao, H. 2019a, A&A, 623, A36
- Müller et al. (2019b) Müller, O., Ibata, R., Rejkuba, M., & Posti, L. 2019b, A&A, 629, L2
- Müller et al. (2017) Müller, O., Jerjen, H., & Binggeli, B. 2017, A&A, 597, A7
- Müller et al. (2016) Müller, O., Jerjen, H., Pawlowski, M. S., & Binggeli, B. 2016, A&A, 595, A119
- Müller et al. (2020) Müller, O., Marleau, F. R., Duc, P.-A., et al. 2020, A&A, 640, A106
- Müller et al. (2018a) Müller, O., Pawlowski, M. S., Jerjen, H., & Lelli, F. 2018a, Science, 359, 534
- Müller et al. (2018b) Müller, O., Rejkuba, M., & Jerjen, H. 2018b, A&A, 615, A96
- Müller et al. (2019c) Müller, O., Rejkuba, M., Pawlowski, M. S., et al. 2019c, A&A, 629, A18
- Oey et al. (2007) Oey, M. S., Meurer, G. R., Yelda, S., et al. 2007, ApJ, 661, 801
- Peng et al. (2002) Peng, C. Y., Ho, L. C., Impey, C. D., & Rix, H.-W. 2002, AJ, 124, 266
- Peng et al. (2008) Peng, E. W., Jordán, A., Côté, P., et al. 2008, ApJ, 681, 197
- Phillips et al. (1986) Phillips, M. M., Jenkins, C. R., Dopita, M. A., Sadler, E. M., & Binette, L. 1986, AJ, 91, 1062
- Pietrinferni et al. (2004) Pietrinferni, A., Cassisi, S., Salaris, M., & Castelli, F. 2004, ApJ, 612, 168
- Pota et al. (2013) Pota, V., Forbes, D. A., Romanowsky, A. J., et al. 2013, MNRAS, 428, 389
- Prole et al. (2019) Prole, D. J., Hilker, M., van der Burg, R. F. J., et al. 2019, MNRAS, 484, 4865
- Reid (2015) Reid, W. A. 2015, in IAU General Assembly, Vol. 29, 2249670
- Rejkuba et al. (2006) Rejkuba, M., Da Costa, G. S., Jerjen, H., Zoccali, M., & Binggeli, B. 2006, A&A, 448, 983
- Rejkuba et al. (2014) Rejkuba, M., Harris, W. E., Greggio, L., et al. 2014, ApJ, 791, L2
- Ryś et al. (2013) Ryś, A., Falcón-Barroso, J., & van de Ven, G. 2013, MNRAS, 428, 2980
- Saifollahi et al. (2020) Saifollahi, T., Trujillo, I., Beasley, M. A., Peletier, R. F., & Knapen, J. H. 2020, arXiv e-prints, arXiv:2006.14630
- Sandage & Binggeli (1984) Sandage, A. & Binggeli, B. 1984, AJ, 89, 919
- Scott et al. (2020) Scott, N., Eftekhari, F. S., Peletier, R. F., et al. 2020, MNRAS[arXiv:2007.04492]
- Simon & Geha (2007) Simon, J. D. & Geha, M. 2007, ApJ, 670, 313
- Soto et al. (2016) Soto, K. T., Lilly, S. J., Bacon, R., Richard, J., & Conseil, S. 2016, MNRAS, 458, 3210
- Stein et al. (2018) Stein, Y., Bomans, D. J., Kamphuis, P., et al. 2018, A&A, 620, A29
- Strader et al. (2006) Strader, J., Brodie, J. P., Spitler, L., & Beasley, M. A. 2006, AJ, 132, 2333
- Strader et al. (2013) Strader, J., Seth, A. C., Forbes, D. A., et al. 2013, ApJ, 775, L6
- Streich et al. (2014) Streich, D., de Jong, R. S., Bailin, J., et al. 2014, A&A, 563, A5
- Tafelmeyer et al. (2010) Tafelmeyer, M., Jablonka, P., Hill, V., et al. 2010, A&A, 524, A58
- Taibi et al. (2018) Taibi, S., Battaglia, G., Kacharov, N., et al. 2018, A&A, 618, A122
- Taibi et al. (2020) Taibi, S., Battaglia, G., Rejkuba, M., et al. 2020, A&A, 635, A152
- Tammann (1994) Tammann, G. A. 1994, in European Southern Observatory Conference and Workshop Proceedings, Vol. 49, European Southern Observatory Conference and Workshop Proceedings, 3
- Taylor et al. (2018) Taylor, M. A., Eigenthaler, P., Puzia, T. H., et al. 2018, ApJ, 867, L15
- Taylor et al. (2016) Taylor, M. A., Muñoz, R. P., Puzia, T. H., et al. 2016, arxiv:1608.07285
- Taylor et al. (2017) Taylor, M. A., Puzia, T. H., Muñoz, R. P., et al. 2017, MNRAS, 469, 3444
- Teeninga et al. (2013) Teeninga, P., Moschini, U., Trager, S., & Wilkinson, M. 2013, power, 2, 1
- Teeninga et al. (2015) Teeninga, P., Moschini, U., Trager, S. C., & Wilkinson, M. H. 2015, in International Symposium on Mathematical Morphology and Its Applications to Signal and Image Processing, Springer, 157–168
- Tollerud et al. (2012) Tollerud, E. J., Beaton, R. L., Geha, M. C., et al. 2012, ApJ, 752, 45
- Toloba et al. (2015) Toloba, E., Guhathakurta, P., Boselli, A., et al. 2015, ApJ, 799, 172
- Tolstoy et al. (2009) Tolstoy, E., Hill, V., & Tosi, M. 2009, ARA&A, 47, 371
- Tolstoy et al. (2004) Tolstoy, E., Irwin, M. J., Helmi, A., et al. 2004, ApJ, 617, L119
- Torrealba et al. (2016) Torrealba, G., Koposov, S. E., Belokurov, V., et al. 2016, MNRAS, 463, 712
- Tully et al. (2015) Tully, R. B., Libeskind, N. I., Karachentsev, I. D., et al. 2015, ApJ, 802, L25
- Valdes et al. (2014) Valdes, F., Gruendl, R., & DES Project. 2014, in Astronomical Society of the Pacific Conference Series, Vol. 485, Astronomical Data Analysis Software and Systems XXIII, ed. N. Manset & P. Forshay, 379
- van Dokkum et al. (2019) van Dokkum, P., Danieli, S., Abraham, R., Conroy, C., & Romanowsky, A. J. 2019, ApJ, 874, L5
- van Dokkum et al. (2018) van Dokkum, P., Danieli, S., Cohen, Y., et al. 2018, Nature, 555, 629
- Vazdekis et al. (2016) Vazdekis, A., Koleva, M., Ricciardelli, E., Röck, B., & Falcón-Barroso, J. 2016, MNRAS, 463, 3409
- Vazdekis et al. (2010) Vazdekis, A., Sánchez-Blázquez, P., Falcón-Barroso, J., et al. 2010, MNRAS, 404, 1639
- Venhola et al. (2019) Venhola, A., Peletier, R., Laurikainen, E., et al. 2019, A&A, 625, A143
- Voggel et al. (2018) Voggel, K. T., Seth, A. C., Neumayer, N., et al. 2018, ApJ, 858, 20
- Voggel et al. (2020) Voggel, K. T., Seth, A. C., Sand, D. J., et al. 2020, arXiv e-prints, arXiv:2001.02243
- Walker et al. (2009) Walker, M. G., Mateo, M., Olszewski, E. W., et al. 2009, ApJ, 704, 1274
- Walsh et al. (2015) Walsh, J. R., Rejkuba, M., & Walton, N. A. 2015, A&A, 574, A109
- Weilbacher et al. (2020) Weilbacher, P. M., Palsa, R., Streicher, O., et al. 2020, arXiv e-prints, arXiv:2006.08638
- Weilbacher et al. (2012) Weilbacher, P. M., Streicher, O., Urrutia, T., et al. 2012, in Proc. SPIE, Vol. 8451, Software and Cyberinfrastructure for Astronomy II, 84510B
- Weisz et al. (2011) Weisz, D. R., Dalcanton, J. J., Williams, B. F., et al. 2011, ApJ, 739, 5
- Weisz et al. (2014) Weisz, D. R., Dolphin, A. E., Skillman, E. D., et al. 2014, ApJ, 789, 147
- Willman et al. (2005) Willman, B., Dalcanton, J. J., Martinez-Delgado, D., et al. 2005, ApJ, 626, L85
- Wolf et al. (2010) Wolf, J., Martinez, G. D., Bullock, J. S., et al. 2010, MNRAS, 406, 1220
- York et al. (2000) York, D. G., Adelman, J., Anderson, Jr., J. E., et al. 2000, AJ, 120, 1579
Appendix A Surface brightness photometry of KK 203
Due to the lack of surface brightness photometry of the dwarf galaxy KK 203 in the literature, we have derived it here. We used archival and band imaging taken with the Dark Energy Camera. The stacked band image has an exposure time of 1000 s, the band an exposure time of 60 s. The data was processed by the standard DECam community pipeline (Valdes et al. 2014). To model the surface brightness profile of the galaxy, we fit Sérsic profiles to the galaxy using GALFIT (Peng et al. 2002). We provided GALFIT with a segmentation map created by MTObjects (Teeninga et al. 2013, 2015) to mask foreground stars and background galaxies. The zero points were derived using The AAVSO Photometric All-Sky Survey (APASS) standard stars (Henden et al. 2009). We derive an extinction corrected apparent magnitude of mag with a color of mag. The effective radius is arcsec, which corresponds to 361 pc at the distance of KK 203 ( Mpc). The mean effective surface brightness is mag. Using the color transformation by Lupton (2005), we derive an absolute magnitude of mag, which is slightly brighter than what is listed in the literature (Müller et al. 2019c).
Appendix B Properties of the background objects
Our MUSE data of KK 198 and dw1315-45 revealed that these two galaxies are not dwarf galaxies associated with the Centaurus group but rather are background star forming galaxies. Both KK 198 and dw1315-45 show strong Balmer emission lines (H and H) as well as [NII], [SII], and [OIII] lines. KK 198 has a redshift of 0.0128, dw1315-45 of 0.0100, which puts them at a distance of 50 Mpc. The former is a face-on spiral galaxy, as already noted in the optical FORS2 images (Müller et al. 2019c), the latter must be an ultra-diffuse galaxy with an effective radius of pc.
Appendix C Spectra of the targets
In Fig 12 and Fig 13 we present all the integrated spectra of our targets. The best fit provided by pPXF includes the stellar absorption and emission lines. Two targets (KK 198 and dw1315-45) are clearly background star-forming galaxies with strong emission lines.