INDRA Collaboration
Model independent reconstruction of impact parameter distributions for intermediate energy heavy ion collisions
Abstract
We present a model-independent method to reconstruct the impact parameter distributions of experimental data for intermediate energy heavy ion collisions, adapted from a recently proposed approach for ultra-relativistic heavy ion collisions. The method takes into account the fluctuations which are inherent to the relationship between any experimental observable and the impact parameter in this energy range. We apply the method to the very large dataset on heavy ion collisions in the energy range 20–100 MeV/nucleon obtained with the INDRA multidetector since 1993, for two observables which are the most commonly used for the estimation of impact parameters in this energy range. The mean impact parameters deduced with this new method for “central” collisions selected using typical observable cuts are shown to be significantly larger than those found when fluctuations are neglected, and as expected the difference increases as bombarding energy decreases. In addition, we will show that this new approach may provide previously inaccessible experimental constraints for transport models, such as an estimation of the extrapolated mean value of experimental observables for collisions. The ability to give more realistic, model-independent, estimations of the impact parameters associated to different experimental datasets should improve the pertinence of comparisons with transport model calculations which are essential to better constrain the equation of state of nuclear matter.
I Introduction
The equation of state (EoS) of bulk nuclear matter in a wide range of densities, temperatures, and proton-neutron asymmetries is of major importance not only for nuclear physics but also astrophysics since the EoS plays a fundamental role in the understanding of core-collapse supernovae (CCSN), proto-neutron star cooling [1], and neutron star mergers as recently observed through gravitational wave data [2]. In the laboratory, precise constraints on the finite temperature EoS away from saturation density can be obtained from heavy-ion collisions (HIC), which can be used to explore a wide range of density, energy and asymmetry conditions, depending on the bombarding energy, neutron and proton numbers (, ) of projectile and target, and impact parameter, . In particular, the freeze-out stage of central HIC in the energy range 20–100 MeV/nucleon produces transient finite systems with similar temperatures and densities as CCSN matter, albeit with smaller asymmetries [3, 4].
The EoS cannot be measured directly but has to be inferred by comparing the outcome of carefully selected collisions with model predictions. For example, transport models [5, 6, 7, 8, 9, 10, 11, 12, 13, 14] can be used to predict the dynamics of collisions at different impact parameters using different forms of the EoS, by varying the parameters of the employed effective interaction. For such a comparison to be meaningful, the calculations should ideally be run over the same impact parameter distribution as that of the experimental event sample , or at least use a representative value such as the mean of this distribution, . This is all the more important as currently transport model calculations are not only dependent on the EoS parameters, but also on many other ingredients (related to uncertainties both of physics and of numerical implementation) which are as yet not fully under control [15, 16], therefore reducing trivial bias due to mismatching of experimental and simulated impact parameters is essential to make progress.
Of course, the impact parameter for each collision cannot be measured but only inferred from the final state observables of each event. An essential feature of HIC in the 20–100 MeV/nucleon energy range are fluctuations. The fluctuations of any observable from one collision to the next can be of the same order of magnitude as its mean value, . Due to a combination of diminishing cross-section and increasing importance of fluctuations as , higher and higher cuts in any observable, even one strongly correlated with , will always lead to mixing between collisions over a broad range of impact paramter [17, 18]. Impact parameter mixing in experimental data samples of “central” collisions is a general feature which can seriously bias comparisons with transport models if neglected [19]. For example, the authors of [20] studied how mixing can affect studies of isospin sensitive variables using the ImQMD transport model. They show that in reality the mean impact parameter selected by higher and higher cuts on the total charged particle multiplicity “saturates” at a finite value , and the difference between estimated and true centrality worsens as bombarding energies decrease below 70 MeV/nucleon (see also for example [21]). Given the current uncertainties in existing transport models, it would be an important advance to be able to quantitatively characterize the centrality of selected event samples in a model-independent way.
There are many works in the literature dealing with the characterization of experimental centrality, from the simplest and most widely used geometric approximation of [22] to an AI approach using neural networks trained by simulated data [23]. Recently, a new method for reconstructing experimental impact parameter distributions was proposed for ultra-relativistic collisions in [24, 25]. It is model independent and explicitly takes into account the fluctuations in the relationship between and , which is adjusted in order to reproduce the experimentally measured inclusive distribution. Despite the orders of magnitude differences in beam energies and physics, the inclusive distributions for different observables used to gauge the centrality of e.g. Au+Au collisions at center of mass (c.m.) energies =130 GeV or Pb+Pb collisions at 2.76 TeV (see Fig. 1 of [24]) have generic properties very similar to those seen for e.g. total multiplicity or total transverse energies in HIC collisions at intermediate energies: the highest cross-section for the smallest values of , decreasing to a wide plateau and finally a near-exponential fall-off for the largest values. Indeed such a generic distribution is expected for any observable whose mean value decreases monotonically with when weighted with a geometric impact parameter distribution, .
In this paper, our aim is not to criticize or improve existing methods of selecting experimental samples of central collisions. Rather, we propose a new method to characterize any selected set of experimental data in terms of the corresponding impact parameter distribution. The method is model independent and uses experimental data as its sole input. It is based on the approach of [24, 25] which we will first present along with the adaptations we have made for its use in the intermediate energy range. Before applying it to our experimental data, we will first of all validate the method with a full simulation of a typical near-Fermi energy heavy-ion reaction using the microscopic transport model AMD [26], the statistical decay code GEMINI++ [27, 28] and a software filter reproducing the characteristics of the INDRA array [29, 30]. Then we will apply it to the very large INDRA dataset on heavy ion collisions in the energy range 20–100 MeV/nucleon. We will use it to provide a systematic estimate of the true centrality of the collisions selected by a high-transverse energy cut, as often used in previous analyses [31]. In conclusion, by providing more reliable, model-independent estimates of impact parameters associated to different experimental data, this method will improve the quality of data-model comparisons which are essential to better constrain the equation of state of nuclear matter.
II Method
II.1 General approach
Consider an observable whose functional dependence on the impact parameter can be written in terms of a conditional probability distribution , which encodes both the -dependence of the mean value, , and the fluctuations of about this mean value. The inclusive distribution of resulting from all measured collisions, having an unknown impact parameter distribution , is given by
| (1) |
Introducing the quantity centrality, , defined as the cumulative distribution function of ,
| (2) |
Eq. 1 can be rewritten as
| (3) |
as by definition , and the dependency on the unknown inclusive impact parameter distribution disappears. Then Eq. 3 can in principle be used to determine by fitting the experimentally measured inclusive distribution of , . In order to make the problem tractable, the authors of [24, 25] proposed to write as
| (4) |
where is a suitable p.d.f. with mean value and reduced variance determined by . In principle, both the mean value and the variance of the observable can depend on centrality, i.e. the impact parameter.
Once is determined by fitting the experimental distribution, it can be used to estimate the centrality distribution for any given selection of data. For example, for a cut such as the corresponding centrality distribution is given by
where, in the first integral, is the joint probability distribution, . The second equality being nothing but Bayes’ theorem, we can use it to rewrite the integrand in the numerator, remembering that . If we also define an experimental centrality, , as
| (5) |
i.e. the fraction of all events with , then we can also rewrite the denominator, giving finally for the centrality distribution corresponding to our event selection
| (6) |
More generally, events may be selected in many different ways, not only using simple cuts, and not necessarily using the same observable as that which is used for centrality estimation: for a generic experimental sample the centrality distribution will be given by
| (7) |
where is the sample distribution of (i.e. a histogram of filled from the events in the sample), and the integrals are over the full domain of . Therefore once has been determined by fitting the experimental distribution, it can be used to estimate the centrality distribution for any given selection of data.
Finally, absolute impact parameter distributions can be deduced from the calculated centrality distributions by a suitable change of variables:
| (8) |
It should be noted that in this case it is necessary to assume a specific form for the inclusive impact parameter distribution and calculate the corresponding relationship between and , , using Eq. 2.
II.2 Specific implementation
In order to apply the method to data, specific choices and approximations must be made. These concern the p.d.f. to use in Eq. 4, the parametrization of the centrality dependence of the mean, , and the centrality dependence of the reduced fluctuation, .
II.2.1 Fluctuation kernel,
As observables most strongly correlated with impact parameter in heavy-ion collisions can be assumed to result from a sum of many independent microscopic processes (e.g. nucleon-nucleon collisions), a natural choice would be a gaussian or normal distribution [24]. However, as most observables related to collision violence only take positive values, , the gaussian distribution has the disadvantage for small that negative values may occur with finite probability. Therefore, as shown in [25], a better choice is the gamma distribution
| (9) |
with . The gamma distribution is only defined for , being asymmetric for small and tending towards a gaussian distribution asymptotically for large .
Another criterion for the choice of is the nature of the observable : is it a continuous or a discrete variable? Although in principle the gaussian or gamma distributions can be used for both, in the case of discrete variables such as particle multiplicities, one might think that a discrete probability distribution may be more suitable. However, the most likely candidates, the Poisson distribution, the binomial distribution and the negative binomial distribution, each impose different constraints on the reduced variance : (binomial), (Poisson) or (negative binomial). As will be seen below, the experimental distributions do not contain sufficient information to constrain the dependency of both and on , therefore rather than constrain a priori the value of by the choice of , it is preferable to use the gamma fluctuation kernel for which can vary freely, even for observables which only take discrete values.
II.2.2 Centrality dependence of the mean,
In order to reconstruct centrality distributions from experimental distributions, the relationship between and centrality must be monotonic. We have chosen a functional form whose parameters can vary freely while guaranteeing monotonicity and which is sufficiently general to describe the typical shapes of such relationships as predicted by various transport model calculations in this energy range (see for example [21, 32, 33, 34, 35, 20]).
In the framework of the gamma distribution of Eq. 9, it is in fact the parameter whose centrality dependence has to be parameterized, for which we have used
| (10) |
Note that this form corresponds to a monotonically decreasing function of centrality (as expected for variables which increase with collision violence): if a monotonically increasing function of centrality is required, one can replace by in Eq. 10. Only 4 free parameters are required. and can be directly linked to the shape of the impact parameter dependence of , making interpretation of fit results more immediate: the value of determines whether or not the observable’s evolution with presents a plateau for the most central collisions, i.e. when there exists a range of small impact parameters for which the derivative , which implies a lower limit to the observable’s sensitivity to variations of — the larger the value of , the larger the range; the -parameter determines the concavity of the curve — values of lead to S-shaped curves with an asymptotically zero derivative at .
and determine the maximum mean value of the observable achieved in head-on collisions, i.e. for :
| (11) |
The ‘offset’ parameter is important because we cannot always assume that is zero for the most peripheral recorded collisions. This is especially clear when considering , the total multiplicity of charged products. All the data analyzed in this article were obtained with an online DAQ trigger corresponding to a minimum number of fired telescopes of between 3 and 5 depending on the system studied. For the lightest systems considered in our study, the maximum charged particle multiplicity can be as small as 20; in this case the role of is far from negligible.
II.2.3 Centrality dependence of reduced fluctuations,
As first pointed out in [24], the experimental distributions do not contain sufficient information to constrain the dependency of both and on . The problem is under-constrained, in the sense that one cannot extract two unknown functions, and , from a single distribution, . Nevertheless, the fluctuations for central collisions, , can be well-constrained by the tail of the distribution, which is dominated by fluctuations around the mean value for , ). The rest of the distribution gets contributions from many different impact parameters so that fluctuations are averaged over, and only contains information about away from the tail. Therefore, as in [24, 25], we make the approximation that the reduced fluctuation parameter is constant for all centralities, and equal to its value for : in other words the variance of is proportional to its mean value for all , with a constant of proportionality which is a free parameter of the fits, constrained by the tail of the distributions.
II.3 Test with a transport model calculation
We have used the microscopic transport model AMD (Antisymmetrised Molecular Dynamics, [8, 11]) in order to simulate a typical reaction from the INDRA dataset, 58Ni+58Ni collisions at 52 MeV/nucleon. The transport model calculation was stopped at the end of the dynamical phase of the reaction, after 300 fm/c, and the resulting set of excited primary nuclei was used as input to the statistical decay code GEMINI++ [27, 28]. The detection of the final products of these collisions by the INDRA array [30] was then simulated using a software replica of the apparatus [29], including a minimum-bias acquisition trigger requiring simultaneous detection of 4 charged products or more (as during the experimental measurement). Our goal here is not to test the AMD model, nor to compare its predictions with data, but rather to have at our disposition a set of simulated data which correctly reproduce at least the main features of the experimental data, while linking the impact parameter of each collision with its outcome based on the pertinent microscopic physics ingredients for heavy-ion collisions in this energy range.
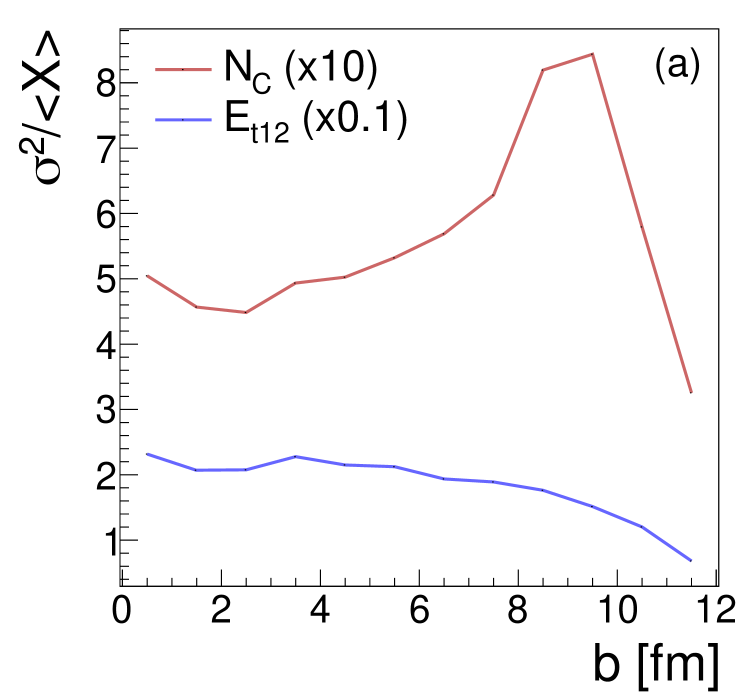
A first result of these calculations is shown in Figure 1(a). The reduced variance of the two observables which we will use in the following, the total charged particle multiplicity, , and the total transverse energy of light charged particles with , , is presented as a function of impact parameter. The variances presented here include several sources of fluctuations: fluctuations in the microscopic collision dynamics, fluctuations in the secondary decay of excited primary fragments, and fluctuations due to the finite acceptance of the INDRA array and other detection effects. It can be seen that for all but the most peripheral collisions ( fm), the reduced variance of both observables can be considered approximately constant. Therefore, the approximation of II.2.3, whereby the reduced fluctuation parameter is assumed to be independent of the impact parameter, can be seen to have some justification, at least as far as this modelization is concerned.
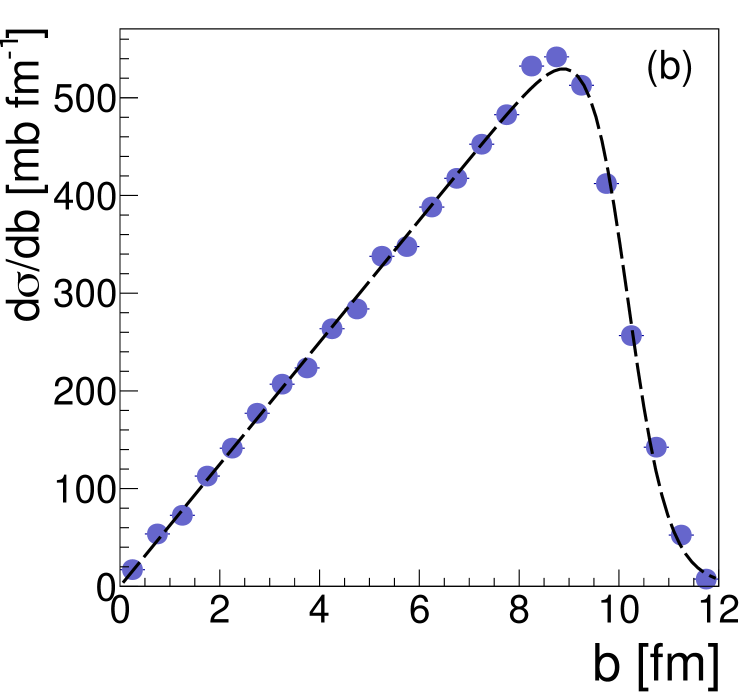
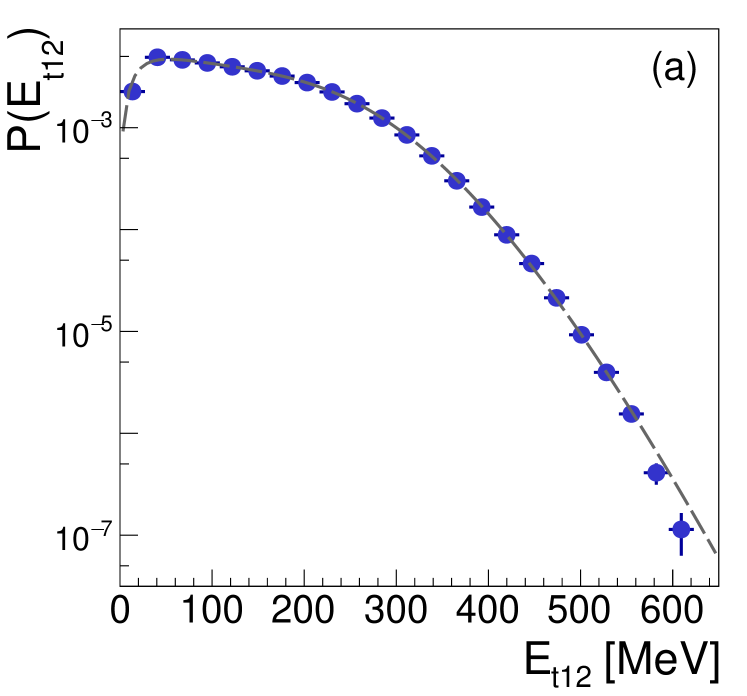
Figure 2(a) shows an example of the quality of fits to the inclusive data histograms which can be achieved using Eq. 3 and the parametrizations of Eqs. 9,10, here for the total transverse energy of light charged particles, . The parameter values deduced from this fit completely determine the conditional probability distribution , and can therefore be used to calculate centrality distributions for any arbitrary selection of data. However, to calculate impact parameter distributions, as pointed out at the end of Sec. II.1, requires the knowledge of, or at least a good approximation to, the full impact parameter distribution . In the present case, of course, this distribution is accessible, as shown in Figure 1(b). Initially, the AMD calculations were run with a geometric impact parameter distribution,
for all fm. Let us recall that the equivalent of the experimental DAQ trigger in this simulation is the detection of at least 4 charged particles in coincidence: as can be seen, for the most peripheral collisions ( fm) the probability of such events decreases to zero. Such a distribution can be well-fitted by with
| (12) |
as shown by the dashed curve in Figure 1(b), for parameter values fm and fm. Similar distributions have been observed previously using different models applied to different reaction systems of the INDRA dataset (see for example Figure 2(a) of [36]), and suggest that in general for “minimum-bias” INDRA data, Eq. 12 with fm gives a good approximation to the full impact parameter distribution. The formulae allowing to calculate for a given value of knowing the total measured cross-section, and the relation between centrality and impact parameter, , needed for Eq. 8, are given in Appendix A.
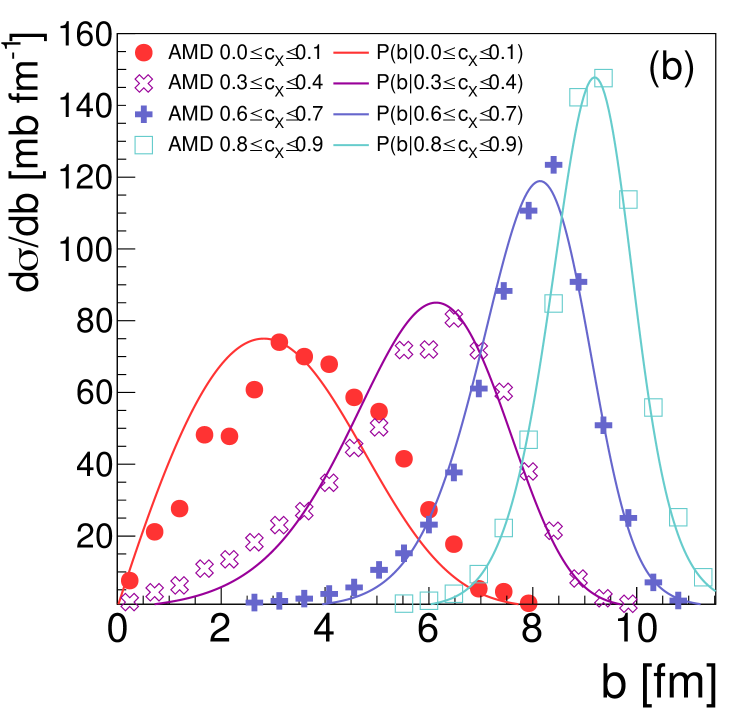
Examples of reconstructed impact parameter distributions calculated using the deduced form of are shown in Figure 2(b). Here we have gated the simulated data according to 4 bins of experimental centrality, , calculated with the variable (see Eq. 5). As can be seen, the reconstructed distributions are very similar to the actual impact parameter distributions which in this case can be simply generated by applying the cuts directly to the model. Both mean impact parameter and width of the distribution for each centrality bin are very well reproduced. For the most central bin (, corresponding to the upper 10% of the distribution), although a small shift can be observed, leading to a slight underestimation of the mean impact parameter for these events, the reconstructed distribution is still a very good approximation to the actual one.
If this new method underestimates slightly the impact parameters for a very central cut, it is as nothing compared to the underestimation that would result from the commonly-used sharp cut-off approximation (SCA). Within the SCA, the cross-section associated with any selection of “the most central collisions” is assumed to correspond to a geometric (triangular) distribution of impact parameters between and , where is the assumed upper limit of impact parameters retained by the cut. In this case, the fraction of all detected events retained by the cut, i.e. the upper limit of the experimental centrality , is simply related to the upper limit of the impact parameter by . is the SCA upper limit of impact parameter for all detected events, which in the present case is to a very good approximation equivalent to the value of in Eq. 12. Thus the SCA predicts for a centrality cut an upper limit of impact parameter fm, whereas in reality the impact parameters of this selection can be seen in Figure 2(b) to have a very broad distribution which extends up to 8 fm.
| System | Mass | Trigger | Events | ||
| asymmetry | [MeV/ | multiplicity | |||
| nucleon] | |||||
| 36Ar+KCl [37] | 0.00 | 31. | 54 | 3 | 3216332 |
| 39. | 97 | 3 | 3496188 | ||
| 51. | 66 | 3 | 2391311 | ||
| 74. | 00 | 3 | 3337570 | ||
| 36Ar+58Ni [38, 39] | 0.23 | 31. | 54 | 3 | 8259867 |
| 39. | 97 | 3 | 7234383 | ||
| 51. | 66 | 3 | 8599855 | ||
| 63. | 03 | 3 | 5020363 | ||
| 74. | 00 | 4 | 7648474 | ||
| 83. | 63 | 4 | 4657028 | ||
| 95. | 22 | 4 | 9799670 | ||
| 58Ni+58Ni [40, 41] | 0.00 | 31. | 98 | 4 | 4538513 |
| 52. | 00 | 4 | 4738429 | ||
| 63. | 63 | 4 | 4473639 | ||
| 73. | 96 | 4 | 5198692 | ||
| 82. | 00 | 4 | 5578566 | ||
| 90. | 00 | 4 | 9144521 | ||
| 58Ni+197Au [42] | 0.55 | 31. | 98 | 4 | 7448285 |
| 52. | 00 | 4 | 7941858 | ||
| 63. | 63 | 4 | 4720169 | ||
| 73. | 96 | 4 | 6685519 | ||
| 82. | 00 | 4 | 7398023 | ||
| 129Xe+natSn[43, 32] | 0.04 | 24. | 98 | 4 | 5288164 |
| 32. | 00 | 4 | 3916797 | ||
| 38. | 98 | 4 | 5261377 | ||
| 45. | 00 | 4 | 6067739 | ||
| 50. | 13 | 4 | 5792220 | ||
| 129Xe+124Sn(*) [31] | 0.02 | 65. | 00 | 3 | 881642 |
| 80. | 00 | 3 | 424357 | ||
| 100. | 00 | 3 | 1328486 | ||
| 197Au+197Au(*) [44] | 0.00 | 40. | 00 | 3 | 2783629 |
| 60. | 00 | 3 | 7589902 | ||
| 80. | 00 | 3 | 3545170 | ||
| 100. | 00 | 3 | 10691556 | ||
III Results
In the following we will present the results of applying the method presented in Sec. II to data for a wide range of different colliding systems measured with INDRA, which are summarized in Table 1. The data concern the two observables which are most commonly used for centrality estimation and/or selections in this energy range, namely the total multiplicity of charged reaction products, , and the total transverse energy of light charged particles (LCP, isotopes of nuclei), . is the impact parameter filter most commonly-used by many different groups in the intermediate energy range, while has been especially used by the INDRA collaboration as it exploits the very high, angle- and centrality-independent efficiency of the array for detection of LCP.
III.1 Experimental details
Impact parameter estimation and sorting of HIC in the energy range 20–100 MeV/nucleon requires powerful multidetector arrays with high granularity and angular coverage. Let us briefly recall here that INDRA [30, 45] is one of a second generation of charged particle arrays, in continued use for the study of HIC at GANIL in Caen (and briefly at GSI, Darmstadt) since 1993. Its 336 multi-layer detection modules covering of the solid angle around the target, low detection and identification thresholds, and minimum-bias trigger logic based on the number of fired modules make it ideally suited for impact parameter reconstruction in this energy range. References to the original papers where details of the data-taking can be found for each measured reaction are given in Table 1.
Also in Table 1, as well as the mass asymmetry, projectile energy and number of recorded events, we give also the trigger multiplicity (corresponding to the minimum number of fired modules required to record an event, which may include -ray, electron, pion or neutron detection in the CsI scintillators) for each reaction. In the offline analysis the same condition was applied to the reconstructed events (corresponding to a minimum number of correctly identified charged products, thus excluding -rays etc.).
III.2 Results of fits to data
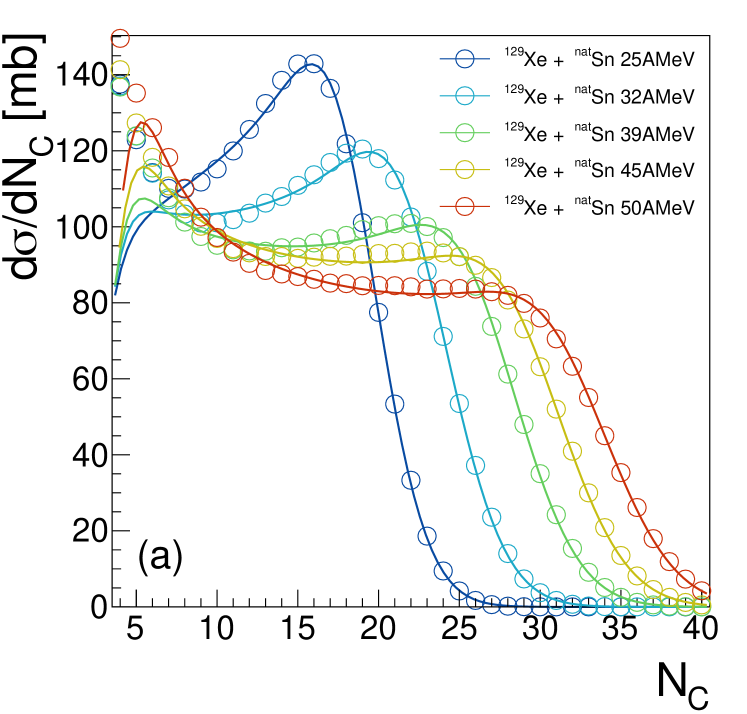
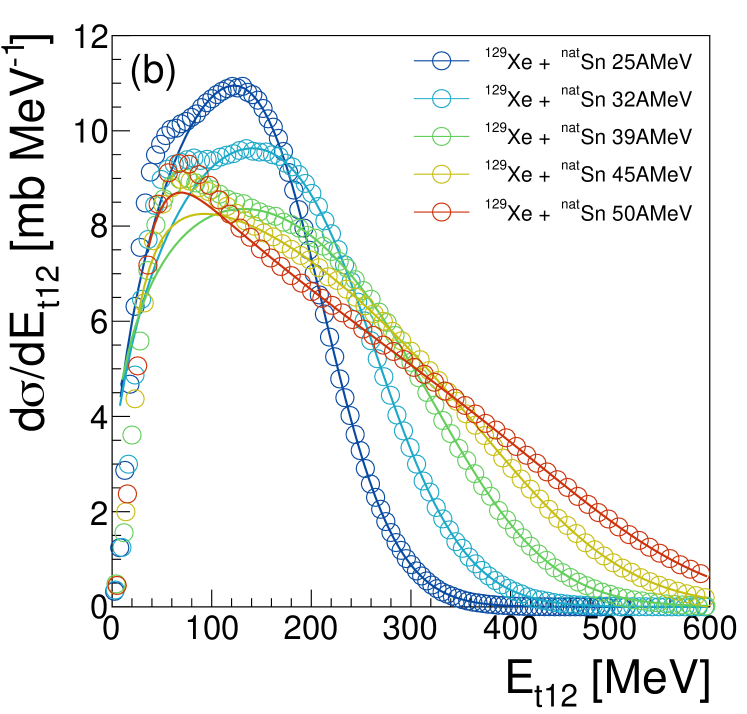
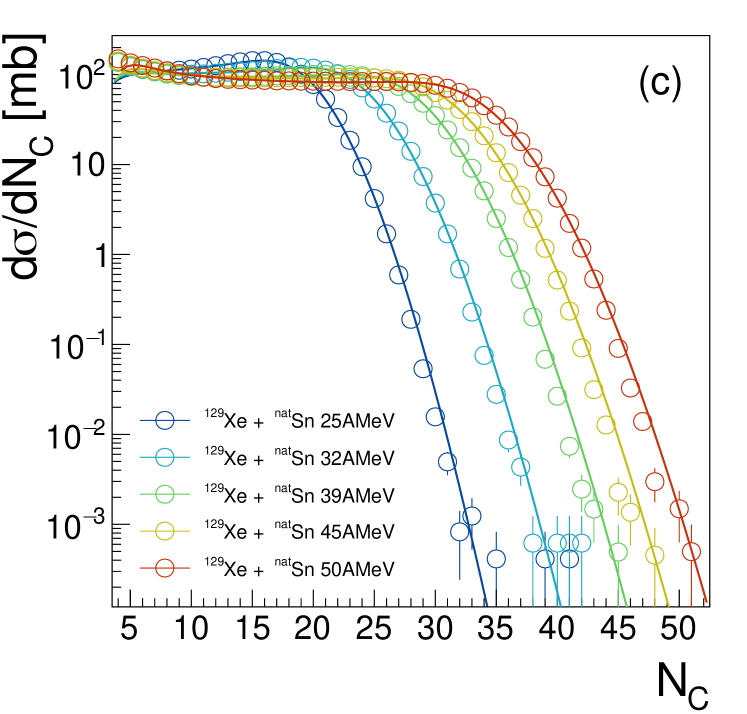
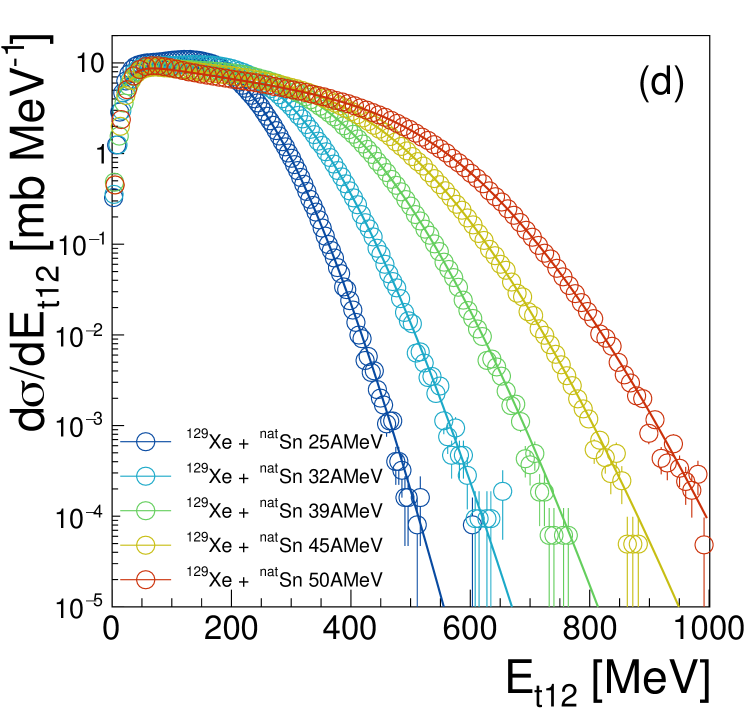
Examples of fits to the inclusive distributions of the observables and are presented in Figure 3, for the 129Xe+natSn data. Fits were performed using Eqs. 3, 9 and 10 and fit parameters are given in Tables 2 and 3 for and , respectively. Using the measured reaction cross-sections for this data [32], the experimental and fitted distributions are presented here as differential cross-sections. To better appreciate the quality of the fits, for both low and high statistics regions of the distributions, each is presented with both linear (top row) and logarithmic (bottom row) -axes.
Apart from the lowest or values, close to the trigger threshold, the shapes of the experimental distributions are globally well reproduced by each fit, especially the exponential tails for the highest multiplicities/energies. Reduced values for each fit are reported in Tables 2 and 3. For this goodness-of-fit parameter is generally excellent (), whereas for the values are less satisfactory, despite the visual impression of adequate fits: this is due to the sharp decrease of the fitted distributions at small , which due to the high statistics in this region dominates the overall values. Nevertheless, it can be remarked that the deduced values for follow remarkably well the minimum multiplicity imposed by the trigger, including the increase from to for the 36Ar+58Ni data at 74 MeV/nucleon (see Table 2). Fits of similar quality for both observables were obtained for all data in this study, the parameters of which are given in Tables 2 and 3.
III.3 Deduced probability distributions for impact parameter and observable
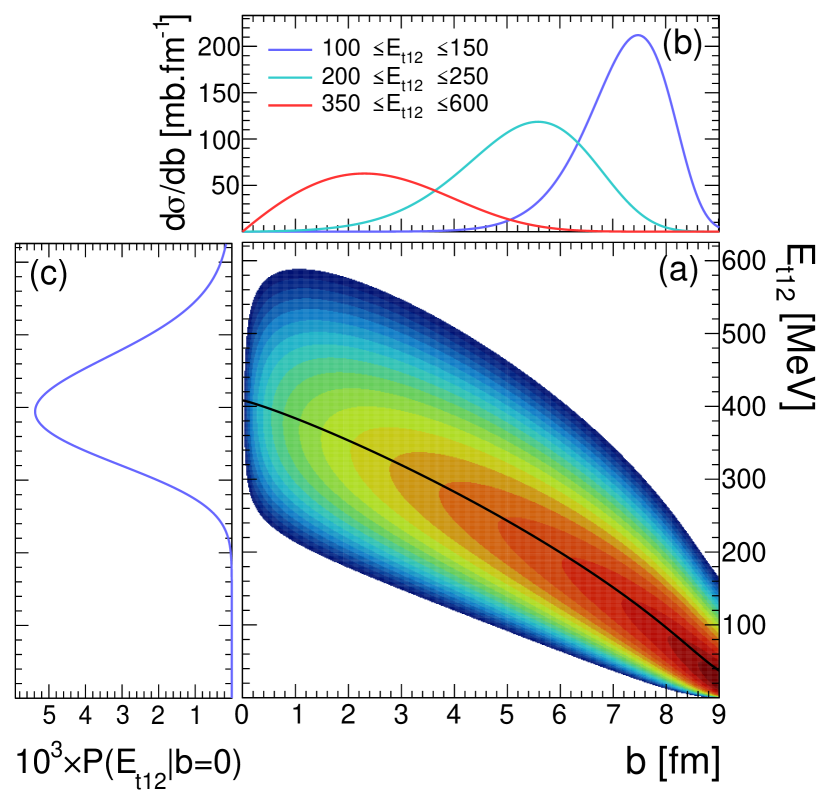
Fitting the experimental distribution determines the parameters of the conditional probability distribution or , and hence the joint probability distribution of observable and impact parameter, . An example is shown in Figure 4(a) for the case of 129Xe+natSn collisions at 39 MeV/nucleon using the total transverse energy of light charged particles, . As shown in the figure, the joint probability distribution encodes not only the dependence of the mean value on impact parameter, given by (see Eqs. 9, 10), but crucially also the fluctuations around this mean value at fixed , determined by the parameter .
It is clear from the joint probability distribution shown in Figure 4(a) that any selection of events using cuts will necessarily lead to broad impact parameter distributions. This is confirmed by Figure 4(b) which presents impact parameter distributions corresponding to three bins, calculated according to Eqs. 6 and 8. From the figure it can be seen that these are simply projections of on to the impact parameter axis, integrated over different ranges of . The distributions of for the three cuts are very broad and overlap to a large extent.
Finally, Figure 4(c) shows a specific projection of on to the axis, corresponding to , the deduced distribution of for head-on collisions. It is also, as expected, very broad: the variance of this distribution is determined by the product of the reduced fluctuation parameter, , and the mean value of the observable for collisions. The values of for this system and all others, and for both and observables are given in Tables 2 and 3. For the fits to 129Xe+natSn data shown in Figure 3, they are much smaller for () than for (). In fact, as a general result for the whole set of reactions studied here, we find that total charged multiplicity fluctuations are relatively small () and nearly independent of bombarding energy, whereas fluctuations are relatively large () and increase with beam energy. Let us recall that a similar difference in order of magnitude for was also found with the AMD calculations shown in Figure 1(a).
III.4 System mass- and bombarding-energy dependence of mean values of observables for
Figures 5 and 6 present the evolution of and extrapolated to head-on collisions for all studied reactions as a function of the available center of mass energy, in order to allow equivalent comparison for symmetric and asymmetric colliding systems.
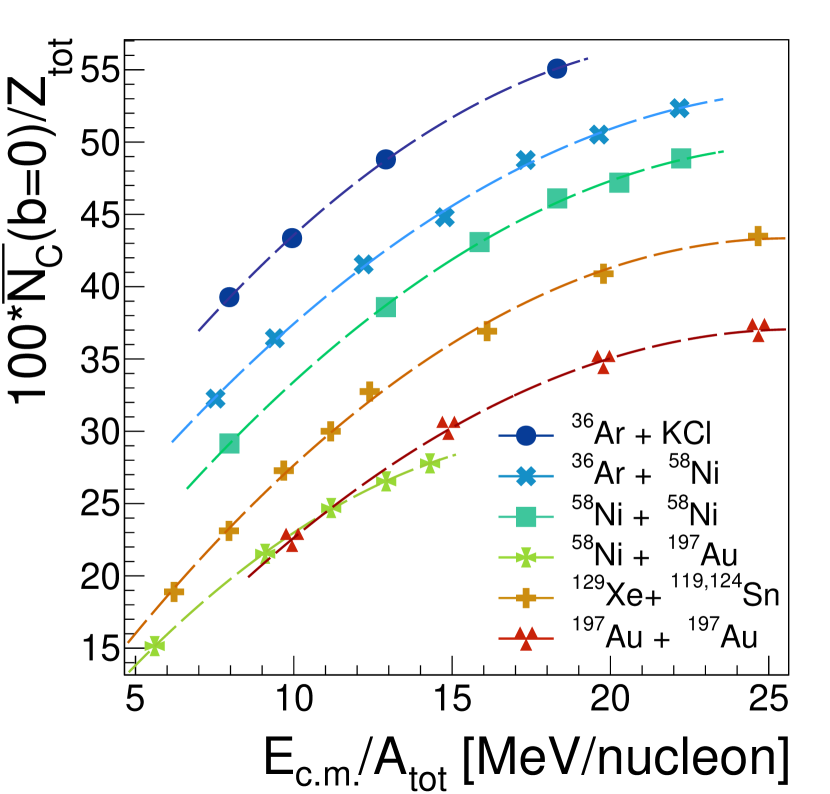
The total multiplicities in Figure 5 have been normalized to the size of each system, , given by the sum of projectile and target atomic numbers. is the maximum possible charged product multiplicity for each reaction, if complete disintegration into hydrogen isotopes and (undetected) neutrons were to occur. Thus the quantity reflects the degree to which complete disintegration would occur in head-on collisions for each reaction. For all systems this ratio increases in a similar fashion with available energy, closely following a parabolic dependence (shown by the dashed curves in Figure 5). It should be noted that the 129Xe+xSn data, taken in two separate experimental campaigns, at GANIL (129Xe+natSn: 50 MeV/nucleon) and at GSI (129Xe+124Sn: 65 MeV/nucleon), follows a continuous evolution over the full energy range. There is also a systematic system size/mass dependence of the ratio, which is larger at a given available energy for smaller systems. Thus for 20 MeV/nucleon it can be seen that the 58Ni+58Ni system reaches 50% of complete disintegration, whereas for 197Au+197Au the degree is no greater than 35%. We remark that the asymmetric system, 58Ni+197Au, does not appear to follow the same systematic trend: it could have been expected to have the same dependence on as 129Xe+xSn, which has approximately the same total mass and charge but a quasi-symmetric entrance channel.
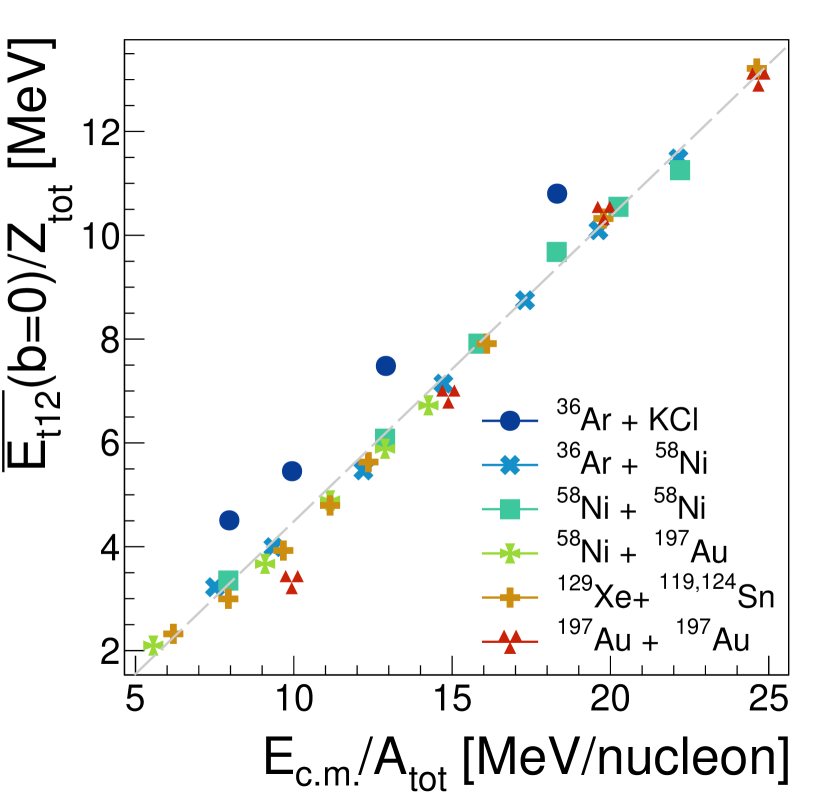
Figure 6 shows the extrapolated for collisions for all systems, again as a function of available energy. The normalization to the total system charge here has no direct physical interpretation, but empirically we have found that it leads to a near-universal scaling of the data which collapse onto a linear dependence of the total transverse energy of LCP that would be achieved in head-on collisions as a function of the c.m. energy. Again, it can be remarked that data from campaigns in both GANIL and GSI (129Xe+124Sn: 65 MeV/nucleon and 197Au+197Au) follow the same systematic trends, including this time the 58Ni+197Au system; on the other hand, here it is the 36Ar+KCl data which do not follow the trend, in actual fact because the unscaled values for this system are almost identical to those for 36Ar+58Ni.
We know of no reason why the mean transverse energy of light charged particles for collisions should scale in this way, over such a wide range of system sizes, asymmetries, and bombarding energies. It is our opinion that this result should be compared with the predictions of different transport models in this energy range, for which it could provide a benchmark test.
III.5 System mass- and bombarding-energy dependence of mean impact parameters of events selected with a high- cut
As we recalled in the introduction, it is a well-known fact that when trying to select more and more central collisions using high- or cuts, a large amount of impact parameter mixing occurs leading ultimately to a finite limit on the true centrality of any selected sample of events. We can now quantify this saturation by providing an estimate of for any selection of data, without relying on any specific model of collisions. We present here the mean values of reduced impact parameter for cuts corresponding to experimental centralities or performed using the total transverse energy of LCP, . It should be noted that equivalent results are found using the observable.
Figure 7 shows the mean value of for the impact parameter distributions we have reconstructed for all systems and bombarding energies and for the two cuts, as a function of the available center of mass energy of each reaction. The values of can be seen to cluster around a near-universal energy dependency for each cut, which appears to be independent of system mass and entrance channel asymmetry. In each case, decreases with increasing center of mass energy. With the more restrictive cut of , the selectivity of the cuts can be seen to increase significantly, especially for the highest energies. Values of are obtained for the 10% centrality cut, and with the 1% centrality cut.
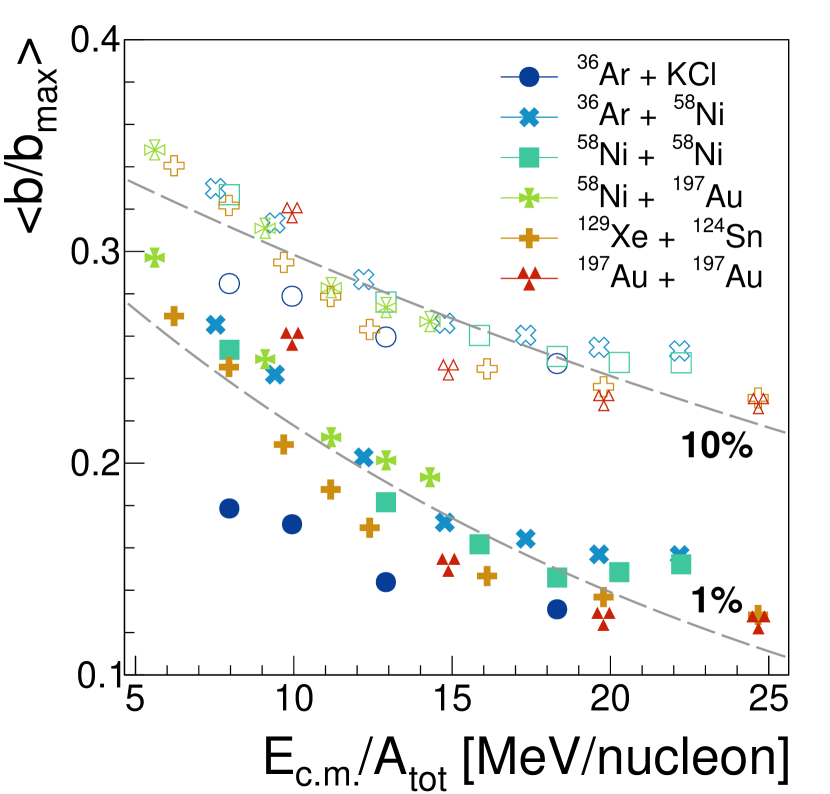
It is instructive to compare these results with the predictions of the sharp cut-off approximation (SCA) for the same cuts (see the end of Sec. II.3). The SCA would expect an energy-independent upper limit of for the 10% cut, or with a 1% centrality cut. For a geometric (triangular) impact parameter distribution, the mean value is simply related to the cut-off by , therefore the mean values in Figure 7 should be compared to in the case of the 10% centrality cut, and for . It is clear that impact parameter estimation using the SCA for central collisions greatly underestimates representative values of for the selected data samples. The method presented in this paper can characterize data not only in terms of far more representative mean values of , but indeed provide an estimation of the actual impact parameter distribution which could be used as input to a transport model calculation.
| System | |||||||||||||
| [MeV/nucleon] | |||||||||||||
| 36Ar+KCl | 32 | 0. | 95 | 1. | 25 | 0. | 20 | 14. | 1 | 3. | 7 | 13. | 2 |
| 40 | 0. | 98 | 1. | 46 | 0. | 23 | 15. | 6 | 4. | 2 | 6. | 5 | |
| 52 | 0. | 88 | 1. | 40 | 0. | 22 | 17. | 6 | 4. | 0 | 8. | 2 | |
| 74 | 0. | 89 | 1. | 60 | 0. | 21 | 19. | 8 | 4. | 3 | 10. | 2 | |
| 36Ar+58Ni | 32 | 1. | 37 | 1. | 12 | 0. | 25 | 14. | 8 | 2. | 5 | 85. | 4 |
| 40 | 1. | 23 | 1. | 14 | 0. | 27 | 16. | 8 | 2. | 6 | 46. | 4 | |
| 52 | 1. | 07 | 1. | 17 | 0. | 28 | 19. | 1 | 2. | 7 | 53. | 5 | |
| 63 | 0. | 99 | 1. | 19 | 0. | 29 | 20. | 6 | 2. | 7 | 28. | 1 | |
| 74 | 0. | 95 | 1. | 21 | 0. | 27 | 22. | 4 | 3. | 8 | 43. | 8 | |
| 84 | 0. | 96 | 1. | 24 | 0. | 27 | 23. | 2 | 3. | 8 | 25. | 8 | |
| 95 | 0. | 98 | 1. | 28 | 0. | 27 | 24. | 1 | 3. | 9 | 56. | 3 | |
| 58Ni+58Ni | 32 | 1. | 24 | 1. | 19 | 0. | 28 | 16. | 3 | 3. | 7 | 55. | 4 |
| 52 | 0. | 97 | 1. | 15 | 0. | 30 | 21. | 6 | 3. | 8 | 14. | 0 | |
| 63 | 0. | 92 | 1. | 16 | 0. | 28 | 24. | 1 | 3. | 8 | 5. | 9 | |
| 74 | 0. | 81 | 1. | 17 | 0. | 27 | 25. | 8 | 3. | 7 | 4. | 2 | |
| 82 | 0. | 96 | 1. | 45 | 0. | 29 | 26. | 4 | 4. | 6 | 8. | 1 | |
| 90 | 0. | 93 | 1. | 40 | 0. | 28 | 27. | 4 | 4. | 2 | 38. | 2 | |
| 58Ni+197Au | 32 | 1. | 79 | 1. | 79 | 0. | 34 | 16. | 2 | 4. | 1 | 84. | 3 |
| 52 | 1. | 63 | 1. | 66 | 0. | 37 | 23. | 0 | 4. | 2 | 49. | 5 | |
| 64 | 1. | 48 | 1. | 64 | 0. | 37 | 26. | 4 | 4. | 3 | 15. | 1 | |
| 74 | 1. | 44 | 1. | 62 | 0. | 39 | 28. | 4 | 4. | 1 | 45. | 6 | |
| 82 | 1. | 51 | 1. | 85 | 0. | 41 | 29. | 7 | 4. | 7 | 43. | 2 | |
| 129Xe+natSn | 25 | 1. | 26 | 0. | 95 | 0. | 32 | 19. | 6 | 2. | 8 | 63. | 5 |
| 32 | 1. | 24 | 1. | 08 | 0. | 34 | 24. | 0 | 3. | 2 | 40. | 3 | |
| 39 | 1. | 18 | 1. | 17 | 0. | 34 | 28. | 4 | 3. | 5 | 55. | 1 | |
| 45 | 1. | 14 | 1. | 23 | 0. | 34 | 31. | 2 | 3. | 8 | 56. | 5 | |
| 50 | 1. | 14 | 1. | 35 | 0. | 34 | 34. | 1 | 4. | 0 | 36. | 6 | |
| 129Xe+124Sn | 65 | 1. | 09 | 1. | 40 | 0. | 36 | 38. | 4 | 2. | 9 | 2. | 0 |
| 80 | 1. | 11 | 1. | 50 | 0. | 34 | 42. | 5 | 3. | 1 | 1. | 5 | |
| 100 | 1. | 18 | 1. | 64 | 0. | 38 | 45. | 2 | 3. | 5 | 2. | 7 | |
| 197Au+197Au | 40 | 1. | 23 | 1. | 27 | 0. | 42 | 35. | 5 | 2. | 1 | 30. | 1 |
| 60 | 1. | 22 | 1. | 62 | 0. | 45 | 47. | 8 | 1. | 2 | 68. | 1 | |
| 80 | 1. | 24 | 1. | 61 | 0. | 45 | 54. | 9 | 2. | 8 | 16. | 9 | |
| 100 | 1. | 26 | 1. | 64 | 0. | 49 | 58. | 5 | 3. | 1 | 52. | 0 | |
| System | |||||||||||
| [MeV/nucleon] | [MeV] | [MeV] | [MeV] | ||||||||
| 36Ar+KCl | 32 | 0. | 35 | 0. | 76 | 6. | 1 | 162 | 3 | 1. | 2 |
| 40 | 0. | 37 | 0. | 89 | 7. | 5 | 196 | 8 | 1. | 0 | |
| 52 | 0. | 35 | 1. | 02 | 8. | 5 | 269 | 12 | 1. | 2 | |
| 74 | 0. | 40 | 1. | 32 | 11. | 8 | 389 | 19 | 3. | 7 | |
| 36Ar+58Ni | 32 | 0. | 97 | 1. | 17 | 8. | 5 | 148 | 9 | 3. | 3 |
| 40 | 0. | 83 | 1. | 17 | 10. | 0 | 183 | 11 | 2. | 5 | |
| 52 | 0. | 68 | 1. | 26 | 12. | 0 | 251 | 15 | 2. | 3 | |
| 63 | 0. | 60 | 1. | 35 | 13. | 1 | 328 | 18 | 1. | 3 | |
| 74 | 0. | 60 | 1. | 46 | 14. | 9 | 402 | 30 | 1. | 8 | |
| 84 | 0. | 60 | 1. | 52 | 16. | 1 | 463 | 32 | 1. | 7 | |
| 95 | 0. | 62 | 1. | 63 | 18. | 6 | 528 | 35 | 2. | 1 | |
| 58Ni+58Ni | 32 | 0. | 79 | 1. | 04 | 9. | 9 | 186 | 21 | 1. | 6 |
| 52 | 0. | 56 | 1. | 15 | 13. | 0 | 340 | 29 | 2. | 3 | |
| 64 | 0. | 55 | 1. | 30 | 14. | 9 | 443 | 33 | 1. | 7 | |
| 74 | 0. | 52 | 1. | 40 | 16. | 7 | 541 | 37 | 2. | 8 | |
| 82 | 0. | 61 | 1. | 68 | 18. | 5 | 591 | 46 | 1. | 7 | |
| 90 | 0. | 68 | 1. | 93 | 20. | 9 | 629 | 56 | 1. | 4 | |
| 58Ni+197Au | 32 | 1. | 41 | 1. | 71 | 12. | 8 | 223 | 32 | 6. | 7 |
| 52 | 1. | 08 | 1. | 45 | 17. | 2 | 391 | 36 | 6. | 1 | |
| 64 | 0. | 93 | 1. | 50 | 18. | 8 | 521 | 39 | 3. | 8 | |
| 74 | 0. | 92 | 1. | 63 | 21. | 6 | 630 | 44 | 4. | 8 | |
| 82 | 0. | 92 | 1. | 74 | 23. | 3 | 716 | 48 | 5. | 8 | |
| 129Xe+natSn | 25 | 0. | 74 | 0. | 68 | 11. | 1 | 241 | 6 | 2. | 2 |
| 32 | 0. | 67 | 0. | 69 | 12. | 4 | 310 | 5 | 1. | 7 | |
| 39 | 0. | 57 | 0. | 75 | 13. | 9 | 408 | 7 | 2. | 9 | |
| 45 | 0. | 55 | 0. | 89 | 15. | 4 | 496 | 24 | 1. | 6 | |
| 50 | 0. | 57 | 1. | 06 | 16. | 0 | 584 | 34 | 1. | 3 | |
| 129Xe+124Sn | 65 | 0. | 59 | 1. | 32 | 19. | 9 | 822 | 34 | 1. | 5 |
| 80 | 0. | 61 | 1. | 52 | 23. | 5 | 1071 | 41 | 2. | 0 | |
| 100 | 0. | 62 | 1. | 65 | 26. | 8 | 1374 | 44 | 3. | 6 | |
| 197Au+197Au | 40 | 1. | 07 | 1. | 23 | 24. | 0 | 521 | 18 | 24. | 4 |
| 60 | 0. | 67 | 1. | 38 | 25. | 5 | 1089 | 5 | 24. | 6 | |
| 80 | 0. | 62 | 1. | 47 | 26. | 6 | 1648 | 31 | 3. | 0 | |
| 100 | 0. | 65 | 1. | 68 | 34. | 6 | 2054 | 55 | 4. | 4 | |
IV Conclusions
One way to improve constraints on the nuclear equation of state from comparisons between data on intermediate energy heavy-ion collisions and transport model calculations is by providing a model-independent estimation of the impact parameter distribution representative of any selected set of experimental data. To do so requires to explicitly take into account the fluctuations in the relationship between any observable and the impact parameter , as first shown in [24, 25]. In this article we have shown how the method, first developed for ultra-relativistic collisions, can be adapted and used in the 20–100 MeV/nucleon bombarding energy range. Notably, we have proposed a new parametrization of the relationship between the mean value of an observable and the impact parameter whose parameters are simple to interpret in terms of the shape of this relationship.
We have shown, using a complete simulation of 58Ni+58Ni collisions at 52 MeV/nucleon measured by the INDRA array, calculated using the AMD transport model coupled with the GEMINI++ statistical decay code, that the method is capable of reconstructing the impact parameter distributions associated to experimental events taking account of secondary decay and finite detector acceptance effects. In this example, the impact parameter distributions for a set of experimental cuts defined over the full range of centralities were correctly reproduced, and even for the most central cut for which the method shows a slight underestimation of the actual impact parameters, the estimated impact parameter distribution is far closer to the truth than an estimation based on the commonly-used sharp cut-off approximation. These calculations also indicate that one of the major assumptions of the method, that the reduced variance of the observable is independent of centrality, is a reasonable approximation, at least for the two observables we have studied in this paper.
We then applied the approach to a very wide range of data for different collisions measured with INDRA between 25 MeV/nucleon and 100 MeV/nucleon, where in each case the data were recorded according to a “minimum-bias” trigger based on a minimum number of fired telescopes over nearly the full solid angle around the target. Two commonly-used observables have been employed, the total multiplicity of charged products, , and the total transverse energy of light charged particles with , . Excellent fits to the inclusive distributions of each observable have been achieved for all collisions, even if for the failure to reproduce the distributions close to the minimum bias trigger (most peripheral collisions) biases the apparent goodness-of-fit as measured by reduced values.
The parameters determined by the fits allow to deduce the joint probability distribution from which impact parameter distributions for any selection of data can be reconstructed, or distributions of the observable for a given range of . The relative fluctuation of the joint probability distributions about the mean value of the observable for each has been shown to differ according to the observable, with the total multiplicity of charged products, , associated with sub-Poissonian fluctuations (), whereas the total transverse energy of light charged particles, , exhibits much larger fluctuations (), for all data studied in this article.
The asymptotic values of the mean values of both observables for collisions can be extrapolated from the fit results, and may provide new constraints for transport model calculations. We have shown, in particular, that the total transverse energy of light charged particles has mean values for head-on collisions which show a near-universal dependence on the available energy in the center of mass of the collisions. This result should be confronted with different microscopic model predictions.
Finally, we have characterized the true centrality of a commonly-used event selection employing high- cuts to retain the “most central collisions”. The results are largely independent of total system mass and mass-asymmetry of the entrance channel, each system showing very similar evolution of the mean reduced impact parameter as a function of available energy for each centrality cut. The actual representative mean values of reduced impact parameters for these selections were shown to decrease with increasing bombarding energy from 0.35 to 0.24 (for a 10% centrality cut), or from 0.29 to 0.14 (for a 1% centrality cut), when the usual sharp cut-off approximation (SCA) gives mean values of 0.2 or 0.07, respectively, for these two centrality cuts, independently of the reaction bombarding energy. This overestimation of the centrality of each data sample would skew comparison with any transport model by using the wrong impact parameters as input. This is why we have tried to demonstrate in this paper that a new, model-independent method for estimating the impact parameter distributions of selected experimental events is feasible and should be used whenever possible in order to improve the constraints that can be brought on the description of nuclear dynamics and the nuclear equation of state by comparisons between experimental data and microscopic transport model calculations.
Acknowledgements.
We would like to thank all the technical staff of GANIL for their continued support in performing the experiments. We gratefully acknowledge support from the CNRS/IN2P3 Computing Center (Lyon - France) for providing computing and data-processing resources needed for this work. We would also like to thank the ROOT [46] development team without whose software none of the analyses would be possible. We acknowledge support from Région Normandie under the Réseau d’Intérêt Normand FIDNEOS (RIN/FIDNEOS). We would also like to signal that the software necessary to perform the analyses presented in this paper will be made available to the entire community as part of the KaliVeda heavy-ion analysis toolkit [29] upon publication.Appendix A Inclusive impact parameter distributions for INDRA data
In order to transform deduced centrality distributions into impact parameter distributions using Eq. 8 requires to calculate the centrality for each impact parameter, , (Eq. 16) and deduce the value of from the (measured) total reaction cross-section by numerical inversion of Eq. 14, assuming a typical value of fm.
A.1 Analytic expression for total cross-section
To calculate the total reaction cross-section for a given set of parameters and , we have, by definition,
and making the substitutions and we arrive at
This definite integral is related to the complete Fermi-Dirac integral
| (13) |
with , where is the gamma function, for integer . In general the value of this integral is given by a polylogarithm, , specifically
and in this particular case by the negative dilogarithm, . Therefore we have for the final expression of the total cross-section which normalizes correctly the probability distribution of Eq. (12),
| (14) |
This expression can be used to find for a given total cross-section and width parameter , by numerical inversion [46].
A.2 Analytic expression for centrality
To calculate the centrality we substitute Eq. (12) into Eq. (2), and making the same substitutions as above (, ) we find
This definite integral can be calculated using the incomplete Fermi-Dirac integral
with , and the complete Fermi-Dirac integral of Eq. (13):
With , as above, while the incomplete FD integral can be written (by integration by parts) as
The final expression for the centrality is therefore
| (16) | |||||
References
- Lattimer and Prakash [2000] J. M. Lattimer and M. Prakash, Physics Reports 333-334, 121 (2000).
- Abbott et al. [2017] B. P. Abbott et al., Physical Review Letters 119, 161101 (2017).
- Horowitz et al. [2014] C. J. Horowitz, E. F. Brown, Y. Kim, W. G. Lynch, R. Michaels, A. Ono, J. Piekarewicz, M. B. Tsang, and H. H. Wolter, Journal of Physics G: Nuclear and Particle Physics 41, 093001+ (2014).
- Pais et al. [2019] H. Pais, F. Gulminelli, C. Providência, and G. Röpke, Physical Review C 99, 55806 (2019).
- Grégoire et al. [1987] C. Grégoire, B. Remaud, F. Sébille, L. Vinet, and Y. Raffray, Nuclear Physics A 465, 317 (1987).
- Bertsch and Das Gupta [1988] G. F. Bertsch and S. Das Gupta, Physics Reports 160, 189 (1988).
- Aichelin [1991] J. Aichelin, Physics Reports 202, 233 (1991).
- Ono et al. [1992] A. Ono, H. Horiuchi, T. Maruyama, and A. Ohnishi, Progress of Theoretical Physics 87, 1185 (1992).
- Ayik et al. [1992] S. Ayik, E. Suraud, M. Belkacem, and D. Boilley, Nuclear Physics A 545, 35 (1992).
- Bonasera et al. [1994] A. Bonasera, F. Gulminelli, and J. Molitoris, Physics Reports 243, 1 (1994).
- Ono and Horiuchi [2004] A. Ono and H. Horiuchi, Progress in Particle and Nuclear Physics 53, 501 (2004).
- Buss et al. [2012] O. Buss, T. Gaitanos, K. Gallmeister, H. van Hees, M. Kaskulov, O. Lalakulich, A. B. Larionov, T. Leitner, J. Weil, and U. Mosel, Physics Reports 512, 1 (2012).
- Napolitani and Colonna [2013] P. Napolitani and M. Colonna, Physics Letters B 726, 382 (2013).
- Lin and Danielewicz [2019] H. Lin and P. Danielewicz, Physical Review C 99, 1 (2019), arXiv:1807.05673 .
- Xu et al. [2016] J. Xu, L.-W. Chen, M. B. Tsang, H. Wolter, Y.-X. Zhang, J. Aichelin, M. Colonna, D. Cozma, P. Danielewicz, Z.-Q. Feng, A. Le Fèvre, T. Gaitanos, C. Hartnack, K. Kim, Y. Kim, C.-M. Ko, B.-A. Li, Q.-F. Li, Z.-X. Li, P. Napolitani, A. Ono, M. Papa, T. Song, J. Su, J.-L. Tian, N. Wang, Y.-J. Wang, J. Weil, W.-J. Xie, F.-S. Zhang, and G.-Q. Zhang, Physical Review C 93, 044609 (2016).
- Zhang et al. [2018] Y.-X. Zhang, Y.-J. Wang, M. Colonna, P. Danielewicz, A. Ono, M. B. Tsang, H. Wolter, J. Xu, L.-W. Chen, D. Cozma, Z.-Q. Feng, S. Das Gupta, N. Ikeno, C.-M. Ko, B.-A. Li, Q.-F. Li, Z.-X. Li, S. Mallik, Y. Nara, T. Ogawa, A. Ohnishi, D. Oliinychenko, M. Papa, H. Petersen, J. Su, T. Song, J. Weil, N. Wang, F.-S. Zhang, and Z. Zhang, Physical Review C 97, 034625 (2018).
- Péter et al. [1990] J. Péter, D. Cussol, G. Bizard, R. Brou, M. Louvel, J. Patry, R. Regimbart, J. Steckmeyer, J. Sullivan, B. Tamain, E. Crema, H. Doubre, K. Hagel, G. Jin, A. Péghaire, F. Saint-Laurent, Y. Cassagnou, R. Legrain, C. Lebrun, E. Rosato, R. MacGrath, S. Jeong, S. Lee, Y. Nagashima, T. Nakagawa, M. Ogihara, J. Kasagi, and T. Motobayashi, Nuclear Physics A 519, 611 (1990).
- Phair et al. [1992] L. Phair, D. Bowman, C. Gelbke, W. Gong, Y. Kim, M. Lisa, W. Lynch, G. Peaslee, R. de Souza, M. Tsang, and F. Zhu, Nuclear Physics A 548, 489 (1992).
- Zhang et al. [2011] G. Q. Zhang, Y. G. Ma, X. G. Cao, C. L. Zhou, X. Z. Cai, D. Q. Fang, W. D. Tian, and H. W. Wang, Physical Review C 84, 034612 (2011).
- Li et al. [2018] L. Li, Y. Zhang, Z. Li, N. Wang, Y. Cui, and J. Winkelbauer, Physical Review C 97, 044606 (2018).
- Nebauer et al. [1999] R. Nebauer, J. Aichelin, M. Assenard, G. Auger, C. Bacri, F. Bocage, R. Bougault, R. Brou, P. Buchet, J. Charvet, A. Chbihi, J. Colin, D. Cussol, R. Dayras, A. Demeyer, D. Doré, D. Durand, P. Eudes, E. Galichet, E. Genouin-Duhamel, E. Gerlic, M. Germain, D. Gourio, D. Guinet, P. Lautesse, J. Laville, T. Lefort, R. Legrain, N. Le Neindre, O. Lopez, M. Louvel, A. Maskay, L. Nalpas, A. Nguyen, M. Parlog, J. Péter, A. Rahmani, T. Reposeur, E. Rosato, F. Saint-Laurent, S. Salou, J. Steckmeyer, M. Stern, G. Tabacaru, B. Tamain, L. Tassan-Got, O. Tirel, E. Vient, C. Volant, and J. Wieleczko, Nuclear Physics A 658, 67 (1999).
- Cavata et al. [1990] C. Cavata, M. Demoulins, J. Gosset, M.-C. Lemaire, D. L’Hôte, J. Poitou, and O. Valette, Physical Review C 42, 1760 (1990).
- Haddad et al. [1997] F. Haddad, K. Hagel, J. Li, N. Mdeiwayeh, J. B. Natowitz, R. Wada, B. Xiao, C. David, M. Freslier, and J. Aichelin, Physical Review C 55, 1371 (1997).
- Das et al. [2018] S. J. Das, G. Giacalone, P.-A. Monard, and J.-Y. Ollitrault, Physical Review C 97, 014905 (2018).
- Rogly et al. [2018] R. Rogly, G. Giacalone, and J.-Y. Ollitrault, Physical Review C 98, 024902 (2018).
- Ono [2019] A. Ono, Progress in Particle and Nuclear Physics 105, 139 (2019).
- Charity [2010] R. J. Charity, Physical Review C 82, 014610 (2010).
- Mancusi et al. [2010] D. Mancusi, R. J. Charity, and J. Cugnon, Physical Review C 82, 044610+ (2010).
- [29] KaliVeda heavy-ion analysis toolkit, http://indra.in2p3.fr/kaliveda .
- Pouthas et al. [1995] J. Pouthas, B. Borderie, R. Dayras, E. Plagnol, M. Rivet, F. Saint-Laurent, J. Steckmeyer, G. Auger, C. Bacri, S. Barbey, A. Barbier, A. Benkirane, J. Benlliure, B. Berthier, E. Bougamont, P. Bourgault, P. Box, R. Bzyl, B. Cahan, Y. Cassagnou, D. Charlet, J. Charvet, A. Chbihi, T. Clerc, N. Copinet, D. Cussol, M. Engrand, J. Gautier, Y. Huguet, O. Jouniaux, J. Laville, P. Le Botlan, A. Leconte, R. Legrain, P. Lelong, M. Le Guay, L. Martina, C. Mazur, P. Mosrin, L. Olivier, J. Passerieux, S. Pierre, B. Piquet, E. Plaige, E. Pollacco, B. Raine, A. Richard, J. Ropert, C. Spitaels, L. Stab, D. Sznajderman, L. Tassan-got, J. Tillier, M. Tripon, P. Vallerand, C. Volant, P. Volkov, J. Wieleczko, and G. Wittwer, Nuclear Instruments and Methods in Physics Research Section A: Accelerators, Spectrometers, Detectors and Associated Equipment 357, 418 (1995).
- Frankland et al. [2005] J. D. Frankland, A. Chbihi, A. Mignon, M. L. Begemann-Blaich, R. Bittiger, B. Borderie, R. Bougault, J.-L. Charvet, D. Cussol, R. Dayras, D. Durand, C. Escano-Rodriguez, E. Galichet, D. Guinet, P. Lautesse, A. Le Févre, R. Legrain, N. Le Neindre, O. Lopez, J. Łukasik, U. Lynen, L. Manduci, J. Marie, W. F. J. Müller, L. Nalpas, H. Orth, M. Pârlog, M. Pichon, M. F. Rivet, E. Rosato, R. Roy, A. Saija, C. Schwarz, C. Sfienti, B. Tamain, W. Trautmann, A. Trzcinski, K. Turzó, A. Van Lauwe, E. Vient, M. Vigilante, C. Volant, J. P. Wieleczko, and B. Zwieglinski, Physical Review C 71, 034607 (2005).
- Plagnol et al. [1999] E. Plagnol, J. Łukasik, G. Auger, C. O. Bacri, N. Bellaize, F. Bocage, B. Borderie, R. Bougault, R. Brou, P. Buchet, J. L. Charvet, A. Chbihi, J. Colin, D. Cussol, R. Dayras, A. Demeyer, D. Doré, D. Durand, J. D. Frankland, E. Galichet, E. Genouin-Duhamel, E. Gerlic, D. Guinet, P. Lautesse, J. L. Laville, J. F. Lecolley, R. Legrain, N. Le Neindre, O. Lopez, M. Louvel, A. M. Maskay, L. Nalpas, A. D. Nguyen, M. Pârlog, J. Péter, M. F. Rivet, E. Rosato, F. Saint-Laurent, S. Salou, J. C. Steckmeyer, M. Stern, G. Tabacaru, B. Tamain, L. Tassan-Got, O. Tirel, E. Vient, C. Volant, and J. P. Wieleczko, Physical Review C 61, 014606 (1999).
- Zbiri et al. [2007] K. Zbiri, A. L. Fèvre, J. Aichelin, J. Łukasik, W. Reisdorf, F. Gulminelli, U. Lynen, W. F. J. Müller, H. Orth, C. Schwarz, C. Sfienti, W. Trautmann, K. Turzó, B. Zwiegliński, J. L. Charvet, A. Chbihi, R. Dayras, D. Durand, J. D. Frankland, R. Legrain, N. L. Neindre, O. Lopez, L. Nalpas, M. Parlog, E. Plagnol, M. F. Rivet, E. Rosato, E. Vient, M. Vigilante, C. Volant, and J. P. Wieleczko, Physical Review C 75, 034612 (2007), arXiv:0607012 [nucl-th] .
- Le Fèvre et al. [2009] A. Le Fèvre, J. Aichelin, C. Hartnack, J. Lukasik, W. F. J. Müller, H. Orth, C. Schwarz, C. Sfienti, W. Trautmann, K. Turzó, B. Zwiegliński, A. Chbihi, J. D. Frankland, J. P. Wieleczko, M. Vigilante, J. Łukasik, W. F. J. Müller, H. Orth, C. Schwarz, C. Sfienti, W. Trautmann, K. Turzó, B. Zwiegliński, A. Chbihi, J. D. Frankland, J. P. Wieleczko, and M. Vigilante, Physical Review C - Nuclear Physics 80, 044615 (2009).
- Bonnet et al. [2014] E. Bonnet, M. Colonna, A. Chbihi, J. D. Frankland, D. Gruyer, and J. P. Wieleczko, Physical Review C 89, 034608 (2014), arXiv:1310.1890 .
- Vient et al. [2018] E. Vient, L. Manduci, E. Legouée, L. Augey, E. Bonnet, B. Borderie, R. Bougault, A. Chbihi, D. Dell’Aquila, Q. Fable, L. Francalanza, J. D. Frankland, E. Galichet, D. Gruyer, D. Guinet, M. Henri, M. La Commara, G. Lehaut, N. Le Neindre, I. Lombardo, O. Lopez, P. Marini, M. Pârlog, M. F. Rivet, E. Rosato, R. Roy, P. St-Onge, G. Spadaccini, G. Verde, and M. Vigilante, Physical Review C 98, 044612 (2018).
- Métivier et al. [2000] V. Métivier, B. Tamain, G. Auger, C. Bacri, J. Benlliure, F. Bocage, B. Borderie, R. Bougault, R. Brou, P. Buchet, J. Charvet, A. Chbihi, J. Colin, D. Cussol, R. Dayras, A. Demeyer, D. Doré, D. Durand, P. Ecomard, P. Eudes, D. Gourio, D. Guinet, R. Laforest, P. Lautesse, J. Laville, L. Lebreton, J. Lecolley, A. Le Fèvre, R. Legrain, O. Lopez, M. Louvel, N. Marie, L. Nalpas, M. Parlog, J. Péter, E. Plagnol, A. Rahmani, T. Reposeur, M. Rivet, E. Rosato, F. Saint-Laurent, J. Steckmeyer, L. Tassan-Got, E. Vient, C. Volant, and J. Wieleczko, Nuclear Physics A 672, 357 (2000).
- Bacri et al. [1995] C. Bacri, B. Borderie, J. Charvet, D. Cussol, R. Dayras, O. Lopez, A. Ouatizerga, M. Rivet, G. Auger, A. Benkirane, J. Benlliure, B. Berthier, R. Bougault, R. Brou, P. Box, Y. Cassagnou, A. Chbihi, J. Colin, E. De Filippo, A. Demeyer, D. Durand, P. Ecomard, P. Eudes, A. Genoux-Lubain, D. Gourio, D. Guinet, L. Lakehal-Ayat, P. Lautesse, J. Laville, L. Lebreton, C. Lebrun, J. Lecolley, A. Le Fèvre, R. Legrain, M. Louvel, M. Mahi, N. Marie, V. Mitivier, L. Nalpas, T. Nakagawa, M. Parlog, J. Péter, E. Plagnol, E. Pollacco, A. Rahmani, R. Regimbart, T. Reposeur, E. Rosato, F. Saint-Laurent, M. Squalli, J. Steckmeyer, B. Tamain, L. Tassan-Got, E. Vient, C. Volant, J. Wieleczko, A. Wieloch, and K. Yuasa-Nakagawa, Physics Letters B 353, 27 (1995).
- Rivet et al. [1996] M. Rivet, A. Chbihi, B. Borderie, P. Eudes, M. Parlog, L. Tassan-Got, G. Auger, C. Bacri, J. Benlliure, E. Bisquer, R. Bougault, R. Brou, J. Charvet, J. Colin, D. Cussol, R. Dayras, E. De Filippo, A. Demeyer, D. Doré, D. Durand, P. Ecomard, D. Gourio, D. Guinet, R. Laforest, P. Lautesse, J. Laville, L. Lebreton, J. Lecolley, A. Le Fèvre, T. Lefort, R. Legrain, O. Lopez, M. Louvel, N. Marie, V. Métivier, L. Nalpas, A. Ouatizerga, J. Péter, E. Plagnol, A. Rahmani, T. Reposeur, E. Rosato, F. Saint-Laurent, M. Squalli, J. Steckmeyer, B. Tamain, E. Vient, C. Volant, and J. Wieleczko, Physics Letters B 388, 219 (1996).
- Cussol et al. [2002] D. Cussol, T. Lefort, J. Péter, G. Auger, C. O. Bacri, F. Bocage, B. Borderie, R. Bougault, R. Brou, P. Buchet, J. L. Charvet, A. Chbihi, J. Colin, R. Dayras, A. Demeyer, D. Doré, D. Durand, P. Eudes, E. de Filippo, J. D. Frankland, E. Galichet, E. Genouin-Duhamel, E. Gerlic, M. Germain, D. Gourio, D. Guinet, P. Lautesse, J. L. Laville, J. F. Lecolley, A. Le Fèvre, R. Legrain, N. Le Neindre, O. Lopez, M. Louvel, A. M. Maskay, L. Nalpas, A. D. N’Guyen, M. Parlog, E. Plagnol, G. Politi, A. Rahmani, T. Reposeur, M. F. Rivet, E. Rosato, F. Saint-Laurent, S. Salou, J. C. Steckmeyer, M. Stern, G. Tabacaru, B. Tamain, L. Tassan-Got, O. Tirel, E. Vient, C. Volant, and J. P. Wieleczko, Physical Review C 65, 044604 (2002).
- Galichet et al. [2009] E. Galichet, M. F. Rivet, B. Borderie, M. Colonna, R. Bougault, A. Chbihi, R. Dayras, D. Durand, J. D. Frankland, D. C. R. Guinet, P. Lautesse, N. Le Neindre, O. Lopez, L. Manduci, M. Pârlog, E. Rosato, B. Tamain, E. Vient, C. Volant, and J. P. Wieleczko, Physical Review C 79, 064614+ (2009).
- Bellaize et al. [2002] N. Bellaize, O. Lopez, J. Wieleczko, D. Cussol, G. Auger, C. Bacri, F. Bocage, B. Borderie, R. Bougault, B. Bouriquet, R. Brou, P. Buchet, A. Buta, J. Charvet, A. Chbihi, J. Colin, R. Dayras, N. De Cesare, A. Demeyer, D. Doré, D. Durand, J. Frankland, E. Galichet, E. Genouin-Duhamel, E. Gerlic, B. Guiot, D. Guinet, S. Hudan, G. Lanzalone, P. Lautesse, F. Lavaud, J. Laville, J. Lecolley, R. Legrain, N. Le Neindre, L. Manduci, J. Marie, L. Nalpas, J. Normand, M. Pârlog, P. Pawłowski, E. Plagnol, M. Rivet, E. Rosato, R. Roy, F. Saint-Laurent, J. Steckmeyer, G. Tabacaru, B. Tamain, E. van Lauwe, L. Tassan-Got, E. Vient, M. Vigilante, and C. Volant, Nuclear Physics A 709, 367 (2002).
- Marie et al. [1997] N. Marie, R. Laforest, R. Bougault, J. Wieleczko, D. Durand, C. Bacri, J. Lecolley, F. Saint-Laurent, G. Auger, J. Benlliure, E. Bisquer, B. Borderie, R. Brou, J. Charvet, A. Chbihi, J. Colin, D. Cussol, R. Dayras, E. De Filippo, A. Demeyer, D. Doré, P. Ecomard, P. Eudes, D. Gourio, D. Guinet, P. Lautesse, J. Laville, A. Le Fèvre, T. Lefort, R. Legrain, O. Lopez, M. Louvel, V. Métivier, L. Nalpas, A. Ouatizerga, M. Parlog, J. Péter, E. Plagnol, A. Rahmani, T. Reposeur, M. Rivet, E. Rosato, S. Salou, M. Squalli, J. Steckmeyer, B. Tamain, L. Tassan-Got, E. Vient, and C. Volant, Physics Letters B 391, 15 (1997).
- Łukasik et al. [2005] J. Łukasik, G. Auger, M. Begemann-Blaich, N. Bellaize, R. Bittiger, F. Bocage, B. Borderie, R. Bougault, B. Bouriquet, J. Charvet, A. Chbihi, R. Dayras, D. Durand, J. Frankland, E. Galichet, D. Gourio, D. Guinet, S. Hudan, P. Lautesse, F. Lavaud, A. Le Fèvre, R. Legrain, O. Lopez, U. Lynen, W. Müller, L. Nalpas, H. Orth, E. Plagnol, E. Rosato, A. Saija, C. Schwarz, C. Sfienti, B. Tamain, W. Trautmann, A. Trzciński, K. Turzó, E. Vient, M. Vigilante, C. Volant, and B. Zwiegliński, Physics Letters B 608, 223 (2005).
- Pouthas et al. [1996] J. Pouthas, A. Bertaut, B. Borderie, P. Bourgault, B. Cahan, G. Carles, D. Charlet, D. Cussol, R. Dayras, M. Engrand, O. Jouniaux, P. Le Botlan, A. Leconte, P. Lelong, L. Martina, P. Mosrin, L. Olivier, J. Passerieux, B. Piquet, E. Plagnol, E. Plaige, B. Raine, A. Richard, F. Saint-Laurent, C. Spitaels, J. Tillier, M. Tripon, P. Vallerand, P. Volkov, and G. Wittwer, Nuclear Instruments and Methods in Physics Research Section A: Accelerators, Spectrometers, Detectors and Associated Equipment 369, 222 (1996).
- Brun and Rademakers [1997] R. Brun and F. Rademakers, Nuclear Instruments and Methods in Physics Research Section A: Accelerators, Spectrometers, Detectors and Associated Equipment 389, 81 (1997).