A SIR epidemic model for citation dynamics
Abstract
The study of citations in the scientific literature crosses the boundaries between the traditional branches of science and stands on its own as a most profitable research field dubbed the ‘science of science’. Although the understanding of the citation histories of individual papers involves many intangible factors, the basic assumption that citations beget citations can explain most features of the empirical citation patterns. Here we use the SIR epidemic model as a mechanistic model for the citation dynamics of well-cited papers published in selected journals of the American Physical Society. The estimated epidemiological parameters offer insight on unknown quantities as the size of the community that could cite a paper and its ultimate impact on that community. We find a good, though imperfect, agreement between the rank of the journals obtained using the epidemiological parameters and the impact factor rank.
I Introduction
Regardless of the controversial and widespread use of citation based measures as a quantitative proxy of a paper’s importance Merton_1973 ; Price_1975 ; Radicchi_2008 ; Radicchi_2009 ; Uzzi_2013 ; Ioannidis_2014 , the study of citations seems to have acquired a life of its own Mingers_2015 . In fact, citation networks, citation distributions and citation dynamics are topics that range over most of the issues addressed by the science of complexity. In addition, the large citation datasets, which unfortunately are rarely freely accessible, makes the subject very attractive since, contrary to most complex systems problems, the theories about citation patterns can readily be tested against empirical data Redner_1998 ; Redner_2005 ; Wallace_2009 .
A remarkable outcome of the quantitative study of the citation patterns is the realization that starkly different citation histories, such as the rare ‘sleeping beauties’ (i.e., papers that are not cited for a long while and then suddenly become popular van2004sleeping ; ke2015defining ) or the more common ‘shooting stars’ (i.e., papers that are highly cited initially but die quickly), can be explained by tunning a few parameters of mechanistic models of the citation dynamics Mingers_2008 ; Min_2018 ; Wang_2013 . A seemingly natural mechanistic model to describe the spread of ideas in the academia is the SIR epidemic model Bettencourt_2006 , which, however, has not yet been applied to the analysis of the citation histories of individual papers.
Accordingly, here we use the SIR epidemic model to fit the number of citations received over a period of 15 years by 300 hit papers published in 6 selected APS journals. We define hit papers as the 50 most cited papers published from 2000 to 2003 in each of those journals. The data used in our analysis is from the American Physical Society Data Sets for Research (available upon request at APS_Dataset ), which include only internal citations, i.e., citations to papers published in APS journals from papers published in APS journals as well. In Sec. II, we offer a brief overview of the APS Dataset.
The epidemiological parameters of the SIR epidemic model have a direct interpretation in terms of the citation dynamics, as we explain in great detail in Sec. III. Following the maxim ‘citations beget citations’ we assume that the citations of a given paper are promoted by a certain number of influential papers whose bibliographies include that paper and whose potential to influence yet-to-be-written papers to cite it is determined by the transmission parameter . Papers cease to be influential at a rate . The ratio is very close to 1 for most of the hit papers considered here, so that the ‘shooting stars’ and the ‘sleeping beauties’ citation patterns are obtained for large and small values of , respectively. An epidemiological parameter of particular interest is the potential maximum number of citations a hit paper can receive, which yields an estimate of the size of the community that could in principle cite that paper. The SIR model allows the ready estimate of the total number of citations a paper ever acquires , which can be seen as the ultimate impact of a paper Wang_2013 . The relative ultimate impact happens to depend on the basic reproductive number only.
The distributions of the epidemiological parameters for each selected journal enables the ranking of the journals using their medians, as we describe in Sec. IV. In particular, the ranks produced by the medians of the distributions of the parameters and interchanges the position of two journals only in comparison with the Impact Factor (IF) rank Garfield_2006 . In general, however, the higher the IF of a journal is, the less its relative ultimate impact.
II APS Dataset
The APS Dataset comprises citing article pairs and article metadata of about papers published in journals of the American Physical Society from to APS_Dataset . The first journal, Physical Review, ceased publication in , and the most recent journal in the dataset, Physical Review Materials, was launched in .
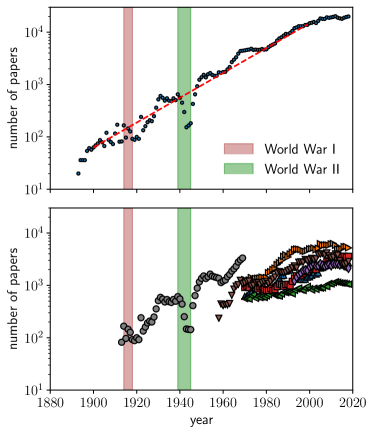
With more than one century of existence, the APS journals lived through the World War I and the World War II. The total number of papers published per year in the APS journals shown in the upper panel of Fig. 1 reveals the distinct impact these two major events had on the academic productivity of the physicists. Whereas WWI caused no discernible changes on the number of papers published in the Physical Review, most likely because this journal was not yet the main publication choice of the European physicists, WWII caused a sharp drop on the number of published papers, which reflects the worldwide disruption this event produced in all activities unrelated to warfare. More importantly, this panel shows that the number of published papers grows at an exponential rate Price_1975 , which probably prompted the splitting of the Physical Review Series II into Physical Review A, B, C, and D in 1970. Nevertheless, the exponential growth trend continued for the offspring journals, leading to the current difficulty of physicists to keep pace with the advances of their own research subfields Larsen_2010 ; Landhuis_2016 . The lower panel of Fig. 1 shows the number of papers published in the APS journals we will consider in this paper. In addition to the journals already mentioned, the panel includes the Physical Review Letters that was introduced in 1958 and the Physical Review E that was launched in 1993. For completeness, we also include in the panel the Physical Review, Series II which replaced the Physical Review, Series I and was active from to . Those are the APS journals with the largest number of papers published since .
| APS Journal | number of papers |
|---|---|
| Phys. Rev. A | 5826 |
| Phys. Rev. B | 18028 |
| Phys. Rev. C | 3131 |
| Phys. Rev. D | 7589 |
| Phys. Rev. E | 8137 |
| Phys. Rev. Lett. | 12163 |
Here we focus on the papers published in Phys. Rev. Lett., Phys. Rev. A, B, C, D, and E from to . Table 1 shows the number of papers published in each of these journals in that time window. For each journal we pick the papers published from to that received the highest number of citations up to years (180 months) after their publication dates. Those papers are named hit papers and next we will show how to model their citation patterns using an epidemiological model. We refer the reader to Ref. Redner_2005 for the analysis of the citation statistics of Physical Review from 1893 through 2003.
III Epidemiological model
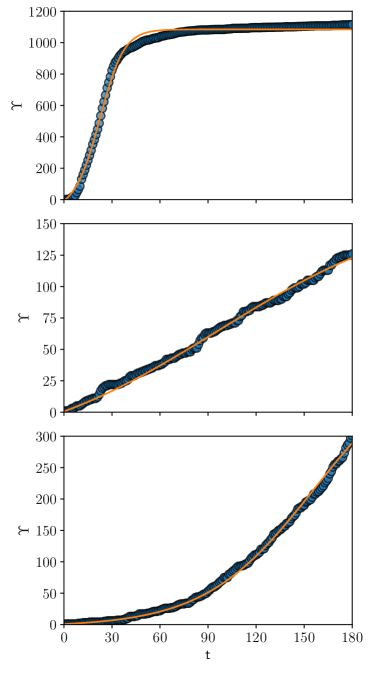
We characterize the citation histories of the hit papers by their cumulative number of citations received in the period of 180 months from their publication dates. Figure 2 illustrates this quantity for three representative citation histories in the time window considered. In particular, the number of citations of the paper shown in the upper panel PhysRevD.66.010001 exhibits a very rapid increase followed by stabilization within about 30 months after its publication. This is the editors’ dream paper for it has the perfect timing to boost the IF of a journal. The citation record of the paper shown in the middle panel PhysRevA.65.032323 exhibits a steady and consistent growth of little less than one citation per month. Perhaps the most interesting citation pattern is that of the paper exhibited in the lower panel PhysRevB.65.035109 , which displays a latent period followed by a steady speed up of the number of citations. This panel illustrates the ‘sleeping beauties’ citation pattern that makes the prediction of the impact of a research using short-time information (say, a 24 months window) a somewhat shortsighted enterprise van2004sleeping ; ke2015defining .
The main assumption behind our approach to model the citation histories illustrated in Fig. 2 is that citations beget more citations, so that the citation dynamics could be modeled as the spread of an infectious disease. This means that a particular hit paper comes to the knowledge of prospective citing authors through the reading of papers that cite the hit paper. Here we model the citation dynamics of a hit paper using the popular SIR model kermack1927contribution ; Murray1993 where the susceptible (S), infected (I) and removed (R) classes must be properly reinterpreted within the citation dynamics context.
In particular, once a hit paper is published we assume that there is a maximum number of citations it can receive, which we denote by . This is the number of papers in an abstract population of papers not yet written that are susceptible to cite the hit paper. This number can only decrease with time and we denote by the number of citations the hit paper can still receive after time from its publication date. Of course,
| (1) |
is the measurable total number of citations the hit paper received until time , which is shown in Fig. 2 for three selected hit papers. In principle, could be estimated if we knew the size of the community that works on the subject addressed by the hit paper, the mean number of papers published per month by researchers in that community and the average number of references those papers contain.
A simple way to model the decrease of the number of susceptible papers with time is through the contact process
| (2) |
where is the number of papers that have cited the hit paper before or at time and that can still influence susceptible papers to cite that paper. In other words, is the number of influential (or infective) papers. Although the hit paper does not cite itself, we will assume that it contributes to . We note that the hit paper may not contribute to , i.e., it may not be influential any more at time so that its new citations are prompted by third-party papers. (Just think of the many papers citing classic books whose authors never read those books.) The coefficient in Eq. (2) is a measure of the persuasion power of the influential papers, i.e., it is a measure of the likelihood an author will cite the hit paper because that author read a paper that cites the hit paper. Because is a per capita transmission rate we have introduced the constant factor in Eq. (2) to guarantee that its value is on the order of 1 regardless of the value of , and that this equation is dimensionally correct. (The unit of and is papers.)
The equation for the number of influential papers
| (3) |
makes plain the fair assumption that influential papers cease to be influential at a rate and move into the removed class. Papers in the removed class play no role in the citation dynamics and their number is given by
| (4) |
Since we have , because the removed class is empty at . Moreover, since the number of citations are reported on a monthly basis, we use the month as our time unit so that and have unit 1/month.
We note that our epidemiological approach builds on an assumption different from the vastly popular cumulative advantage or preferential attachment assumption, in which the probability that a publication is cited is an increasing function of its current total number of citations Redner_2005 ; Merton_1973 . In our case, this probability is a function of a (variable) fraction of the total number of citations, namely, it is a function of the number of influential papers.
Perhaps the most interesting quantity in the citation dynamics context is , which gives the total number of citations a hit paper acquires during its lifetime, i.e., its ultimate impact. Of course, cannot be measured but can be easily inferred using our epidemiological approach. In fact, it is given by the positive root of the transcendental equation Murray1993
| (5) |
where . Hence only in the limit . For finite , a hit paper will receive only the fraction of the potential citations it could receive. For instance, for the papers analyzed in Fig. 2, the estimated total number of citations they will receive is (upper panel), (middle panel) and (lower panel).
Assuming that we rewrite Eq. (5) as
| (6) |
which has a nonzero solution provided that . Here is the basic reproductive number that ultimately determines the overall impact of a hit paper on the abstract population of susceptible papers. Since our focus are on hit papers only, we have necessarily. In fact, with very few exceptions, the values of of the hit papers were all very close to 1.
The SIR model has only three adjustable parameters, namely, , and and our goal is to estimate these parameters by fitting Eq. (1) to the cumulative number of citations extracted from the APS dataset. The quality of the fitting can be appreciated in Fig. 2. Incidentally, the paper considered in the upper panel of this figure has the largest value of among the 300 hit papers considered in our study.
IV Epidemiological journal ranking
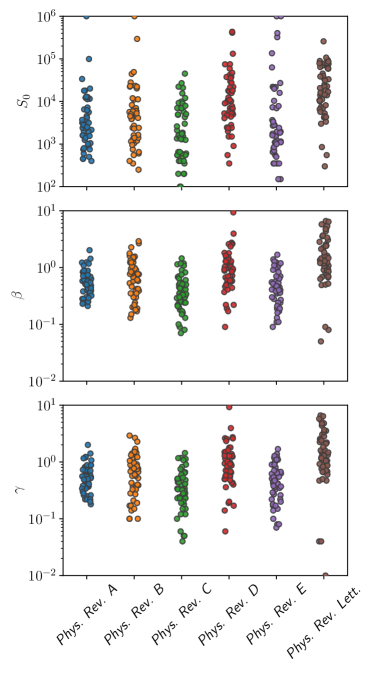
The results of our fitting procedure are summarized in Fig. 3, which shows the epidemiological parameters , and that best fit the theoretical estimate of to the empirical cumulative number of citations. Each symbol in a panel corresponds to the estimated epidemiological parameter of a particular hit paper. Because of the considerable spread of the values of the estimates, which is particularly pronounced for , it is convenient to summarize the parameter distributions by their medians, , and , which are shown in Table 2 together with the medians of the basic reproductive number and of the ultimate fraction of the potential citations received . The order of the journals listed in this table is determined by the value of .
| APS Journal | |||||
|---|---|---|---|---|---|
| Phys. Rev. Lett. | 19350 | 1.400 | 1.385 | 1.008 | 0.021 |
| Phys. Rev. D | 9325 | 0.915 | 0.910 | 1.012 | 0.031 |
| Phys. Rev. B | 4750 | 0.730 | 0.715 | 1.026 | 0.059 |
| Phys. Rev. A | 2900 | 0.570 | 0.550 | 1.031 | 0.072 |
| Phys. Rev. E | 1900 | 0.455 | 0.445 | 1.028 | 0.070 |
| Phys. Rev. C | 1600 | 0.355 | 0.340 | 1.037 | 0.084 |
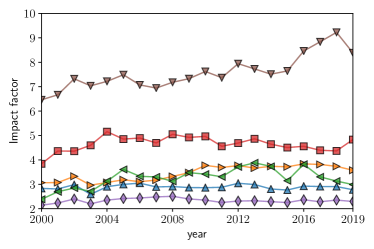
Remarkably, Table 2 shows that , and are good predictors of the rank of the selected APS journals according to the IF metric Garfield_2006 . In fact, if we consider that the hit papers were published between 2000 and 2003, the epidemiological rank offered in this table interchanges the positions of Phys. Rev. C and Phys. Rev. E only as compared with the IF rank (see Fig. 4). The good agreement between these ranks is not very surprising in the sense that it is well known that the size of the community, which in our approach is measured by , correlates well with the IF Althouse_09 . It is important to note, however, that does not correlate well with the number of papers published in a journal during the period of analysis shown in Table 1. In addition and perhaps more importantly, because the IF is measured in a 24 months window, it correlates well with the transmission rate , since large values of this parameter result in many citations in a short time provided there are plenty of susceptible papers (see upper panel of Fig. 2). These findings validate our theoretical approach to model the citation dynamics as well as the procedure we used to estimate the epidemiological parameters.
The positive correlation between the IF metric and is more intriguing and, perhaps, illuminating. We recall that a high value of implies a quick obsolescence of the influential papers, i.e., those papers are influential for a short period of time only. This means that the epidemiological approach predicts that papers that cite hit papers published in high impact factor journals are not likely to be very impactful themselves. This scenario is evocative of the many application papers that use a novel analysis method presented in a hit paper.
The surprising finding revealed in Table 2 is the negative correlation between (and hence the IF metric) and or . We recall that and are related through Eq. (6). Actually the true relevance of can be appreciated only through its link to , which reveals that does not imply that an infective agent (a hit paper in our case) will take over the entire susceptible population. Interestingly, our epidemiological analysis indicates that, when the size of the susceptible community is taken into account, hit papers published in high impact journals actually have a smaller (relative) number of citations than hit papers published in low impact journals. We note that and are not related by Eq. (6): these quantities are estimated from the distributions of and of the hit papers for each journal.
V Conclusion
The literature already offers several mechanistic models for the citation dynamics of individual papers. Some of them build on the similarity between the S-shaped curves of the cumulative number of citations and the curves that describe the diffusion of innovations to argue that the same mechanisms that drive the adoption of a new product, viz., innovation and imitation Rogers_2010 ; Bass_1969 , may explain the citation process as well Mingers_2008 ; Min_2018 . However, the likely most successful mechanistic model of citation dynamics builds on assumptions proper to this dynamics, viz., preferential attachment, fitness and aging Wang_2013 . As already pointed out, preferential attachment or cumulative advantage means that the probability that a publication is cited is an increasing function of its current number of citations Price_1975 ; Merton_1973 ; Redner_2005 . Fitness expresses the notion that papers differ with respect to the perceived novelty and importance of their contents Foster_2015 ; Li_2019 and aging captures the fact that the perceived novelty and importance of a paper eventually fade out Eom_2011 . There are, of course, many intangible factors behind an author’s decision to cite a paper, such as the reputation of its authors and the journal where it was published, that can be identified in a citation network analysis but cannot be implemented in a mechanistic model Dong_2016 .
Here we take a different approach that is inspired by the attempt to describe the spread of Feynman diagrams through the theoretical physics communities of different countries using models of epidemics Bettencourt_2006 . In particular, we fit the citation history of 300 hit papers from 6 selected APS journals using a SIR epidemic model. The advantage of this approach is that the epidemiological parameters have a direct interpretation in terms of the citation dynamics. For instance, a paper’s relative long term impact (i.e., the total number of citations a paper will ever acquire) is easily derived within the epidemiological framework (see Eq. (6)) and it is a function of the basic reproductive number only. This result is similar to the ultimate impact of a paper derived in Ref. Wang_2013 , which happens to depend only on the relative fitness of the paper. In fact, recalling that in the infectious disease context is the average number of people infected from one person and that in the evolutionary context the fitness of an organism is measured by the number of offspring per generation it produces, it is fair to think of as the fitness of the paper, so the two distinct approaches reach similar conclusions. However, the epidemiological approach does not make the preferential attachment assumption, since it assumes that the probability that a publication is cited at a certain time is a function of the number of influential papers at that time, which is a time-dependent fraction of the current number of citations.
The distributions of the values of the epidemiological parameters that describe the citation histories of the 50 hit papers for each one of the 6 APS journals considered allow us to characterize those journals and define an epidemiological rank. It turns out that there is a good, though not perfect, correlation between the rank obtained using the transmission rate or the potential maximum number of citations a paper acquires and the IF rank. Surprisingly, this rank correlates negatively with the rank obtained using the basic reproductive number , which implies that hit papers published in high impact factor journals have less relative long-term impact () than hit papers published in low impact factor journals, although their absolute long-term impact () is much greater. The fact that the IF rank is obtained using citations from papers published in all journals indexed at the Web of Science may explain the discrepancies with the epidemiological ranks that use data of APS journals only, particularly in research areas such as Nuclear Physics where there are many traditional journals owned by other publishers.
In summary, the SIR epidemic model proved very valuable to fit the citation histories of hit papers and, in addition, offered unexpected insights on the citation dynamics. The good correlation between the IF rank and the epidemiological ranks suggests that this simple epidemic model succeeded in picking out the essential elements behind the citation dynamics.
Acknowledgments
We thank the American Physical Society for letting us use their citation database. The research of JFF was supported in part by Grant No. 2020/03041-3, Fundação de Amparo à Pesquisa do Estado de São Paulo (FAPESP) and by Grant No. 305058/2017-7, Conselho Nacional de Desenvolvimento Científico e Tecnológico (CNPq). SMR was supported by the Coordenação de Aperfeiçoamento de Pessoal de Nível Superior - Brasil (CAPES) - Finance Code 001.
References
- (1) D. J. S. Price, Science since Babylon (Yale University Press, New Haven, 1975) .
- (2) R. Merton, The Sociology of Science (University of Chicago Press, Chicago, 1973).
- (3) F. Radicchi, S. Fortunato and C. Castellano, Proc. Natl. Acad. Sci. USA 105, 17268 (2008).
- (4) F. Radicchi, S. Fortunato, B. Markines, and A. Vespignani, Phys. Rev. E 80, 056103 (2009).
- (5) B. Uzzi, S. Mukherjee, M. Stringer and B. Jones, Science 342, 468 (2013).
- (6) J. Ioannidis, K. W. Boyack, H. Small, A. A. Sorensen, and R. Klavans, Nature 514, 561 (2014).
- (7) J. Mingers and L. Leydesdorff, Eur. J. Oper. Res. 246, 1 (2015).
- (8) S. Redner, Eur. Phys. J. B 4, 131 (1988).
- (9) S. Redner, Phys. Today 58, 49 (2005).
- (10) M. L. Wallace, V. Larivière and Y. Gingras, J. Informetr. 3, 296 (2009).
- (11) A. F. J. van Raan, Scientometrics 59, 467 (2004).
- (12) Q. Ke, E. Ferrara, F. Radicchi and A. Flammini, Proc. Natl. Acad. Sci. USA 112, 7426 (2015).
- (13) J. Mingers, J. Oper. Res. Soc. 59, 1013 (2008).
- (14) C. Min, Y. Ding, J. Li, Y. Bu, L. Pei, and J. Sun, J. Assoc. Inf. Sci. Technol. 69, 1271 (2018).
- (15) D. Wang, C. Song, A.-L. Barabási, Science 342, 127 (2013).
- (16) L. M. Bettencourt, A. Cintrón-Arias, D. I. Kaiser and C. Castillo-Chávez, Physica A 364, 513 (2006).
- (17) https://journals.aps.org/datasets.
- (18) E. Garfield, JAMA 295, 90 (2006).
- (19) P. Larsen and M. Von Ins, Scientometrics 84, 575 (2010).
- (20) E. Landhuis, Nature 535, 457 (2016).
- (21) K. Hagiwara et al., Phys. Rev. D 66, 010001 (2002).
- (22) M. S. Kim, W. Son, V. Bužek and P. L. Knight, Phys. Rev. A 65, 032323 (2002).
- (23) I. Souza, N. Marzari and D. Vanderbilt, Phys. Rev. B 65, 035109 (2001).
- (24) W. O. Kermack and A. G. McKendrick, Proc. R. Soc. A 115, 700 (1927).
- (25) J. D. Murray, Mathematical Biology I: An Introduction (Springer, New York, 1993).
- (26) B. M. Althouse, J. D. West, C. T. Bergstrom and T. Bergstrom, J. Assoc. Inf. Sci. Technol. 60, 27 (2009).
- (27) E. M. Rogers, Diffusion of Innovations (Simon and Schuster, New York, 2010).
- (28) F. M. Bass, Manag. Sci. 15, 215 (1969).
- (29) J. G. Foster, A. Rzhetsky, and J. A. Evans, Am. Sociol. Rev. 80, 875 (2015).
- (30) J. Li, Y. Yin, S. Fortunato and D. Wang, Nat. Rev. Phys. 1, 301 (2019).
- (31) Y.-H. Eom and S. Fortunato, PLoS ONE 6, e24926 (2011).
- (32) Y. Dong, R. A. Johnson, and N. V. Chawla, IEEE Trans. Big Data 2, 18 (2016).