Enhanced adsorption of Xe and Kr on boron doped graphene sheet decorated with transition metals (Fe, Ni, Cu and Zn)
Abstract
Efficient adsorption and segregation of Xe & Kr gases is of high importance in commercial as well as nuclear industries. Systematic ab initio calculations reveal that transition-metal (TM) decorated boron-doped graphene (BDG-TM) sheet can act as an efficient substrate for adsorptive capture of Xe & Kr (adatoms). Substantial enhancement in the adsorption energy is obtained on BDG-TM substrates and it varies as BDG-Cu > BDG-Ni > BDG-Fe > BDG-Zn. The improvement is approximately four times that of the pristine BDG and twice that of the conventional metallic substrates. Bader charge analysis and charge density difference maps envisage that, the TM-decoration alters the charge distribution at substrate-adatom interface, which in-turn brings a considerable change in the polarization of adatom, leading to significant improvement in the . The change in polarization of adatoms is interlinked with charge transfer process and it has been gauged by computing their effective charges, which follows the same sequence of and hence corroborated each other. Later, the partial density of states analysis shows a splitting and significant interaction of Xe-p with TM-d orbitals near the Fermi level of Fe, Ni and Cu decorated systems, unveiling a strong adsorption. Further, the effect of clustering and dispersion of Cu atoms on are analyzed using a first principle based genetic algorithm, which reveals that clustering of Cu atoms deteriorate the of Xe & Kr. Thus for experimental realization, BDG sheet with uniformly dispersed fine Cu particles is proposed as a substrate.
I Introduction
Xenon (Xe) and Krypton (Kr) are the primary components of gaseous fission products, known as fission gases (FGs). Radioactive FGs infiltrate to atmosphere, during the reprocessing of spent nuclear fuels, clad rupturing under operating conditions, nuclear detonations and the production of medical isotopes (Soelberg et al., 2013; Rest et al., 2019; Hoffman and Berg, 2018). Proper monitoring, segregation and disposal of such radioactive gases are essential to prevent the atmospheric contamination. On the other hand, Xe has several industrial applications as well; it’s being widely used in light sources, in the field of medical anesthesia, protein crystallography and satellite propulsion system etc (Dmochowski, 2009). Hence an efficient capture and segregation of Xe is a mandate of both nuclear and commercial industries.
Traditionally, adsorptive methods have been widely used for capture and segregation of rare gases. Adsorption of rare gases on surfaces are classical problems in surface science (Bruch et al., 1997). Metal surfaces are the conventional substrates for physical adsorption of Xe & Kr (Wandelt and Hulse, 1984; Vidali et al., 1991; Silva et al., 2003; Zhu et al., 2003; Da Silva and Stampfl, 2008; Chen et al., 2012; Silvestrelli and Ambrosetti, 2015). On metallic substrates, the adsorption energies () of rare gases ranges from -10 to - 400 meV (Da Silva and Stampfl, 2008); for example, the of He/Pd(110), Kr/Pd(100), Xe/Pd(111) and Xe/Ni(111) systems are -10, -200, -320 to -360 and -401 meV, respectively (Wandelt and Hulse, 1984; Vidali et al., 1991; Silva et al., 2003; Zhu et al., 2003; Da Silva and Stampfl, 2008; Silvestrelli and Ambrosetti, 2015). Zeolites and activated carbons were also used as substrates for adsorption and segregation of Xe & Kr (Bazan et al., 2011; Thallapally et al., 2012). Later, metal organic frame works (MOFs) (Banerjee et al., 2018; Xiong et al., 2018; Gong et al., 2018; Wang et al., 2014; Banerjee et al., 2015; Perry et al., 2014), organic porous cage molecules (Chen et al., 2014) and carbon nano cages (Rahimi et al., 2018) were adopted for Xe & Kr adsorption. Banerjee et al (Banerjee et al., 2016) reported a calcium-based nanoporous MOF (SBMOF-1) with the highest Xe adsorption energy of -42 kJ/mol (-435 meV).
In recent years, search for effective alternative substrates are in top gear. Properties such as, large surface area, functionality, light weight and stability of graphene based materials enables it a promising candidate for gas adsorption and storage applications (Gadipelli and Guo, 2015). Graphite surfaces were used as substrates to adsorb the Xe atoms (Chen et al., 2003; Pussi et al., 2004; Da Silva and Stampfl, 2007). Ab initio studies revealed the of Xe on hollow sites of graphite are -204 (Chen et al., 2003) and -168 (Da Silva and Stampfl, 2007) meV. Sheng et al (Sheng et al., 2010) computed the adsorption energies of Xe on graphene using ab initio MP2 calculation. In this study, they modeled graphene as polycyclic aromatic hydrocarbons (coronene). The Xe atom prefers to bind at the hollow site of coronene with of -142.9 meV. Later, Ambrosetti et al (Ambrosetti and Silvestrelli, 2011) made a comprehensive analysis of adsorption of rare gases on graphene and graphite using van der Waals (vdW) corrected DFT calculations and predicted the of Xe on graphene as -171.2 meV. Subsequently, hetero-atom doping in graphene sheet has been tried to enhance interaction between the rare gases and sheet substrate (Vazhappilly et al., 2017). In this attempt, authors employed both n & p type dopants to refine the adsorption parameters of Xe & Kr. Among the different dopants, Be-doped graphene sheet yield marginal enhancement in of Xe (-196.70 meV) and Kr (-140.63 meV) (Vazhappilly et al., 2017). The hetero-atom doping brings about 11.41 % enhancement in adsorption energy of Xe with respect to pristine graphene. Later, the authors extended their studies to graphyne and graphdiyne systems with various chemical dopants (Vazhappilly and Ghanty, 2020). Aluminum (Al) doped graphyne and graphdiyne shows an improvement in the of Xe & Kr with respect to pristine. The highest obtained is -348.5 meV for Xe adsorbed on top site of Al-graphdiyne. Very recently, pristine and doped phosphorene sheets have been employed to adsorb the rare gas atoms (Hu et al., 2020). The on pristine phosphorene sheets are comparable to that of graphene, while the Li doped phosphorene sheet shows an enhancement in the Xe (-294.7 meV) and Kr (-237.4 meV) interaction with substrate.
From the aforementioned discussions, it can be seen that the upper bound of of Xe is in the range of -400 to -450 meV. The magnitude of indicates a weak adsorption, and hence further enhancement in adsorption energy is essential for efficient adsorptive capture and segregation of Xe & Kr. This motivated us to look for alternate substrates, which can emanate a substantial enhancement in the adsorption energy. Transition metals (TMs) decoration on carbon nano structures has resulted in considerable improvement in the adsorption properties of gases and molecules (Nachimuthu et al., 2014; Jungsuttiwong et al., 2016; Cortés-Arriagada et al., 2018). Motivated from this fact, a new strategy is adopted; where TMs (Fe, Ni, Cu and Zn) decorated boron-doped graphene (BDG) sheets are employed as substrates for efficient adsorption and separation of Xe & Kr. The aforementioned TMs are relatively cheap and earth abundant in comparison to noble metals. Here, instead of pristine graphene, BDG sheets are used for TM-decoration due to the following reasons. Earlier studies reported that boron-doped graphene sheets can adsorb hydrogen more strongly than pristine graphene due to strong boron binding sites (Sankaran et al., 2008; Wu et al., 2011). Also, boron doping forbids the clustering and agglomeration of metal atoms (Beheshti et al., 2011), which can affect the adsorption properties. More importantly, boron-doped graphene sheets have been successfully synthesized experimentally (Shirasaki et al., 2000). Henceforth, in this work, systematic ab initio density functional theory (DFT) calculations have been performed to analyze the adsorption parameters and mechanism of Xe & Kr on these newly proposed substrates. A substantial improvement in the is obtained, and its underlying mechanism is unveiled from the detailed Bader charge, induced dipole moment, charge density difference maps and partial density of states analysis of each BDG-TM-adatom systems. Further, the effects of nano-clustering and dispersion of TMs on adsorption parameters are analyzed. At end, an ATLAS of of Xe is made and compared with prior studies to highlight the outcome of the present study.
II Computational methods
Spin polarized ab initio DFT calculations are done using Vienna ab initio simulation package (VASP) (Kresse and Furthmüller, 1996). To ensure the accuracy and efficiency of calculations, projector augmented wave (PAW) pseudo potential is adapted. Generalized gradient approximation (GGA) of Perdew–Burke–Ernzerhof (PBE) is used to compute the exchange correlation functional (Perdew et al., 1996). The size of the plane wave basis set is truncated using a kinetic energy cut-off of 500 eV. A Monkhorst (Monkhorst and Pack, 1976) Pack grid of size 5×5×1 is used to sample over the Brillouin zone. All the geometries were optimized with a force convergence of the order of 10-2 eV/Å. In geometry optimization, the Xe/Kr were placed on a pre-converged BDG-TM sheets and their coordinates and cell shapes were relaxed by keeping the coordinates of the substrate atoms fixed. This particular choice of geometry optimization scheme is motivated by references (Ambrosetti and Silvestrelli, 2011; Da Silva and Stampfl, 2007; Vazhappilly et al., 2016, 2017). To compute the PDOS and charge density, a dense k-point grid of size 15x15x3 is used. Graphene sheet of supercell size 6x6x1 (72 atoms) has been selected for boron doping and then metal-decoration. A vacuum separation of 15 Å is provided along c-axis to avoid the un-physical interactions between periodic images. The substrate-adatom van der Waals (vdW) interaction is incorporated using the scheme of Tkatchenko et al. (TS-SCS) (Tkatchenko et al., 2012), which has been successfully used to model the binding of transition metals and their clusters on graphene (Rêgo et al., 2017), noble gas solids & layered materials (Al-Saidi et al., 2012), water & ethanol adsorption on different TM surfaces (Freire et al., 2018) etc. In TS-SCS method, the electrostatic screening effect is computed in a self-consistent manner. Also, it incorporates the global interactions of fluctuating dipoles, that enables us to treat system as a whole, thus going beyond the conventional pair wise methods.
III Results and Discussions
III.1 Transition-metal (TM)-decoration on Boron-doped graphene (BDG)
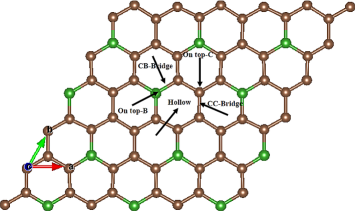
In-order to construct the boron-doped graphene (BDG), firstly, a 6x6x1 supercell of graphene sheet is made. Earlier experimental (Naeini et al., 1996) and theoretical (Nachimuthu et al., 2014; Jungsuttiwong et al., 2016) studies show that an ordered C5B layer is the energetically favourable configuration for BDG sheet. Hence, B atoms are substitutionally doped at each hexagonal ring of the pre-optimized graphene sheet, which generates an ordered layer structure with stoichiometry C60B12, which leads to 16 % doping. Such heavily doped BDG sheets were previously employed as an efficient substrate for electro-catalytic and hydrogen storage applications (Agnoli and Favaro, 2016; Nachimuthu et al., 2014). Figure 1 shows the optimized structure of BDG sheet, which retains the planar geometry of pristine graphene. The energetics of B doping is analyzed from the cohesive energy , calculated as
| (1) |
Where the , , and are the total energy of BDG sheet, number of dopant (B) atoms, energy per atom of dopant and total number of atoms in supercell, respectively. The -7.493 eV/atom; the negative cohesive energy indicates the energetic stability of BDG system. Further, the formation energy of BDG have been computed as follows,
| (2) |
Where, , , , and are the total energy of BDG, total energy of pristine graphene, number of dopant (B) atoms, chemical potentials of boron and carbon atoms, respectively. The and are taken as the binding energy per atom of alpha-boron and graphene sheet, respectively. The computed formation energy per B atom is 1.448 eV/B-atom, which is matching with previous prediction (M. Dieb et al., 2018).
In BDG, the possible binding sites for TM atoms are labeled as shown in figure 1. Optimized geometries of BDG-TMs shows that Fe, Ni and Cu atoms prefers to occupy the hollow position, while Zn atom sits on top of B atom (Figure S1 - SI), it’s in agreement with earlier reports (Nachimuthu et al., 2014; Jungsuttiwong et al., 2016). The binding energy () of TM atoms (TMs) on BDG sheet is computed as,
| (3) |
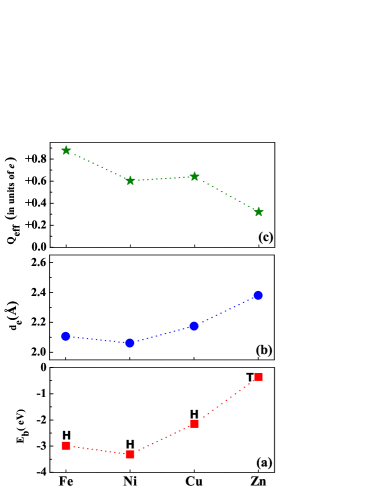
Where, , and are the total energy of BDG sheet with TM atom, BDG sheet, and TM atoms in gas phase, respectively. Figure 2a shows the binding parameters of TMs on BDG sheet. The calculated binding energy ( of Fe, Ni, Cu and Zn are -2.988, -3.312, -2.150 and -0.363 eV, respectively. The of TMs on BDG is higher than that of pristine graphene (Nakada and Ishii, 2011), signifying that boron doping in graphene enhances the binding of TM atoms. For example, the of Ni on graphene is -1.470 eV (Rêgo et al., 2017) the same on BDG is -3.312 eV. This increase in helps to trap the TMs at binding sites and hence prevents the clustering of TMs on BDG (Beheshti et al., 2011; Nachimuthu et al., 2014). Boron is a p-type dopant which makes sheet more electron deficient in comparison to pristine sheet. Hence the electron rich TM atom interact strongly with electron deficient BDG sheet. The binding energy of TM atom is expected to decrease as 3d orbital populates (Santos et al., 2010). However, in the present study, the obtained for Ni is higher than that of Fe, this is in line with the observation of Johll et al (Johll et al., 2009). This non-monotonic behaviour attributes to the lower inter-configurational energy of Ni with respect to Fe. That means the energy required to transfer unit charge from s orbital to d (i.e. is lower for Ni in comparison with Fe, which results in strong binding of Ni with sheet (Yanagisawa et al., 2000; Johll et al., 2009). In the case of Zn, the filled s and d orbitals leads to a smaller binding energy. The equilibrium distance () between the TM atom and the BDG sheet is shown in figure 2b. The value of Fe and Ni are very close to each other. For Cu and Zn the increases, attributing to their filled 3d orbitals and large size of 4s orbitals (Santos et al., 2010). The higher value of Zn atom is corroborated with its low binding energy.
In-order to understand the nature of charge transfer upon TM binding, the effective charges () on TMs are computed using Bader charge analysis (Tang et al., 2009). In Bader method, the total electronic charge density on an atom is approximated to charge density encompassed in a certain volume, known as Bader volume. The Bader charge () on each atom is computed using the Henkelman’s method (Tang et al., 2009). Thereafter, the is obtained as,
| (4) |
Where, is the valency of atom. Figure 2c shows the on TMs in electronic (e) unit. The of all TM atoms are positive (Figure 2c), indicating that the charge transfer is from TM atom to BDG sheet. Since the single TM atom binds to the sheet, the charge transfer can be explained based on their electronegativity values, which are 1.83, 1.91, 1.90 and 1.65, for Fe, Ni, Cu and Zn, respectively. The observed values are in accordance with electronegativity data, except for Zn. The charge transfer is highest for Fe, among the Cu and Ni, the charge transfer is marginally higher for Cu, and it owes to its slightly lower electronegativity with respect to Ni. For Zn, the completely filled 3d and 4s orbital reduces the charge transfer to BDG sheet.
III.2 Adsorption of Xe & Kr on TM-decorated BDG sheet
In this section, the adsorption parameters of Xe & Kr (adatoms) on pristine graphene, BDG and TM decorated BDG (BDG-TM) substrates are analyzed and compared. In pristine graphene, adatoms occupies the H site (Figure S2-SI). The adsorption energy () on different substrate is computed as,
| (5) |
Where, , and are the total energy of substrate-adatom, substrate and adatoms in gas phase, respectively. In proceeding section, is expressed in meV to have a consistent comparison with literature. Simple GGA (PBE) functional predicts a negligibly small (-9.0 meV) and a large adatom-sheet equilibrium distance - (4.517 Å). This poor binding in simple GGA calculation envisages its inadequacy to explain the adsorption processes of Xe & Kr and it attributes to the non-accountability of vdW interaction in these calculations(Ambrosetti and Silvestrelli, 2011). The adatom and substrate interaction are non-covalent in nature and primarily arising from the vdW interactions of separated fragments of the system. Therefore the adsorption parameters of Xe & Kr are computed using vdW corrected GGA (PBE+vdW) calculations.
Table 1 shows the adsorption parameters of Xe & Kr on graphene and BDG sheets. The of Xe & Kr on graphene are -175 & -133 meV, which shows an excellent agreement with previous calculations (Table 1). However, the PBE+vdW - values are over estimated with respect to the earlier reports (Ambrosetti and Silvestrelli, 2011; Vazhappilly et al., 2017; Thonhauser et al., 2007). There is a marginal spread in the values among different calculations. This discrepancy is due to the different choice of vdW schemes in those studies, which has already been reported in references (Thonhauser et al., 2007; Ambrosetti and Silvestrelli, 2011; Shepard et al., 2019). Despite the differences in , the adsorption energetics and sites are predicted consistently among different vdW correction schemes, guaranteeing an accurate prediction of the adsorption energy. The of Xe & Kr on BDG are -178 & -137 meV, which is slightly higher111In this manuscript, usage of higher/increase/enhancement in adsorption energy () means, the becomes more negativethan that of the previous report (Vazhappilly et al., 2017). This small disparity ascribes to the different choice of adsorption sites; in their studies, is computed on top site of dopant atom. Whereas, in the present study, after geometry optimization, the adatoms move from the initial H site into B site of BDG (Figure S2 - SI). Also, the authors used a single-atom doped graphene sheet (C71B1) as substrate, which is very dilute doping (1 %) with respect to the BDG sheet (C60B12) employed in the present study (16 %). This shows that the adsorption capacity of sheet improves with the boron doping concentration. The of Xe is higher than that of Kr on graphene and BDG. This difference in is correlated to the difference in atomic polarizability of Xe (3.99 x 10⁻²⁴ cm3) and Kr (2.46 x 10⁻²⁴ cm3) (Kittel, 2004; Da Silva and Stampfl, 2008). The higher polarizability of Xe makes the dispersion interaction more stronger, which leads to a strong binding with substrates; this inferences are inline with the previous observation, where increases in the increasing sequences of atomic polarizability of rare gas atoms (Ambrosetti and Silvestrelli, 2011)
| System | ads.site | (meV) | (Å) |
|---|---|---|---|
| Gr -Xe | H | -175 {-171a -176b} | 3.993 {3.840a, 3.548b} |
| Gr - Kr | H | -133 { -135b} | 3.855 { 3.490b} |
| BDG - Xe | B | -178 { -169b} | 3.880 { 3.580b} |
| BDG - Kr | B | -137 { -123b} | 3.824 { 3.500b} |
From table 1, it is clear that the boron doping brings only an infinitesimal improvement in the of Xe & Kr with respect to pristine graphene. The adsorption strength is related to the polarizability of Xe & Kr, which in-turn is associated with the charge transfer process. Hence, one can employ an effective substrate capable of making a significant change in charge transfer process and then the polarization of adatom, which can bring a considerable improvement in adsorption parameters. This is the main motive of the present study, and BDG-TM sheets are employed as substrates to accomplish this task. Table 2 shows the adsorption properties of Xe & Kr on different BDG-TM substrates. The increases significantly on BDG-TMs than on the pristine BDG sheet. This clearly shows that, TM-decoration on BDG brings a substantial enhancement in the Xe & Kr adsorption. Among the different BDG-TM substrates, the BDG-Cu shows the highest = -724 & -521 meV for Xe & Kr, and the enhancement is 307 & 280 % in comparison to BDG sheet. (The efficacy of different computational schemes, such as Hubbard correction for treating the 3d states of TM atoms, local density approximation and many body dispersion energy method (MBD@rsSCS) (Ambrosetti et al., 2014) on adsorption parameters has been tested and discussed in section-A SI, Table S1 - SI. The substantial enhancement in is conspicuous in all the above schemes). It’s noteworthy that, the difference in of Xe & Kr on BDG is -41 meV. While this difference becomes -203 and -193 meV on BDG-Cu and BDG-Ni substrates, respectively. This substantial difference in guarantees that BDG-TM substrate can distinguish between Xe and Kr, a crucial requirement in the nuclear industry. The ratio of Xe & Kr adsorption energies on BDG is 1.3. It increases to 1.4 on BDG-Cu substrate and it is in same order of previously reported values for MOFs (Kancharlapalli et al., 2019).
Xe & Kr are physisorbed on the BDG-TM substrates. The physisorption mechanism can be explained using charge transfer induced polarization effects (Kronik and Morikawa, 2013). Both Xe & Kr are closed shell rare gases, and hence they don’t have permanent dipole moment in gas phase. When these rare gases approach the substrates, a measurable dipole moment is generated at substrate-adatom interfaces due to the charge transfer process. This phenomena is explained using two mechanism - image force effect (Lang, 1981) and Pauli’s repulsion (Bagus et al., 2002). In either case, the rare gases become positively charged and substrate becomes negatively charged (Kronik and Morikawa, 2013). The positive values on Xe & Kr atoms confirms the charge transfer from the adatom to substrate. The relatively small of Xe & Kr (+0.005 & +0.003) on BDG substrate signifies that, the charge transfer is infinitesimal; hence the polarization of adatoms are small, which does not bring any discernible improvement in the adsorption energy with respect to pristine graphene. Meanwhile, the values of Xe & Kr are considerably larger on BDG-TM substrates (Table 2). This comparatively large charge transfer would bring a considerable change in polarization of adatoms, which results in an enhanced adsorption on BDG-TMs substrates. In all the cases, the of Xe is higher than that of Kr, which is corroborated to their low values in comparison with Xe. In conclusion, the TM-decoration alters the charge distribution at substrate-adatom interface, which in-turn brings a considerable change in the polarization and of adatom, leading to a substantial improvement in the adsorption energies of Xe & Kr. On different substrates, the of Xe & Kr increases in the following sequence, BDG - Cu > BDG - Ni > BDG - Fe > BDG - Zn. The magnitude of of Xe & Kr follow the same sequence of , and hence corroborated each other. In-short, the adatoms having large is highly polarized, and thus have high ; vice versa.
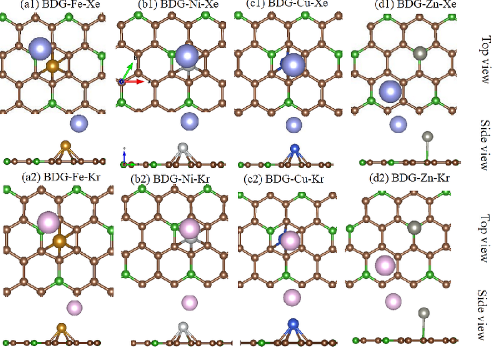
Figure 3 shows the optimized geometries of BDG-TM-adatom systems. The Xe & Kr prefer to reside on-top of TMs on BDG-Ni and BDG-Cu substrates, which are slightly off-centered H site. On BDG-Fe substrate, the adatoms shift to B site, and on BDG-Zn substrates, the adatoms drifts to a far away H site, which is due to the strong Pauli’s repulsion between the completely filled shells of Zn and adatoms. The equilibrium distance between the adatoms and the TMs () corroborates with . The decreases as increases and it’s true for both Xe & Kr on all the BDG-TM substrates considered here. The effect of different geometry optimization schemes on adsorption paramters has been tested (section-B, SI) and found to be insignificant. Later, the thermal stability of the substrate-adatom system have been confirmed by performing ab initio molecular dynamics simulations for BDG-Cu-Xe. The system is equilibrated at 300 K using velocity re-scaling method. An integration time step of 1 fs is adopted and the whole simulations were done for 4000 steps. The total energy profile remains stable during the course of simulations (Figure S3 - SI), indicating the finite temperature structural stability of the system. The computed is -710 meV, it is in the same range of DFT predicted values (Table 2). This thermal stability analysis contemplates the application of these novel substrates at finite temperatures.
| System | ads. site | (meV) | (Å) | (TM) | (Xe & Kr) |
|---|---|---|---|---|---|
| BDG-Fe-Xe | B | -618 | 2.701 | +0.730 | +0.101 |
| BDG-Ni-Xe | H | -692 | 2.575 | +0.536 | +0.116 |
| BDG-Cu-Xe | H | -724 | 2.558 | +0.577 | +0.144 |
| BDG-Zn-Xe | H | -212 | 3.843 | +0.341 | +0.007 |
| BDG-Fe-Kr | B | -445 | 2.586 | +0.748 | +0.061 |
| BDG-Ni-Kr | H | -499 | 2.454 | +0.576 | +0.070 |
| BDG-Cu-Kr | H | -521 | 2.437 | +0.625 | +0.085 |
| BDG-Zn-Kr | H | -160 | 3.815 | +0.344 | +0.004 |
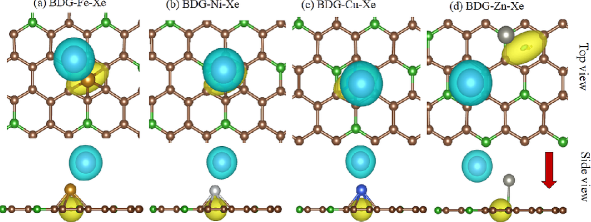
To get more insights on adsorption mechanism, the charge density difference maps and partial density of states (PDOS) are analyzed. The charge density difference maps are computed as, , where, , and are the charge densities of substrate-adatom, substrate and adatoms in gas phase, respectively. Figure 4 shows the charge density difference maps of Xe adsorbed on BDG-TM substrates (Kr on BDG-TM is shown figure S4 - SI). Yellow and cyan colour correspond to electron rich and deficit regions. Cyan colour around the adatoms symbolizes that, charge transfer is from adatoms to the BDG-TM substrates, this is true for all BDG-TM-adatom systems considered here and is in agreement with Bader charge analysis (Table 2). Under polarization, there will be a distortion of charge cloud around the adatom, which gauges the strength of polarization. From the visual inspection (Figure 4), it can be seen that on BDG-Zn-adatom system, the charge cloud is almost spherical in shape and hence distortion is least, indicating a smaller polarization. Meanwhile, the distortion from spherical shape is conspicuous in other BDG-TM-adatom systems and it varies as BDG-Cu-adatom > BDG-Ni-adatom > BDG-Fe-adatom > BDG-Zn-adatom, which is a consequence of large charge transfer and polarization effects in these system and is concomitant with . The charge density difference maps complement the earlier Bader charge analysis and also portrait the polarizing capability of each substrate, which facilitating the adsorption.
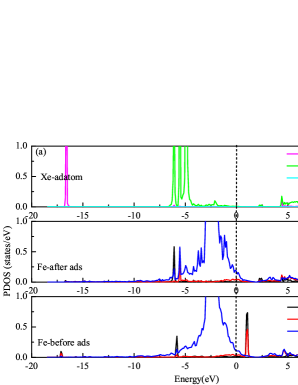
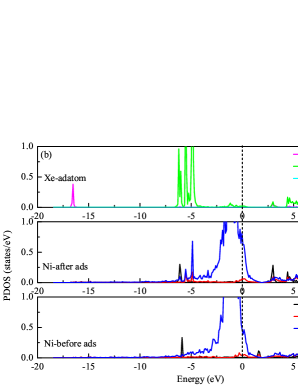
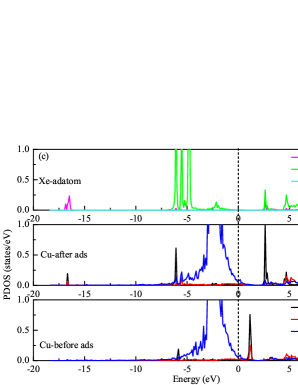
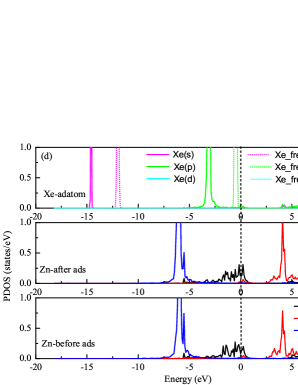
Afterwards, the electronic structure of BDG-TM-adatoms are analyzed by computing the partial density of states (PDOS). Figure 5 shows the PDOS of BDG-TM-Xe systems. The PDOS of free Xe is mainly composed of s and p orbitals (Figure 5d). Near the Fermi level, TM-d (of Fe, Ni and cu) orbitals have several overlapping peaks with Xe-p orbitals, signifying that these orbitals interact significantly upon adsorption. One can see the wiggles on the tail (around -5 eV) of TM-d and splitting of Xe-p orbitals, which are the consequences of strong interaction of TM-d and Xe-p orbitals. The PDOS of BDG-Zn-Xe (Figure 5d) is distinct from above systems. The Zn-d orbital remains intact before and after adsorption, also there is no splitting of Xe-p orbital upon adsorption reveals a weak interaction of Xe-p and Zn-d orbital, which might have resulted in low on BDG-Zn substrate.
For Fe, Ni and Cu decorated system, the difference in is very small, hence it’s difficult to have a quantitative comparison of PDOS of these system. Silva et al (Silva et al., 2003) reported that, when the Xe adatom approaches the Pt (111) surfaces, the Xe-p orbitals partially depopulates and previously un-occupied 6s and 5d states become partially occupied at closer distances where the is maximum. In the present case, the depopulation of Xe-p and partial occupancy of Xe-s orbital is occurring in Fe, Ni and Cu decorated systems, and it’s more apparent for BDG-Cu-Xe system (Figure 5c), where the adatom-substrate equilibrium distance is minimum and is maximum (Table 2). Unlike metallic substrate, adatom d orbital is not contributing to the PDOS here. Below the Fermi level, the edge of Xe-p orbitals are distributed at -6.09, -6.20, -6.10 and -3.08 eV, for Fe, Ni, Cu and Zn decorated system, respectively. Similarly the Xe-s orbital peaks at -16.60, -16.55, -16.85 and -14.59 eV for these system. Upon adsorption, the shifting of adatom orbitals to lower energy is an indication of charge transfer from adatom to substrate. Xe-p and Xe-s orbitals shows large downshift in energy on Fe, Ni and Cu decorated system with respect to Zn decorated, which again substantiate the large charge transfer from Xe to these substrates. The peak position of Xe-p on Fe, Ni and Cu systems are close in energy; at the same time the Xe-s orbital of Cu-decorated system shows appreciable downshift in energy, and also exhibits a splitting, which might have resulted in slightly higher charge transfer in Cu decorated system with respect to Ni & Fe.
The change in electronic structure upon Kr adsorption is shown in figure S5 - SI. Similar to BDG-TM-Xe systems, splitting of Kr-p and its strong interaction with TM-d orbital is clearly visible (around -7 eV) on Fe, Ni and Cu decorated system. On BDG-Cu, the above effect is more conspicuous and also the Kr-p peak is little down in energy with respect to Fe & Ni, leading to a slightly more charge transfer. Unlike Xe adsorption, the depopulation of Xe-p and partial occupancy of Xe-s orbital is not apparent in Kr adsorption, which diminish the charge transfer from Kr to substrate, leading to low polarization and . As seen in Xe adsorption, the Kr-p and Zn-d orbitals interact weakly on BDG-Zn substrate and is consistent with the low obtained.
III.3 Effects of nano clustering and dispersion of TMs on adsorption properties
From experimental front, one should know the effect of clustering and dispersion of TM atoms on for practical applications. In-order to analyze these effects, nano-clusters of Cu (N = 4) are opted due to their higher adsorption capacity. Arbitrary Cu4 clusters need not guarantee a ground state configuration, hence a genetic algorithm(GA) based technique is used to identify the global minima (GM) (Jäger et al., 2018). To accomplish this task, Mexican Enhanced Genetic Algorithm (MEGA) is employed; it’s a first principle based global optimization code, which combines the genetic algorithm with parallel DFT runs to search for potential isomers (Vargas et al., 2017). To obtain the GM in gas phase, 220 Cu4 configurations were generated. The evolution of gas phase Cu4 clusters is shown in (Figure S6 - SI). The energies of 10 low-lying isomers are spread in the range of -7.33 to -6.93 eV. Lowest energy isomer is designated as GM and it’s rhombus in shape. Subsequently, this GM structure is placed over the BDG and relaxed to obtain the BDG-Cu4 substrate (Figure 6). To delineate the effect of clustering and dispersion, a BDG substrate with 4-Cu atoms dispersed at alternate H sites is considered (Figure 6c).
Further, the adsorption parameters of Xe & Kr have been computed on this two substrates. Here, three different cases have been considered, a) adatom at H-site near the cluster, b) adatom on-top of the cluster, c) adatom at H-site in Cu dispersed BDG-substrate. From table 3, it’s clear that the of Xe decreases significantly on BDG substrate with Cu4 cluster in comparison to adsorption on BDG-Cu substrate (Table 2). In case-a, the Xe atom moves from the initial H site to T site adjacent to cluster, and the corresponding = -405 meV; which is 44 % smaller than the value obtained on BDG-Cu substrate. When Xe atom placed on the top of Cu4 cluster (case-b), it get expelled to a far away position from cluster, leads to very weak adsorption (-79 meV). In the case of Cu dispersed BDG-substrate (case-c), firstly, it can be seen that, there is no agglomeration of Cu atoms, which is an outcome of B doping in graphene sheet (Beheshti et al., 2011). Most importantly, the is significantly high as found earlier (Table 2). Clustering of Cu atoms leads to an increase in coordination, which reduces the availability of active binding sites, and hence become less reactive for adatoms. This would have resulted in such drastic reduction in . These findings are justified by the earlier observation(Xu et al., 2008; Dobrota and Pas̆ti, 2020); binding energy of CO and NO on Pt cluster (Ptx) decreases as cluster size increases. Large clusters (x > 10) become less sensitive to CO and NO and show similar binding parameters of densely packed Pt(111) surface.
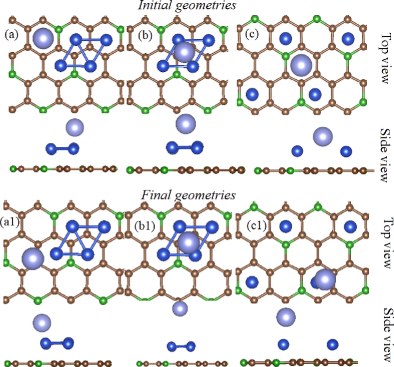
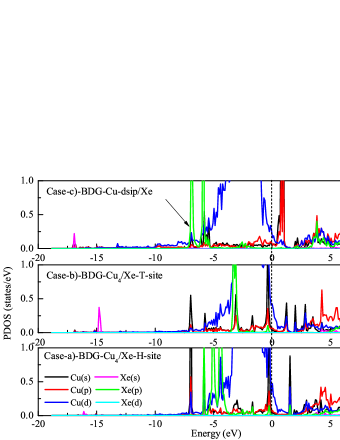
Figure 7 shows the PDOS of above three cases. The interaction of Xe-p & Cu-d orbitals is conspicuous in BDG-Cu4/Xe-H-site(case-a) and BDG-Cu-disp/Xe systems (case-c). In BDG-Cu4/Xe-T-site (case-b), Xe-p & Cu-d orbitals interacts weakly near the Fermi level as well as the Xe-p edge peaks at higher energy; which is a consequence of expulsion of Xe from the cluster. Among case-a & case-c, the downshift of Xe-p and Xe-s orbital is comparatively higher in case-c (Figure 7c), dictating a large charge transfer and strong adsorption of adatoms on BDG-Cu-dispersed substrate in comparison to BDG-Cu4 substrate.
| TM- nano-clusters | TM-dispersion | ||||||||
|---|---|---|---|---|---|---|---|---|---|
| System | site | (meV) | (Å) | site | (meV) | (Å) | site | (meV) | (Å) |
| BDG -Cu4-Xe | H | -405 | 2.744 | T | -79.0 | 4.306 | H | -684 | 2.569 |
| BDG -Cu4-Kr | H | -255 | 2.697 | T | -62.0 | 4.167 | H | -487 | 2.456 |
Afterwards, the work functions (W.F) of above systems were analyzed. The W.F of pristine BDG sheet is 5.578 eV, which is in qualitative agreement with previous calculation (Lazar et al., 2014). Upon metal binding, the W.F value of BDG-Cu4 cluster & BDG -Cu dispersed substrates are 5.332 & 4.859 eV, respectively. Metal binding leads to a decrease in W.F and it’s more prominent in Cu dispersed system. Table 4 shows the W.F and change in W.F upon adsorption of Xe & Kr. In all the cases, the W.F value decreases upon adsorption of Xe & Kr. This is due to the charge transfer between adatom and substrates. The value of W.F of substrate-adatom systems falls below the pristine BDG, signifies that adatom posses a positive effective charge, which have been confirmed from earlier Bader charge analysis and charge density distribution maps. Noteworthy, the change in W.F () is more conspicuous on Cu dispersed substrate, which is corroborating with the higher obtained on these substrates. Later, the induced dipole moment of above three system is quantitatively estimated with dipole correction along the direction normal to the substrate (Makov and Payne, 1995). From table 4, it can be seen that, the induced dipole moment is highest for BDG-Cu-disp/adatom system than the BDG-Cu4 /adatoms. The large induced dipole field in the BDG-Cu-disp/adatom system facilitates a strong adsorption. From the above observations, it can be concluded that, clustering of Cu atoms deteriorate the of Xe & Kr. Hence for experimental realization, uniform dispersion of fine metal particle on BDG is preferred. In the present study, we employed a 4-atom Cu cluster, in experiments the cluster size is in the nanometric regime. It would be interesting to study the cluster size dependence of , which is beyond the scope of the present work and is planned to be carried out as an independent computational study.
| TM- nano-clusters | TM-dispersion | |||||||||||
|---|---|---|---|---|---|---|---|---|---|---|---|---|
| System | site | P | site | P | site | P | ||||||
| BDG -Cu4-Xe | H | 5.162 | -0.170 | -0.815 | T | 5.283 | -0.049 | -0.535 | H | 4.618 | -0.240 | -2.435 |
| BDG -Cu4-Kr | H | 5.225 | -0.107 | -0.689 | T | 5.302 | -0.029 | -0.464 | H | 4.676 | -0.183 | -2.326 |
III.4 Comparison with prior studies
Finally, to have a quantitative comparison, an Atlas of Xe on different substrates have been made with few representative literatures (Figure 8). As mentioned in introduction, metallic substrates were extensively used to adsorb the Xe atom. There is a considerable spread in the values of Xe on metal surfaces among different simulations. The of Xe/pd(111) (Silva et al., 2003) system computed using local density approximation (LDA) is -453 (meV), it’s 25.8 % higher than that of experimental value (Vidali et al., 1991; Zhu et al., 2003). This large discrepancy stems from the inherent over binding in LDA calculations. Later, vdW corrected GGA calculations predicts the of Xe/Pd(111) is -332 meV (Tao and Rappe, 2014), which shows very good agreement with experimental values (-360 meV) and the deviation is only 7.7 % (Vidali et al., 1991; Zhu et al., 2003). The similar refinement in of Xe/Cu(111), Xe/Ag(111), Xe/Pt(111) and Xe/Ni(111) system is obtained with vdW correction (Ruiz et al., 2016; Tao and Rappe, 2014). From the accurate GGA-vdW calculations, the upper bound of on metallic substrate is fixed to -401 meV on Ni (111).
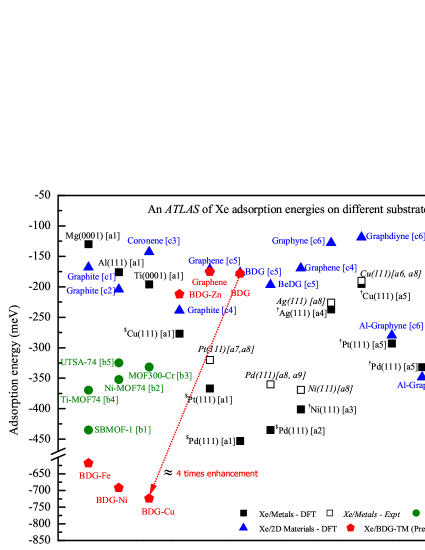
The on the porous structures lies in the range of -325 to -435 meV [green circles]. Noteworthy, several efficient MOFs and porous substrates were reported in literature. Thallapally et al has done several remarkable works in this direction, more details can be found in the references (Banerjee et al., 2015, 2018). In their studies, authors quantitatively assessed the Xe adsorption capacity on different porous materials from isosteric heat of adsorption. A direct comparison of the isosteric heat of adsorption and DFT adsorption energy is not meaningful. Henceforth, only selected MOF’s are incorporated in Atlas, for which the Xe were directly calculated and reported. Many MOFs with unsaturated open metal sites, say for example Ni-DOBDC (Ghose et al., 2015) is expected to perform like BDG-TM. But the Xe on Ni-DOBDC is in the range of -350 meV, which is far below the BDG-TM value. This might be due to the presence of strong screening of electrostatic fields by 2D material substrates (Ambrosetti and Silvestrelli, 2019, 2018), which would be helpful for not propagating the dipole fields far away and hence facilitate the adsorption.
2D materials with different chemical doping have the in the range of -118 to -348 meV [blue triangles]. It is reported that the Xe on Cu doped graphene is -2470 meV (BIN et al., 2013). To verify this unusually high , the calculations were repeated and an adsorption energy of -270 meV is obtained (section-C SI, Table S3 - SI). The details of calculations are given in SI. The value obtained in the present study is in the same order of previous reports of Xe on doped graphene with different metallic and non metallic impurities (Vazhappilly et al., 2017), giving qualitative assurance to the present data. On the newly employed BDG-TM substrates, the spans in the range of -212 to -724 meV [red pentagons]. The highest is obtained on BDG-Cu substrate, which is 4.06 times of the pristine BDG value. It is noteworthy that, the enhancement on BDG-Cu substrate is approximately twice that of the upper bounds of on conventional metallic, MOFs and 2D material substrates (1.80, 1.66 and 2.08), respectively.
IV Conclusions
In conclusion, systematic ab inito calculations have been performed to study the adsorption of Xe & Kr (adatoms) on the transition-metal atoms (TMs) decorated boron-doped graphene (BDG-TM) sheets. Substantial enhancement in the adsorption energies ( is obtained on BDG-TM substrates, and it varies as, BDG-Cu > BDG-Ni > BDG-Fe > BDG-Zn. The enhancement is approximately four times that of the pristine BDG value. TM-decoration alters the charge distribution at substrate-adatom interface, which tinkers the polarization of adatoms, resulting in dramatic improvement in . This is further quantified from the effective charges on the adatoms and it follows the above sequence of , hence self consistent with each other. Further, the electronic density of states analysis shows a significant interaction of TM-d & Xe-p orbitals near the Fermi level in Fe, Ni and Cu decorated system, where the enhancement is more apparent. Afterwards, the effects of clustering and dispersion of Cu atoms on are analyzed, and found that clustering of Cu atoms deteriorate the of Xe & Kr. Hence for experimental realization, uniform dispersion of fine metal particle is preferred on BDG rather than using their clusters. Finally, to have a quantitative comparison, an Atlas of of Xe is made. The Xe on BDG-Cu is approximately twice that of the upper bounds of obtained on conventional metallic, MOFs and 2D material substrates. The enhancement in on new substrates is highly encouraging and these results pave the way for experimental realization of TM decorated BDG sheets/flakes for efficient capture and segregation of Xe & Kr; it may supersede the conventional metallic and MOFs substrates in commercial as well as in nuclear applications.
References
- Soelberg et al. (2013) N. R. Soelberg, T. G. Garn, M. R. Greenhalgh, J. D. Law, R. Jubin, D. M. Strachan and P. K. Thallapally, Science and Technology of Nuclear Installations, 2013, 2013, 1–12.
- Rest et al. (2019) J. Rest, M. Cooper, J. Spino, J. Turnbull, P. V. Uffelen and C. Walker, Journal of Nuclear Materials, 2019, 513, 310 – 345.
- Hoffman and Berg (2018) I. Hoffman and R. Berg, Journal of Radioanalytical and Nuclear Chemistry, 2018, 318, 165–173.
- Dmochowski (2009) I. Dmochowski, Nature Chemistry, 2009, 1, 250–250.
- Bruch et al. (1997) L. Bruch, M. Cole and E. Zaremba, Physical Adsorption: Forces and Phenomena, Clarendon Press, 1997.
- Wandelt and Hulse (1984) K. Wandelt and J. E. Hulse, The Journal of Chemical Physics, 1984, 80, 1340–1352.
- Vidali et al. (1991) G. Vidali, G. Ihm, H.-Y. Kim and M. W. Cole, Surface Science Reports, 1991, 12, 135 – 181.
- Silva et al. (2003) J. L. F. D. Silva, C. Stampfl and M. Scheffler, Phys. Rev. Lett., 2003, 90, 066104.
- Zhu et al. (2003) J. Zhu, H. Ellmer, H. Malissa, T. Brandstetter, D. Semrad and P. Zeppenfeld, Phys. Rev. B, 2003, 68, 045406.
- Da Silva and Stampfl (2008) J. L. F. Da Silva and C. Stampfl, Phys. Rev. B, 2008, 77, 045401.
- Chen et al. (2012) D.-L. Chen, W. A. Al-Saidi and J. K. Johnson, Journal of Physics: Condensed Matter, 2012, 24, 424211.
- Silvestrelli and Ambrosetti (2015) P. L. Silvestrelli and A. Ambrosetti, Phys. Rev. B, 2015, 91, 195405.
- Bazan et al. (2011) R. E. Bazan, M. Bastos-Neto, A. Moeller, F. Dreisbach and R. Staudt, Adsorption, 2011, 17, 371–383.
- Thallapally et al. (2012) P. K. Thallapally, J. W. Grate and R. K. Motkuri, Chem. Commun., 2012, 48, 347–349.
- Banerjee et al. (2018) D. Banerjee, C. M. Simon, S. K. Elsaidi, M. Haranczyk and P. K. Thallapally, Chem, 2018, 4, 466 – 494.
- Xiong et al. (2018) S. Xiong, Y. Gong, S. Hu, X. Wu, W. Li, Y. He, B. Chen and X. Wang, J. Mater. Chem. A, 2018, 6, 4752–4758.
- Gong et al. (2018) Y. Gong, Y. Tang, Z. Mao, X. Wu, Q. Liu, S. Hu, S. Xiong and X. Wang, J. Mater. Chem. A, 2018, 6, 13696–13704.
- Wang et al. (2014) H. Wang, K. Yao, Z. Zhang, J. Jagiello, Q. Gong, Y. Han and J. Li, Chem. Sci., 2014, 5, 620–624.
- Banerjee et al. (2015) D. Banerjee, A. J. Cairns, J. Liu, R. K. Motkuri, S. K. Nune, C. A. Fernandez, R. Krishna, D. M. Strachan and P. K. Thallapally, Accounts of Chemical Research, 2015, 48, 211–219.
- Perry et al. (2014) J. J. Perry, S. L. Teich-McGoldrick, S. T. Meek, J. A. Greathouse, M. Haranczyk and M. D. Allendorf, The Journal of Physical Chemistry C, 2014, 118, 11685–11698.
- Chen et al. (2014) L. Chen, P. S. Reiss, S. Y. Chong, D. Holden, K. E. Jelfs, T. Hasell, M. A. Little, A. Kewley, M. E. Briggs, A. Stephenson, K. M. Thomas, J. A. Armstrong, J. Bell, J. Busto, R. Noel, J. Liu, D. M. Strachan, P. K. Thallapally and A. I. Cooper, Nature Materials, 2014, 13, 954–960.
- Rahimi et al. (2018) R. Rahimi, S. Kamalinahad and M. Solimannejad, Materials Research Express, 2018, 5, 035006.
- Banerjee et al. (2016) D. Banerjee, C. M. Simon, A. M. Plonka, R. K. Motkuri, J. Liu, X. Chen, B. Smit, J. B. Parise, M. Haranczyk and P. K. Thallapally, Nature Communications, 2016, 7, 11831.
- Gadipelli and Guo (2015) S. Gadipelli and Z. X. Guo, Progress in Materials Science, 2015, 69, 1 – 60.
- Chen et al. (2003) X.-R. Chen, X.-L. Zhou, J. Zhu and Q.-Q. Gou, Physics Letters A, 2003, 315, 403 – 408.
- Pussi et al. (2004) K. Pussi, J. Smerdon, N. Ferralis, M. Lindroos, R. McGrath and R. Diehl, Surface Science, 2004, 548, 157 – 162.
- Da Silva and Stampfl (2007) J. L. F. Da Silva and C. Stampfl, Phys. Rev. B, 2007, 76, 085301.
- Sheng et al. (2010) L. Sheng, Y. Ono and T. Taketsugu, The Journal of Physical Chemistry C, 2010, 114, 3544–3548.
- Ambrosetti and Silvestrelli (2011) A. Ambrosetti and P. L. Silvestrelli, The Journal of Physical Chemistry C, 2011, 115, 3695–3702.
- Vazhappilly et al. (2017) T. Vazhappilly, T. K. Ghanty and B. Jagatap, Journal of Nuclear Materials, 2017, 490, 174 – 180.
- Vazhappilly and Ghanty (2020) T. Vazhappilly and T. K. Ghanty, Materials Today Communications, 2020, 22, 100738.
- Hu et al. (2020) J. Hu, L. Zhao, J. Du and G. Jiang, Applied Surface Science, 2020, 504, 144326.
- Nachimuthu et al. (2014) S. Nachimuthu, P.-J. Lai and J.-C. Jiang, Carbon, 2014, 73, 132 – 140.
- Jungsuttiwong et al. (2016) S. Jungsuttiwong, Y. Wongnongwa, S. Namuangruk, N. Kungwan, V. Promarak and M. Kunaseth, Applied Surface Science, 2016, 362, 140 – 145.
- Cortés-Arriagada et al. (2018) D. Cortés-Arriagada, N. Villegas-Escobar and D. E. Ortega, Applied Surface Science, 2018, 427, 227 – 236.
- Sankaran et al. (2008) M. Sankaran, B. Viswanathan and S. Srinivasa Murthy, International Journal of Hydrogen Energy, 2008, 33, 393 – 403.
- Wu et al. (2011) H.-Y. Wu, X. Fan, J.-L. Kuo and W.-Q. Deng, The Journal of Physical Chemistry C, 2011, 115, 9241–9249.
- Beheshti et al. (2011) E. Beheshti, A. Nojeh and P. Servati, Carbon, 2011, 49, 1561 – 1567.
- Shirasaki et al. (2000) T. Shirasaki, A. Derré, M. M. énétrier, A. Tressaud and S. Flandrois, Carbon, 2000, 38, 1461 – 1467.
- Kresse and Furthmüller (1996) G. Kresse and J. Furthmüller, Phys. Rev. B, 1996, 54, 11169–11186.
- Perdew et al. (1996) J. P. Perdew, K. Burke and M. Ernzerhof, Phys. Rev. Lett., 1996, 77, 3865–3868.
- Monkhorst and Pack (1976) H. J. Monkhorst and J. D. Pack, Phys. Rev. B, 1976, 13, 5188–5192.
- Vazhappilly et al. (2016) T. Vazhappilly, T. K. Ghanty and B. N. Jagatap, The Journal of Physical Chemistry C, 2016, 120, 10968–10974.
- Tkatchenko et al. (2012) A. Tkatchenko, R. A. Distasio, R. Car and M. Scheffler, Phys. Rev. Lett., 2012, 108, 236402.
- Rêgo et al. (2017) C. R. C. Rêgo, P. Tereshchuk, L. N. Oliveira and J. L. F. Da Silva, Phys. Rev. B, 2017, 95, 235422.
- Al-Saidi et al. (2012) W. A. Al-Saidi, V. K. Voora and K. D. Jordan, Journal of Chemical Theory and Computation, 2012, 8, 1503–1513.
- Freire et al. (2018) R. L. H. Freire, D. Guedes-Sobrinho, A. Kiejna and J. L. F. Da Silva, The Journal of Physical Chemistry C, 2018, 122, 1577–1588.
- Naeini et al. (1996) J. G. Naeini, B. M. Way, J. R. Dahn and J. C. Irwin, Phys. Rev. B, 1996, 54, 144–151.
- Agnoli and Favaro (2016) S. Agnoli and M. Favaro, J. Mater. Chem. A, 2016, 4, 5002–5025.
- M. Dieb et al. (2018) T. M. Dieb, Z. Hou and K. Tsuda, The Journal of Chemical Physics, 2018, 148, 241716.
- Nakada and Ishii (2011) K. Nakada and A. Ishii, Solid State Communications, 2011, 151, 13 – 16.
- Santos et al. (2010) E. J. G. Santos, A. Ayuela and D. Sánchez-Portal, New Journal of Physics, 2010, 12, 053012.
- Johll et al. (2009) H. Johll, H. C. Kang and E. S. Tok, Phys. Rev. B, 2009, 79, 245416.
- Yanagisawa et al. (2000) S. Yanagisawa, T. Tsuneda and K. Hirao, The Journal of Chemical Physics, 2000, 112, 545–553.
- Tang et al. (2009) W. Tang, E. Sanville and G. Henkelman, Journal of Physics: Condensed Matter, 2009, 21, 084204.
- Thonhauser et al. (2007) T. Thonhauser, V. R. Cooper, S. Li, A. Puzder, P. Hyldgaard and D. C. Langreth, Phys. Rev. B, 2007, 76, 125112.
- Shepard et al. (2019) R. Shepard, S. Shepard and M. Smeu, Surface Science, 2019, 682, 38 – 42.
- Kittel (2004) C. Kittel, Introduction to Solid State Physics, Wiley, 2004.
- Ambrosetti et al. (2014) A. Ambrosetti, A. M. Reilly, R. A. DiStasio and A. Tkatchenko, The Journal of Chemical Physics, 2014, 140, 18A508.
- Kancharlapalli et al. (2019) S. Kancharlapalli, S. Natarajan and T. K. Ghanty, The Journal of Physical Chemistry C, 2019, 123, 27531–27541.
- Kronik and Morikawa (2013) L. Kronik and Y. Morikawa, in The Molecule-Metal Interface, ed. N. Koch, N. Ueno and A. T. S. Wee, Wiley-VCH Verlag GmbH & Co. KGaA, Weinheim, Germany, 2013, pp. 51–89.
- Lang (1981) N. D. Lang, Phys. Rev. Lett., 1981, 46, 842–845.
- Bagus et al. (2002) P. S. Bagus, V. Staemmler and C. Wöll, Phys. Rev. Lett., 2002, 89, 096104.
- Jäger et al. (2018) M. Jäger, R. Schäfer and R. L. Johnston, Advances in Physics: X, 2018, 3, 1516514.
- Vargas et al. (2017) J. A. Vargas, F. Buendía and M. R. Beltràn, The Journal of Physical Chemistry C, 2017, 121, 10982–10991.
- Xu et al. (2008) Y. Xu, R. B. Getman, W. A. Shelton and W. F. Schneider, Phys. Chem. Chem. Phys., 2008, 10, 6009–6018.
- Dobrota and Pas̆ti (2020) A. S. Dobrota and I. A. Pas̆ti, Journal of Electrochemical Science and Engineering, 2020, 10, 141–159.
- Lazar et al. (2014) P. Lazar, R. Zbořil, M. Pumera and M. Otyepka, Phys. Chem. Chem. Phys., 2014, 16, 14231–14235.
- Makov and Payne (1995) G. Makov and M. C. Payne, Phys. Rev. B, 1995, 51, 4014–4022.
- Tao and Rappe (2014) J. Tao and A. M. Rappe, Phys. Rev. Lett., 2014, 112, 106101.
- Ruiz et al. (2016) V. G. Ruiz, W. Liu and A. Tkatchenko, Phys. Rev. B, 2016, 93, 035118.
- Seyller et al. (1998) T. Seyller, M. Caragiu, R. Diehl, P. Kaukasoina and M. Lindroos, Chemical Physics Letters, 1998, 291, 567 – 572.
- Seyller et al. (1999) T. Seyller, M. Caragiu, R. D. Diehl, P. Kaukasoina and M. Lindroos, Phys. Rev. B, 1999, 60, 11084–11088.
- Ghose et al. (2015) S. K. Ghose, Y. Li, A. Yakovenko, E. Dooryhee, L. Ehm, L. E. Ecker, A.-C. Dippel, G. J. Halder, D. M. Strachan and P. K. Thallapally, The Journal of Physical Chemistry Letters, 2015, 6, 1790–1794.
- Tao et al. (2020) Y. Tao, Y. Fan, Z. Xu, X. Feng, R. Krishna and F. Luo, Inorganic Chemistry, 2020, 59, 11793–11800.
- Ambrosetti and Silvestrelli (2019) A. Ambrosetti and P. L. Silvestrelli, The Journal of Physical Chemistry Letters, 2019, 10, 2044–2050.
- Ambrosetti and Silvestrelli (2018) A. Ambrosetti and P. L. Silvestrelli, Carbon, 2018, 139, 486 – 491.
- BIN et al. (2013) H. BIN, Y. DINGZHONG and C. BIBO, Asian Journal of Chemistry, 2013, 25, 9537–9542.