Spectral index of the Galactic foreground emission in the MHz range
Abstract
Total-power radiometry with individual meter-wave antennas is a potentially effective way to study the Cosmic Dawn () through measurement of sky brightness arising from the cm transition of neutral hydrogen, provided this can be disentangled from much stronger Galactic and extra-galactic foregrounds. In the process, measured spectra of integrated sky brightness temperature can be used to quantify the foreground emission properties. In this work, we analyze a subset of data from the Large-aperture Experiment to Detect the Dark Age (LEDA) in the range MHz and constrain the foreground spectral index in the northern sky visible from mid-latitudes. We focus on two zenith-directed LEDA radiometers and study how estimates of vary with local sidereal time (LST). We correct for the effect of gain pattern chromaticity and compare estimated absolute temperatures with simulations. We develop a reference dataset consisting of 14 days of optimal condition observations. Using this dataset we estimate, for one radiometer, that varies from at LST h to a steeper at LST h, consistently with sky models and previous southern sky measurements. In the LST h range, however, we find that fluctuates between and (data scatter ). We observe a similar vs. LST trend for the second radiometer, although with slightly smaller , in the range, over h of LST (data scatter ). Combining all data gathered during the extended campaign between mid-2018 to mid-2019, and focusing on the LST h range, we infer good instrument stability and find with .
keywords:
dark ages, reionization, first stars - Galaxy: structure - instrumentation: miscellaneous1 Introduction
The challenging measurement of a signal from the Cosmic Dawn of the Universe finds its most promising observable in the cm line of the neutral Hydrogen (e.g., Furlanetto et al., 2006; Pritchard & Loeb, 2010). At Cosmic Dawn, Ly- photons, produced by the first stars, couple the excitation temperature of the cm line to the gas kinetic temperature through the Wouthuysen-Field effect (WF, Wouthuysen, 1952; Field, 1958), producing a negative contrast against the Cosmic Microwave Background (CMB) temperature and thus an absorption signal. Eventually, the progress of structure formation through gravitational collapse completely couples the spin temperature to the gas temperature. As a consequence of gas heating, most likely by an X-ray background, the gas/spin temperature is then driven well above the CMB temperature (e.g., Venkatesan et al., 2001; Pritchard & Furlanetto, 2007; Mesinger et al., 2013). The interplay between Ly- coupling and X-ray heating is thus expected to create a few hundreds mK absorption features in the global - i.e. sky averaged - cm signal, sensitive to the formation of the first luminous structures in the Universe (e.g., Barkana & Loeb, 2005; Furlanetto et al., 2006; Fialkov et al., 2013; Mirocha, 2014; Mesinger et al., 2016; Mirocha & Furlanetto, 2019), and to the thermal history of the intergalactic medium (Pritchard & Furlanetto, 2007; Mesinger et al., 2013; Fialkov et al., 2014).
In principle, the global cm signal can be measured with a single antenna and noise-switched receiver in O() hours (e.g., Shaver et al., 1999; Bernardi et al., 2015; Harker et al., 2016). The Experiment to Detect the Global Epoch-of-Reionization Signatures (EDGES) team has claimed detection of a broad absorption profile peaking at mK and centered at MHz (Bowman et al., 2018). This is more than a factor two deeper than predicted from theory based on standard physics (e.g. Cohen et al., 2017). If the EDGES signal is confirmed to be of cosmological origin, it implies that either the temperature of the radio background is higher than that of the CMB (e.g. Bowman et al., 2018) or the neutral gas at is colder than expected (e.g. due to interactions with cold dark matter, Barkana, 2018). The flat line profile is also novel.
Subsequent analysis by other authors have suggested the existence of a residual unmodeled systematic sinusoidal feature in EDGES data (Hills et al., 2018; Singh & Subrahmanyan, 2019; Bevins et al., 2020) that could modify their best fit parameters. Similarly, Spinelli et al. (2019) suggested an unaccounted for contamination from polarized foregrounds. Moreover, using Bayesian evidence-based comparison, Sims & Pober (2020) found no strong evidence in favor of models including a global cm. The importance and the implications of the EDGES result need confirmation from another independent experiment to be fully convincing against criticisms.
The effort to measure the global cm signal has been ongoing for several years with variegated instrumental designs. The Large aperture Experiment to detect the Dark Ages (LEDA; Price et al., 2018), whose latest data are analyzed in this work, constrained at confidence level the amplitude ( mK) and the width ( MHz) of a Gaussian model for the trough (Bernardi et al., 2016). Moreover, the upgraded Shaped Antenna measurement of the background RAdio Spectrum (SARAS 3) has provided constraints in the range (Singh et al., 2017, 2018); the “Sonda Cosmologica de las Islas para la Deteccion de Hidrogeno Neutro (SCI-HI; Voytek et al., 2014) reported a K root mean square (RMS) residual in the range MHz. Other experiments are the Probing Radio Intensity at high-Z from Marion (PRIZM) experiment (Philip et al., 2019), the Broadband Instrument for Global HydrOgen ReioNisation Signal (BIGHORNS; Sokolowski et al., 2015) and the Radio Experiment for the Analysis of Cosmic Hydrogen (REACH)111http://www.astro.phy.cam.ac.uk/research/research-projects/reach. Moreover, there are proposals (e.g. the Dark Ages Polarimeter Pathfinder [DAPPER]222https://www.colorado.edu/project/dark-ages-polarimeter-pathfinder) to measure the cm global signal from the orbit of the moon to avoid terrestrial radio frequency interference, ionospheric corruption and solar radio emissions.
The key challenge to measuring the cm signal is the subtraction of the bright foregrounds. The low-frequency radio sky is a superposition of several components including galactic synchrotron and free-free emission, supernova remnants, radio galaxies and absorption from HII regions. Galactic and extra-galactic synchrotron and free-free emissions have typical sky temperature of thousands of K at 75 MHz, several orders of magnitude stronger than the pristine Cosmic Dawn signal. The proper characterization of the foreground emission thus plays a fundamental role in the cm global signal analysis. Current modeling often uses extrapolations of the all-sky 408 MHz survey of Haslam et al. (1982) to lower frequencies. Other more sophisticated models are available: an improved version of the Global Sky Model (GSM, De Oliveira-Costa et al., 2008; Zheng et al., 2016), including Parkes telescope maps at 150 MHz and 85 MHz (Landecker & Wielebinski, 1970); the Global MOdel for the radio Sky Spectrum (GMOSS, Sathyanarayana Rao et al., 2017) for the low-frequency radio sky from 22 MHz to 23 GHz. However, the majority of information contained in these models is derived at high frequencies. Other measurements are available: Guzmán et al. (2011) produced a Galactic large-scale synchrotron emission temperature map at 45 MHz covering more than of the sky; the northern hemisphere has been covered by the Long Wavelength Array (LWA)-1 Low-Frequency Sky Survey (Dowell et al., 2017) at a range of frequencies between 35 and 80 MHz with few degree resolution. These maps are not in complete agreement with the GSM at the same frequencies, probably due to an increased contribution of free–free absorption (Dowell et al., 2017). Eastwood et al. (2018) released low-frequency maps of the full sky visible from the Owens Valley Radio Observatory (OVRO) between and MHz. OVRO-LWA maps have angular resolution thus complementing the existing full-sky maps at these frequencies, but being exclusively from interferometric observations, they do not represent the globally averaged sky brightness.
Global signal experiments, while targeting the Cosmic Dawn, can contribute to the knowledge of the low-frequency radio sky: with their large beams they average the absolute sky brightness temperature over large spatial scales. The diffuse and continuum foreground sources are known to be spectrally smooth; that is, they should exhibit power-law spectra333 over the low frequency band of interest. Measurements of the Galactic foreground spectral index have been obtained with single dipole antennas. Rogers & Bowman (2008) found, for the frequency range MHz, that the spectral index of diffuse emission was at high-Galactic latitudes. Patra et al. (2015), using the SARAS experiment, measured the spectral index in the MHz band covering the h local sidereal time (LST) range. They reported a slow variation with LST and a steepening from to when observing off the Galactic center. In Mozdzen et al. (2017) the EDGES team obtained a measurement of the spectral index in the southern hemisphere, in the frequency range MHz. They found in the h LST range, with an increase up to at h, when the Galactic center is transiting. In the MHz range, Mozdzen et al. (2019) found the spectral index to be for LST values below h and a flattening to when the Galactic center transits. Moreover, exploiting a lunar occultation technique with the Murchison Widefield Array telescope, McKinley et al. (2018) measured a spectral index of , at the position of the Moon, in the frequency range MHz.
The LEDA experiment covers instead the full northern hemisphere, offering an important complementary measure of the spectral index. Price et al. (2018), using LEDA data from to MHz, found that the spectral index varies between to over the full LST range.
In this work, we present new results on the spectral index of the Galactic foreground emission in the MHz range using the latest LEDA measurements, covering nights distributed between mid-2018 to mid-2019.
The paper is organized as follows. In Section 2 we describe LEDA observation and data processing, and we assess the quality of our data. In Section 3.3 we present our beam model and correct for the effect of its chromatic response. This is an important step to correctly evaluate the spectral index that was not performed in previous LEDA analysis. In Section 4 we apply a global temperature scale correction to the data to overcome some systematic effects and to match our spectra with the expected sky temperature. Our results are presented in Section 5, followed by discussion and conclusions in Section 6.

We highlight in color the two antennas whose data are used in this analysis.
2 Observations and data processing
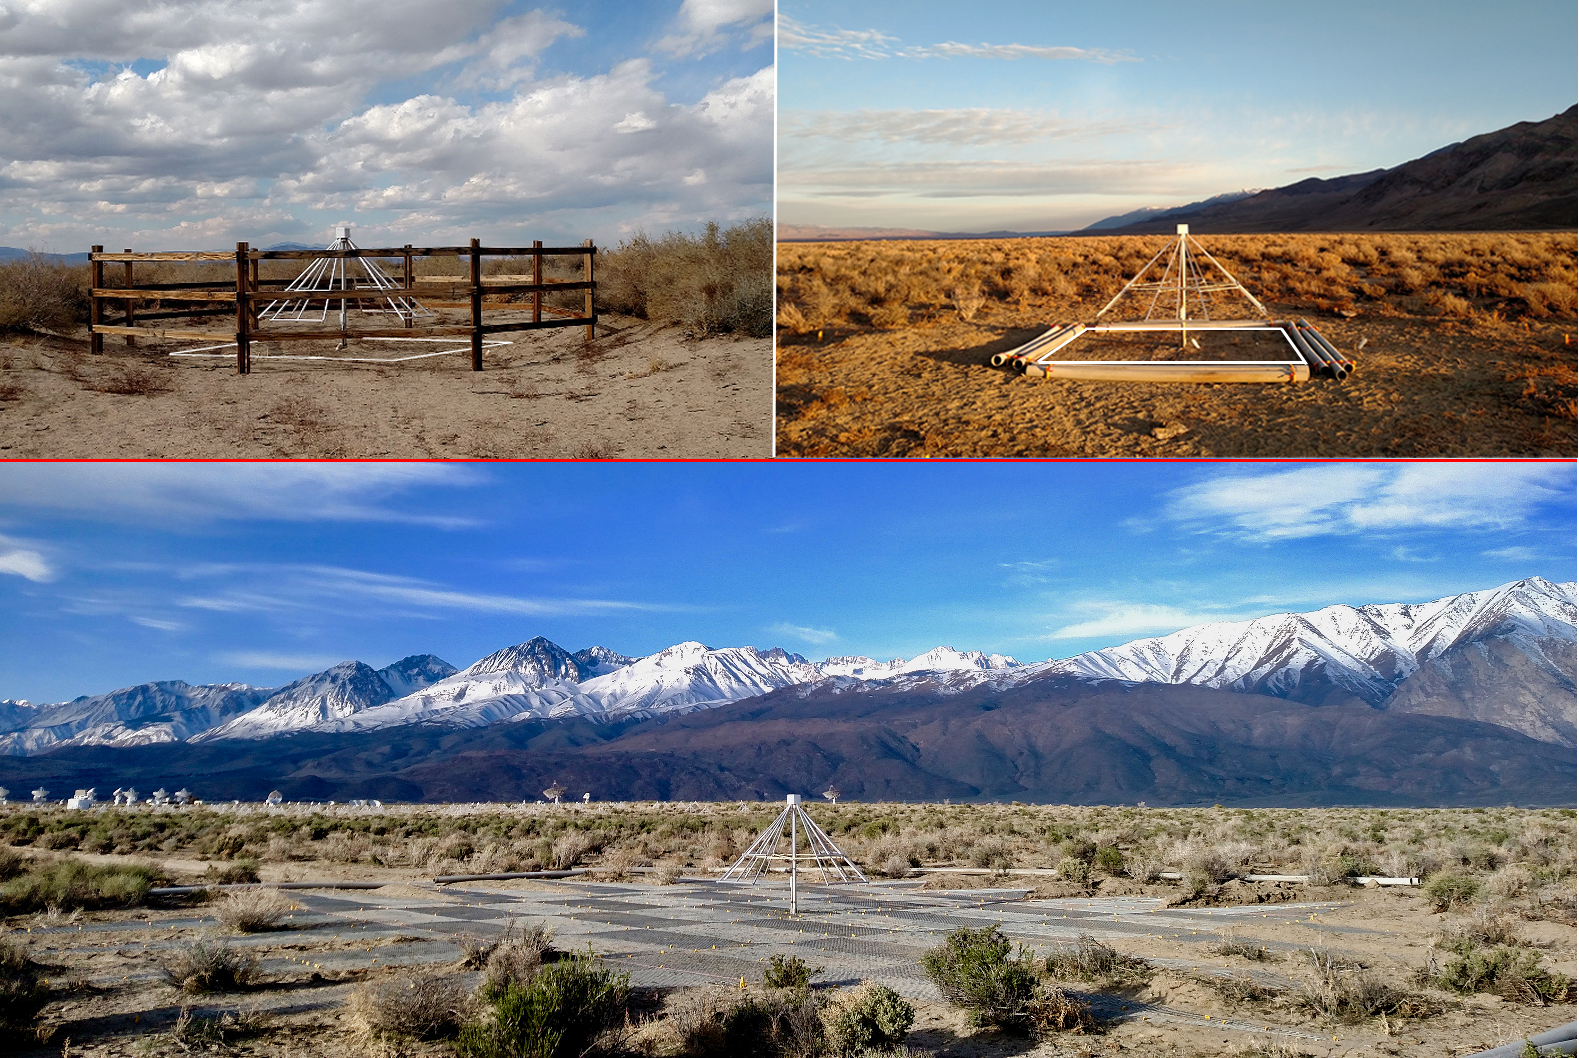
Detailed descriptions of LEDA systems can be found in Kocz et al. (2015) and Price et al. (2018). We summarize here relevant details and describe relevant changes to the system made after data acquisition by Price et al. (2018). LEDA dual polarization radiometric receivers were installed in place of LWA receivers on a subset of antennas within the OVRO-LWA ( N, W). These "LEDA antennas" lie in an arc and are m away from others ( at 75 MHz), so as to limit mutual coupling effects to in antenna impedance. The array layout is shown in Figure 1. Each dual-polarization antenna comprises two pairs of triangular dipole arms 1.50 m long, angled downward by . Antenna terminals contact the receiver cm above and cm closer to antenna axis. The receiver occupies a two sided cm circuit board. A separate daughter board carries those voltage regulators that dissipate far and away the most heat (Price et al., 2018). All components above the dipole arms fit within an uninsulated PVC cubic cover affording 14 cm 14 cm 11.4 cm of space for hardware. The orientation of the east-west dipole axis defines polarization A, and the other polarization B. In this analysis we report on results using polarization A from antennas 252 and 254.
The ground within 3-4 m of each antenna was devoid of vegetation and flatter than that for other LEDA antennas (i.e., undulations cm). Ground screens at each antenna ensured the gain pattern is zenith directed with nulls at the horizon.
Antenna 254 was equipped with a 3 m 3 m ground screen, comprising 12.5 mm gauge welded galvanized wire with a cm spacing. This was the default for the OVRO LWA station (Paravastu et al., 2007; Schmitt et al., 2009). Through the end of January 2019, the same applied to antenna 252. Afterward, the small screen was replaced by a 20 m 20 m ground screen, comprised of 11 mm gauge mesh arranged in a 10 m square with serrations created by four 5 m-long isosceles triangles on each side. This rework also enabled manual leveling of the ground around antenna 252 to achieve peak-to-peak variation of cm. Serrations on the east and west edges were completed on early February, and on the north and south edges on early April (see Figure 2). In general, serrations are used in antenna design to attenuate the otherwise reinforcing effects of reflections due to the impedance mismatch between the ground and the screen along rectangular edges (e.g., Bowman et al., 2018).
New receiver filters were also installed in order to extend the useful band up to 87.5 MHz.
Observations span a total of 137 days, with 120 days distributed from December 2018 to May 2019, and 17 days in May 2018 as a further control sample for data stability with time.
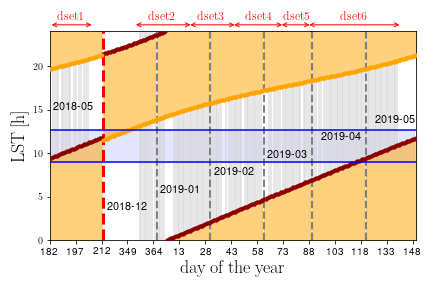
In Figure 3 we report, for illustrative purposes, the distribution of the 137 days across the year, together with the evolution with LST of sunrise and sunset. Note that the primary LEDA observational window is during night-time hours. The Sun is a potential source of interference, especially during flare events, and RFI environment is known to be more quite at night. Moreover, air traffic and human activity on site is prevalent during daylight hours.
Data were collected with a 24 kHz frequency resolution, over the MHz range, and radio frequency interference was excised with an iterative thresholding method (Offringa et al., 2010; Price et al., 2018). They were calibrated via a three-position switch, which loops between the sky, a cold and a hot load every 5 s, for an actual 30% time duty cycle on the sky. A typical ambient temperature variation may induce up to a 0.2% power change at the receiver output. Spectra were further corrected for reflection coefficients measured in the lab (Price et al., 2018).
As we will discuss further in Section 4, the Galactic plane contributes significantly to the overall system temperature of zenith-directed low-frequency radiometers, so, for aiming at a detection of the cm signal, it is better to observe when the brightest portions of the plane are low in the sky. We report in Figure 3 the preferred LST range for our analysis, which combines low Galactic plane contribution and night hours across all the observing period.
The consistency of low-frequency radiometer performance depends in part on the environment, the effect of variable soil moisture on complex permittivity being prominent. Seasonal dry conditions in 2018 carrying over from summer persisted into the first half of January 2019. Consequently, we anticipate data acquired in December 2018 and January 2019 to be the best. This constitutes our reference dataset. Unusually heavy winter rains thereafter posed challenges to be addressed in later sections. For the purposes of a more complete analysis of the foreground spectral index, we extend the analysis of December/January data to nearly 24 h (i.e., including sidereal times when bright Galactic emission is high in the sky).
The inclusion of daytime data allow us to consistently analyze a longer LST range with optimal dry soil conditions. Daytime spectra do not show noticeable spectral variations that can be attributed to solar activity. We estimate the contribution of the quiet sun at transit in December/January using the solar model from Benz (2009) and find it to be rather smooth in frequency, with a maximum value of K at MHz - i.e. a contribution to the total sky temperature. According to the Learmonth Solar Radio Spectrograph444https://www.sws.bom.gov.au/ monitoring the Sun was essentially quiet during our campaign.
2.1 Statistics of data integration and noise levels
At frequencies below MHz, where the wavelength is twice the size of the default m ground screen configuration, spectra change noticeably over time scales of a few days, likely due to the instrument sensitivity to environmental effects. We therefore discarded data below 50 MHz, retaining 1540 of the original 2400 channels.
For a single frequency channel, the measured temperature varies over time and includes random Gaussian noise, . Assuming the noise in each channel to be distributed as a Gaussian with mean and standard deviation , it is possible to estimate the noise variance by removing . We de-trend the signal using a mean filter with a sliding-window of minute width (16 data points) to this aim. This procedure does not inject correlation into the data, but the uncertainties will be partially correlated over the 4 minute interval. Once is removed, we verify that the extracted noise is Gaussian distributed and estimate the variance of the distribution. In the range of frequencies we are interested in for our analysis, the values per channel are around tens of Kelvin.
We averaged the signal over 1 MHz-wide channels, using the variance computed in each channel as a weight. The typical noise in a 1 MHz channel is a few Kelvin at 75 MHz for a 5 s integration time. These 1 MHz spectra are the ones used in our analysis.
2.2 Stability and consistence
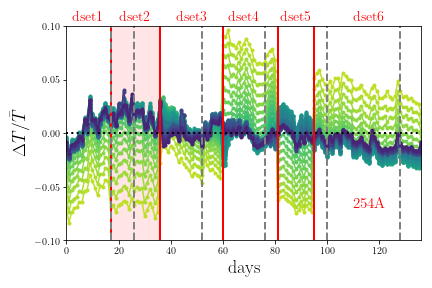
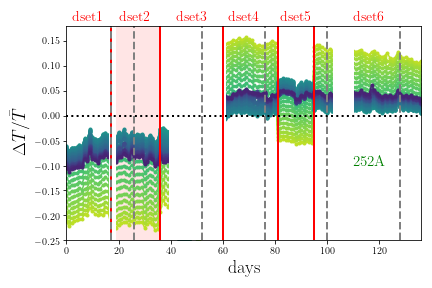
The observed temperature varies as a function of LST as the foreground sky changes as observed by a fixed antenna, however, it is ideally the same if measured at the same LST over different days. Figure 4 shows how the observed temperature varies over the course of our observations. For each frequency channel, we plot the relative variation of the observed temperature, calculated against the time average over N days:
| (1) |
Temporal variations are frequency-dependent in both antennas, with larger effects at low frequencies. We mark them in the Figure with red vertical lines and define in this way six different datasets, where temperature remains fairly constant with time. Despite a less sharp change of trend, we kept the data of May 2018 separated from the ones of December 2018. We recall that the December/January data are our reference dataset due to the seasonal optimal conditions for humidity and rainfall. The time discontinuities appear more evident in antenna 252A although contained at few level, reaching only at the lowest frequencies ( MHz). In this example we consider 1 h integration time around LST h as a representative trend visible at other LST values too.
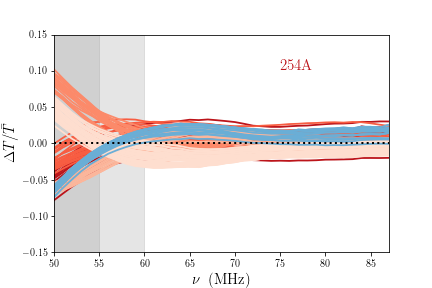
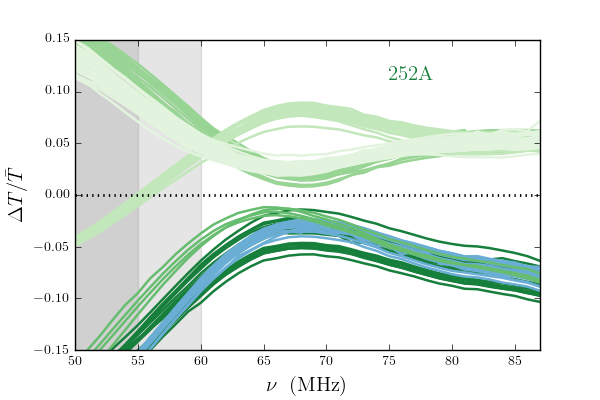
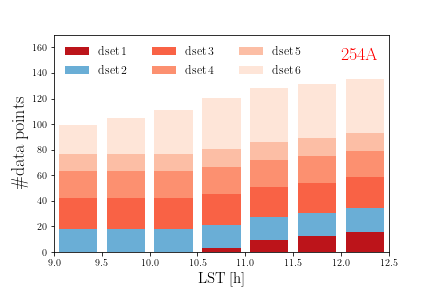
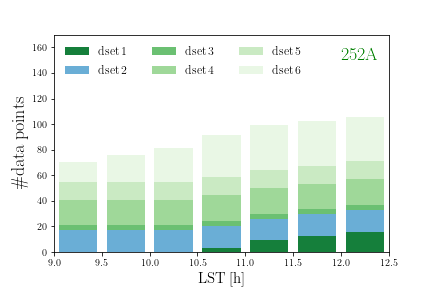
We then study the variation over time of the spectra measured by the two antennas. We show in Figure 5 the relative difference with respect to the mean value , computed by averaging all measured spectra. We plot the six datasets defined above with different colors. The 254A data show good stability; for frequencies higher than 60 MHz, within-datasets and between-datasets differences are at most and do not evolve much with frequency. Below 60 MHz, the different trends highlighted in Figure 4 are again clearly visible, leading to differences up to 10. Antenna 252A has good consistency within each dataset, while differences across datasets can be as high as 30. These latter are due both to temporal offsets as well as low frequency variations, visible in Figure 4 also. Differences are smaller at higher frequencies. We note that antenna 252A has a particularly marked discontinuity between January and February, corresponding to maintenance activities. Further details on the amount of measurements available per LST slots in our analysis can be found in Appendix A.
3 Beam Chromaticity
The spectral smoothness of the foreground emission is the key property that should allow the retrieval of the cm signal. Regardless of the parametrization used for the foregrounds, a frequency-dependent response of the antenna could corrupt their intrinsic spectra and thus prevent the extraction of the global signal (e.g. Bernardi et al., 2015; Mozdzen et al., 2016; Tauscher et al., 2020; Anstey et al., 2020). This beam chromaticity effect, however, can be (at least) partially compensated for by assuming an antenna beam and a foreground model (e.g. Mozdzen et al., 2017, 2019).
3.1 Beam model
We use the NEC-4 package555https://ipo.llnl.gov/technologies/software/nec-v50-numerical-electromagnetic-code that employs a method of moments to simulate an isolated dipole with a 3 m 3 m mesh ground screen, a load seen by the antenna at its interface with the receiver and a constant soil conductivity of 0.001 S m-1. The conductivity value is somewhat more representative of the December/January drier period.
Simulations were used to constrain an analytical beam model (Dowell, 2011; Ellingson et al., 2013; Bernardi et al., 2015):
where , and are the two orthogonal polarizations of the dipole and
| (2) |
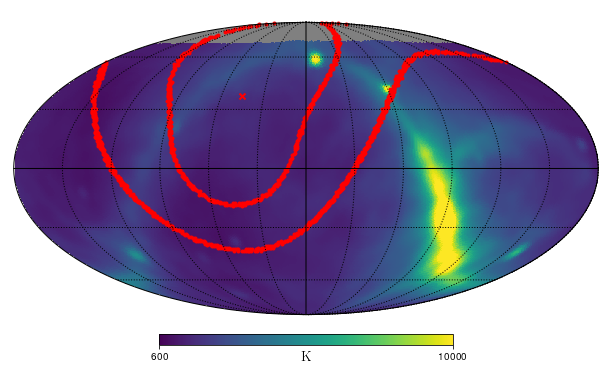
with . The value of the coefficients are fitted with an 11-th order polynomial. A projection of the resulting beam in celestial coordinates can be found in Figure 6.
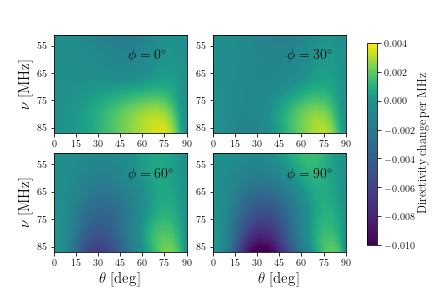
In order to show the shape of the beam and its frequency structure we report in Figure 7 the beam derivative with respect to frequency versus zenith angle , for different values of the azimut angle , as in Mozdzen et al. (2016). The absolute value of the derivative increases with frequency as expected from increased chromaticity and the more complex antenna pattern in the direction perpendicular to the main axis. Nevertheless, the pattern does not show rapid variations, ensuring beam smoothness.
3.2 Foreground model
We first consider the Haslam MHz sky map (Haslam et al., 1982) to model foregrounds and scale it to any frequency with a constant spectral index across the entire sky, after subtracting the CMB temperature ( K):
| (3) |
A second foreground model is derived from the MHz Guzman sky map (Guzmán et al., 2011). As this map misses data at declination , we inpaint this empty region using . We call the resulting map . We can compute from the Haslam and (inpainted) Guzman maps a more accurate "wide-band" spectral index :
| (4) |
The final sky model is constructed similarly to equation 3666After this work was already submitted, Monsalve et al. (2020) published a correction for the zero-level of the Guzman map of K, with an uncertainty of K (at confidence level). This correction will be taken into account in future work.:
| (5) |
3.3 Beam chromaticity correction
The beam chromaticity correction can be computed as:
| (6) |
Note that is a function of LST since the sky drifts with time over the antenna. We choose MHz for the reference frequency in order to compare our results with Mozdzen et al. (2019). Note that this is a reasonable choice for us regardless, since it is a quite central frequency for the range of our data. We compute the beam chromaticity using our beam model (Section 3.1) and both the sky model of equation 3 and equation 5. We find very similar results, differing almost everywhere by less than a few tenths of a percent. The disagreement is slightly more pronounced closer to the Galactic center direction, but never higher than 1%. To test the impact of limitations in our beam model, we instead perturb the coefficients of the beam directivity (see equation 2) by drawing values from a Gaussian distribution with standard deviation corresponding to , and of the original parameter value (similar to what was done in Bernardi et al., 2015). We construct 100 beam models by varying simultaneously all four parameters for each value and compute the chromaticity corrections. We find variations always smaller than 1% even in the worst case scenario of . We anticipate here that they translate in an error on the spectral index estimation that is smaller than the typical error bar due to the variability of our spectra.
In Figure 8 we present results using our reference beam model and the Haslam sky model to show consistency with Figure 3 of Mozdzen et al. (2019).
For our final analysis we compute the chromaticity correction using and for each LST and frequency we use to correct our spectra:
| (7) |

4 Absolute temperature scale
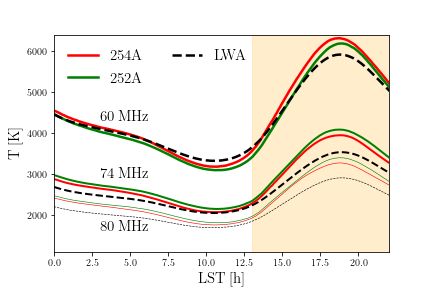
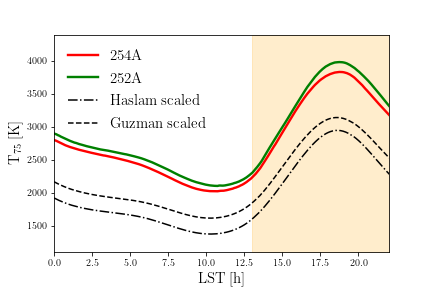
We investigate the behavior of the chromaticity corrected spectra as a function of LST, over the 24 hour range (Figure 9, 10). We focus on the reference dataset defined in Section 2 and Figure 4777As discussed in Appendix A, when extended to the 24 hour range, few days of the reference dataset have been discarded.. The measured sky temperature is consistent for the two antennas: it has a minimum in the LST range h and reaches its peak around LST h, when the Galactic center is closer to the visible sky.
We compare our results against existing foreground models and measurements by evaluating a simulated antenna temperature:
| (8) |
where are, alternatively LWA1 Low Frequency Sky Survey results (Dowell et al., 2017), the Haslam sky model, (equation 3), or the Guzman sky model, (equation 5). Note that we use the beam pattern at the reference frequency MHz in order to avoid the introduction of chromaticity effects.
Dowell et al. (2017) have corrected their LWA interferometric observations with the sky-averaged temperature measured in December 2014 by the LEDA prototype system, LEDA-64 New Mexico deployment (Taylor et al., 2012; Schinzel et al., 2018). In Figure 9, we report the 60, 74 and 80 MHz frequencies and compare with our chromaticity corrected measurements of the sky temperature obtained with antenna 254A and antenna 252A. Their trend with LST is very similar and absolute values are consistent within %.
In Figure 10 we compare our measured temperature at 75 MHz for both antennas against the simulated temperature (equation 8), where we use either the Haslam sky model or the Guzman sky model . Predictions and our measurements have a comparable behavior with LST, however, they are discrepant in the absolute temperature scale. Although future analysis will be dedicated to investigating the precision of the absolute calibration, in this work we correct our absolute temperature scale to match the extrapolation from the 45 MHz map. We make the conservative choice of evaluating at LST h, where both the sky temperature and the offset have a minimum. Moreover, the LST h bin is the only one covered across the whole observing campaign and, therefore, the most appropriate choice for the correction.
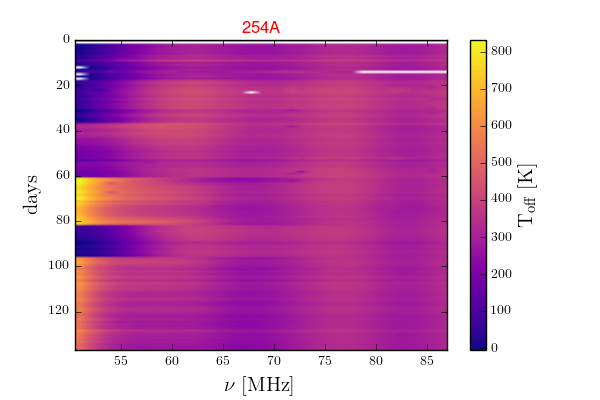
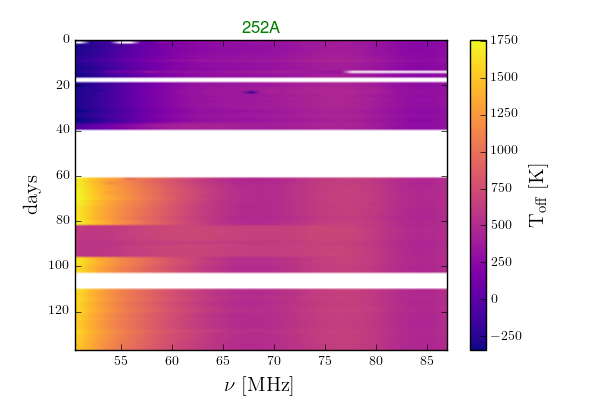
Figure 11 shows , i.e the difference between all our spectra (corrected for the chromaticity factor) and at LST h:
| (9) |
The offset is relatively constant with frequency and observing day. The strongest differences at low frequencies highlight the different datasets defined in Figure 4. An oscillatory pattern in with a period of approximately 20 MHz, common to both antennas, and visible across all the observations, can be tentatively inferred from Figure 11, indicating a possible systematic effect still present in the data.
Offset values for antenna 254A closely follow a Gaussian distribution for each dataset, and the standard deviation becomes smaller if we restrict the range to MHz.
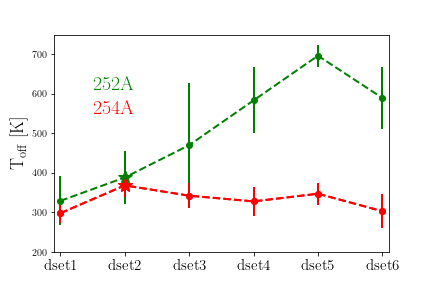
The offset values for antenna 252A span a larger range, as can be seen also in Figure 11, and their distribution deviates more significantly from a Gaussian profile. We retain for both antennas only in the MHz range and we fit the various distributions with a Gaussian profile to obtain a mean and standard deviation value for each dataset. The best-fit mean and standard deviation are reported in Figure 12 for both antennas. The results for antenna 254A are quite stable along the duration of the observations while 252A shows a change of trend, consistently with what has been seen already in Figure 4 and 5. We correct our spectra by subtracting the mean value for each dataset.
5 Spectral Index Results
We now analyze our observations to characterize the spectral index of the foreground emission. We focus on our reference dataset in Section 5.1. We recall that for this dataset the observing conditions are optimal in terms of soil and rainfall. We study the spectral index averaging the spectra (measured in 14 selected days) in LST bins of 5 minutes and across an LST range of h. We concentrate instead on the h LST range, that corresponds to the minimum of foreground contamination, when studying the all six datasets in Section 5.2. Note that this LST range is the central interval of interest for further studies aimed at extracting a global signal constraint/upper limit. We model the data with a simple power law. Following Mozdzen et al. (2019) we write
| (10) |
choosing MHz as a reference frequency. We perform a non-linear least squares minimization to constrain the model parameters for each LST bin, using
| (11) |
where is the total number of MHz frequency bins, and the errors correspond to the noise variance estimates discussed in Section 2.1. We recall that varies across datasets (Figure 12). In appendix B, we analyze the effect on the fit of the dispersion around this mean.
5.1 Reference dataset results
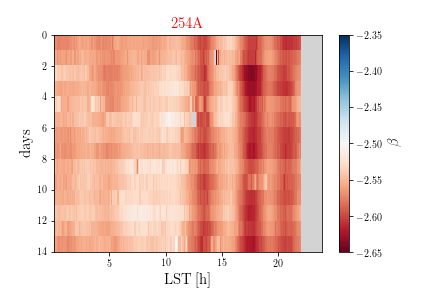
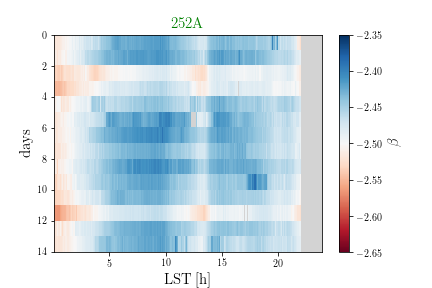
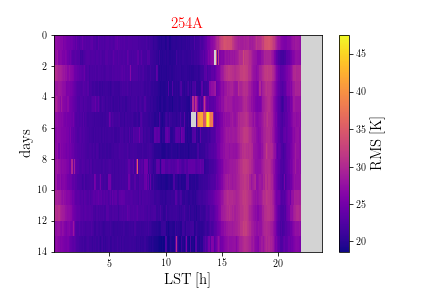
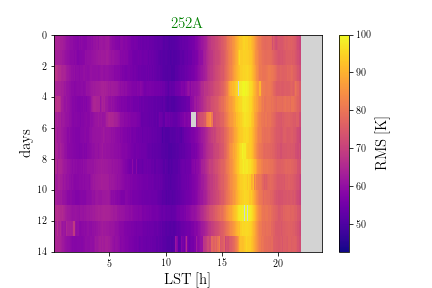
Figure 13 shows the best fit values of the spectral index as a function of LST and observing day.
Only data above MHz were used in the fit. We refer to appendix B for a discussion on the stability of the results with respect to this choice. We compute the RMS of the residuals for each LST bin and for each day, and report their values in the lower panels of Figure 13. We check for outliers in both and RMS, and mask the corresponding spectra after a visual check. This procedure discards only few spectra.
Results are consistent across the observing window, highlighting the good stability of the instrument. The value of the spectral index steepens around LST h for both antennas. The smallest RMS values (around 20 K) occur in the h LST range, motivating further the choice of this interval for further cosmological analysis. Similar trends are found for antenna 252A, although the RMS values are overall higher, reaching almost 100 K when the Galactic center is in the sky. Note that antenna 254A shows persistent variations at large LST values, in correspondence with high RMS values (around 30 K).
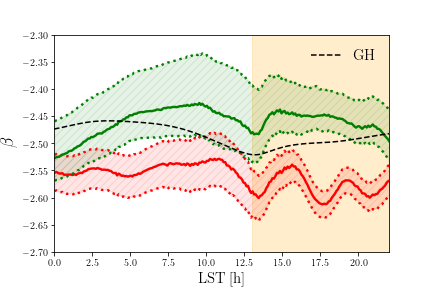
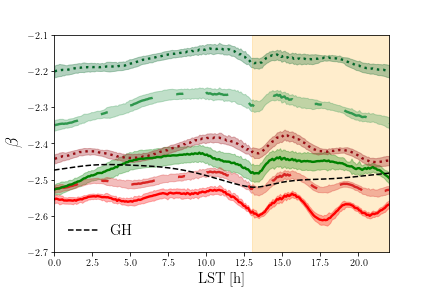
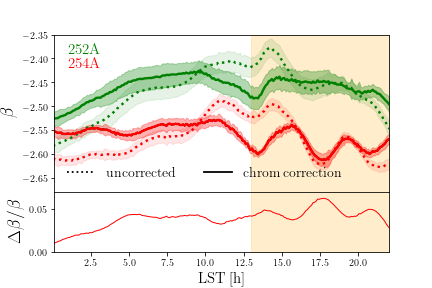
We show in the upper panel of Figure 14 the value of the mean spectral index as a function of LST and its variance across the different days of the dataset. The two antennas show similar trends although their results are slightly offset, with antenna 252A pointing toward a flatter , as visible also from the upper panels of Figure 13. The mean spectral index shows almost no dependence on LST in the range h for antenna 254A and in the range h for antenna 252A. It then becomes steeper for both antennas around LST h. Antenna 252A shows an almost constant spectral index for LST h, while we can recognize the more complex pattern discusthat sed above for antenna 254A. The bottom part of the Figure shows that the relative variation between the two antennas that is always lower than 6%. We report in Table 1 the mean value of the spectral index and its standard deviation averaged in LST bins of h. We also report the results obtained without the beam factor correction, to assess its impact. The spectral index in this case is found to flatten when the sky temperature is minimal, in agreement with the results in Price et al. (2018), for which the beam chromaticity was not taken into account. The effect of the correction is stronger below LST h and around LST h.
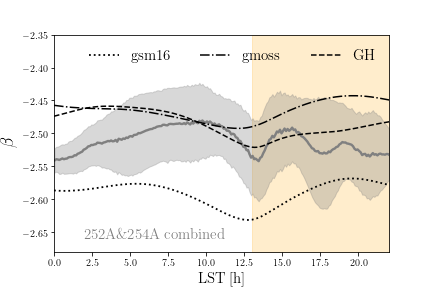
The quoted spectral index scatter in Table 1 and upper panel of Figure 14 is derived directly from the standard deviation of the single antenna measured spectra. The data scatter alone is not enough to reconcile the discrepancy between antenna 254A and 252A, possibly due the presence of a (yet) unknown systematic effect. To take this into account we consider together the data from the two antennas. The combined result is shown in the lower panel of Figure 14. Measurements from the two separate antennas have similar trends in LST, implying that the previous considerations remain valid for the combined results. The mean spectral index , combining the steeper results from antenna 254A and the flatter results from antenna 252A, varies between and . The uncertainty, now computed the from the standard deviation of all the spectra, has a magnitude of across the full LST range, reaching when the Galactic center is above the horizon. We compare this result with existing measurements and simulations. Following Mozdzen et al. (2019), we first compute a spectral index from the comparison of the Haslam and the Guzman maps:
| (12) |
where is the portion of the sky model seen though the beam as the sky drifts, and thus is a function of LST. Moreover, we consider both the improved version of the GSM (Zheng et al., 2016) and the GMOSS (Sathyanarayana Rao et al., 2017) to create a set of full sky maps in the MHz range, with 1 MHz spacing. We then simulate an observation with our antenna beam and consider LST values 10 minutes apart. We construct with this procedure a mock spectrum for every LST value. Note that we consider the beam shape at the reference frequency of MHz to avoid introducing chromaticity effects. We then perform a non-linear least squares minimization to constrain the model parameters of equation 10 for each LST bin, and report the best-fit spectral index in Figure 14.
The overall variation with LST of these models and of is in good agreement with the one found in our data. Note for example the steeper spectral index around LST h. It is worth noticing that the best-fit values for the scaling temperature are well in agreement with their observed ones, once corrected for the offset. This assures that the best-fit solution is not falling in un-physical minima.
| 254 A | 252 A | |||||
|---|---|---|---|---|---|---|
| LST (h) | RMS (K) | RMS (K) | ||||
| 0-3 | -2.55 | 0.01 | 25.08 | -2.51 | 0.02 | 112.37 |
| 3-6 | -2.55 | 0.01 | 21.99 | -2.46 | 0.02 | 94.14 |
| 6-9 | -2.54 | 0.01 | 21.90 | -2.43 | 0.02 | 82.58 |
| 9-12 | -2.54 | 0.01 | 20.70 | -2.44 | 0.02 | 79.05 |
| 12-15 | -2.58 | 0.01 | 23.31 | -2.46 | 0.02 | 93.77 |
| 15-18 | -2.57 | 0.01 | 29.33 | -2.45 | 0.02 | 135.40 |
| 18-21 | -2.58 | 0.01 | 26.96 | -2.46 | 0.02 | 153.21 |
5.2 All dataset results
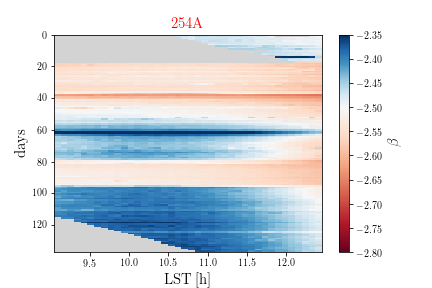
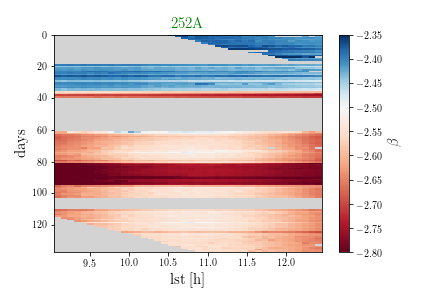
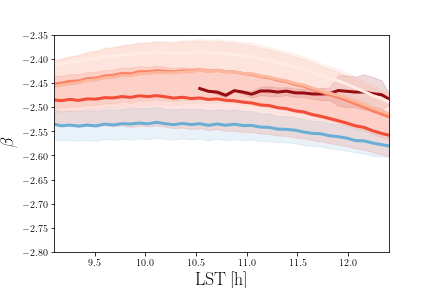
We now analyze the value of the spectra index for the spectra in the 6 datasets defined in Section 2, following the same procedure of Section 5.1. Although the data show a coherent behavior on a time scale of few tens of days, there are changes throughout the months that reflect in different values for each dataset. Slight variations across datasets are thus expected for the best-fit values of the spectral index.
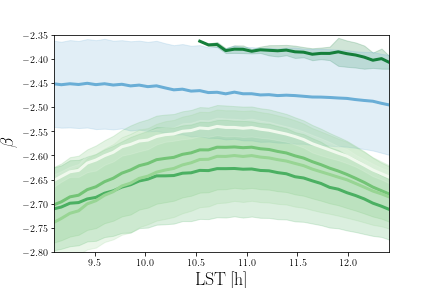
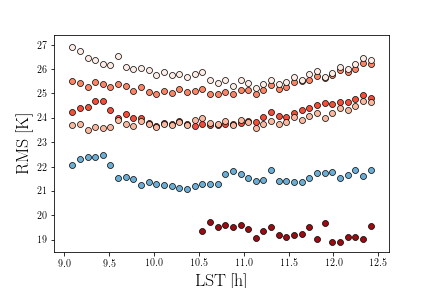
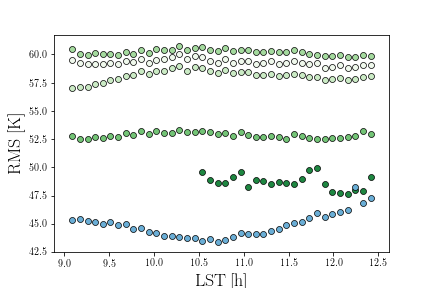
We report these values of as a function of LST and observing day in Figure 15, and in Table 2 the mean and standard deviation for each dataset. We also report the averaged RMS values of the residuals. Note that, in the restricted LST range h, we can enlarge the reference dataset with more spectra that we are otherwise obliged to discard when requiring high quality over the full h range. For this reason dset2 has larger error bars than the one presented in Section 5.1.
We report in Figure 16 the mean and standard deviation obtained from Figure 15 for each dataset, as a function of LST. There is good consistency across datasets and we find similar variation as a function of LST, in particular for antenna 254A. We also report in the lower panels the variation of the RMS of the residuals. The RMS values are always lower for antenna 254A than for antenna 252A, as found for the case of the reference dataset. We do not report the best-fit value of but we remark its agreement with the (offset corrected) measured value of the sky temperature at 75 MHz.
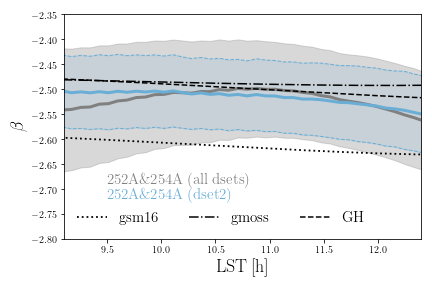
Similarly to what done in Section 5.1, we show in Figure 17 the combined spectral index and its standard deviation considering both antennas and all datasets. The mean value of varies from a minimum of at LST h to a steeper at LST h. The combined error bar spans the range. We compare the result with existing measurements and simulations.
| 254 A | 252 A | |||||
|---|---|---|---|---|---|---|
| dataset | RMS (K) | RMS (K) | ||||
| 1 | -2.47 | 0.01 | 19.32 | -2.39 | 0.01 | 48.72 |
| 2 (ref) | -2.54 | 0.03 | 21.60 | -2.47 | 0.10 | 44.88 |
| 3 | -2.50 | 0.06 | 24.15 | -2.66 | 0.09 | 52.86 |
| 4 | -2.44 | 0.06 | 25.35 | -2.63 | 0.08 | 60.20 |
| 5 | -2.45 | 0.06 | 23.90 | -2.65 | 0.09 | 58.11 |
| 6 | -2.41 | 0.02 | 25.88 | -2.58 | 0.02 | 59.30 |
6 Discussion and conclusions
We presented the analysis of LEDA radiometric data with the aim of measuring the spectral index of Galactic radio emission in the MHz range. Observations were carried out with two antennas (252A and 254A) and spanned a total of hours divided in six different datasets covering May 2018 and from mid-December 2018 to mid-May 2019.
Observed spectra were corrected for the effect of beam chromaticity following Mozdzen et al. (2017, 2019) and re-scaled to be in agreement with the absolute temperature scale derived from existing observations of Guzmán et al. (2011); Haslam et al. (1982). The beam chromaticity effect leads to spectral index corrections of no more than . We note here that an approach that incorporates beam effects in the foreground model and, therefore, bypasses the chromaticity correction, has recently been discussed in the literature (Tauscher et al., 2020; Anstey et al., 2020), although not applied to observations yet.
Due to optimal soil conditions, we first focused on 14 days of data from December 2018 and early January 2019 (reference dataset). We found that the spectral index is fairly flat across 24 h LST range. It varies from for antenna 254A at LST h to at LST h. A similar behavior is found for antenna 252A, although with a flatter mean spectral index, changing from to . Residual rms values after subtracting the best fit power law vary from K for antenna 254A to K for antenna 252A.
Results from the two antennas show a offset which is larger than their individual uncertainties.
We thus jointly analyze measurements from the two antenna to account for this systematic offset.
The combination of the two antennas leads to values of the spectral index ranging from at LST h to a steeper at LST h, with a typical standard deviation of .
Our results are broadly consistent with previous measurements. Guzmán et al. (2011) derived a spectral index map from 45 MHz and 408 MHz with over most of the sky. Similarly, Mozdzen et al. (2019) found at LSTs from to h in the MHz range, flattening to when the Galactic center is transiting - although their observations cover the southern celestial hemisphere and can, therefore, only be qualitatively compared to ours. Moreover, we find broad agreement with the Improved GSM (Zheng et al., 2016) and GMOSS (Sathyanarayana Rao et al., 2017) sky models.
We analyzed the full six datasets in the h LST range, where the foreground temperature shows a minimum.
The distribution of the best fit spectral indexes for antenna 254A spans values from to , all consistent with the mean . Spectral indexes are in general less stable for antenna 252A, leading to a mean value .
The configuration of antenna 252A was not the same throughout the observing period and a larger scatter is thus expected in its results. Improved antenna simulations, including a more refined modeling for the ground plane and the soil,
are ongoing and will be the subject of a follow up work.
We combined together the six datasets from both antennas and find in the h LST range. The combined mean spectral index value for all our data is in agreement with the result obtained using the reference dataset (dset2) and consistent with existing sky models.
acknowledgements
We thank the anonymous referee for their useful and constructive suggestions. The authors kindly thank the Caltech OVRO staff for the great dedication and skills demonstrated in constructing the LWA array. MS acknowledges funding from the INAF PRIN-SKA 2017 project 1.05.01.88.04 (FORECaST) and support from the INFN INDARK PD51 grant. AF is supported by the Royal Society University Research Fellowship. LEDA research has been supported in part by NSF grants AST/1106059, PHY/0835713, and OIA/1125087. The OVRO-LWA project was enabled by the kind donation of Deborah Castleman and Harold Rosen. This research made use of Numpy (Harris et al., 2020), Astropy (The Astropy Collaboration, 2013) and Scipy (Virtanen et al., 2020). Some of the results in this paper have been derived using the healpy (Zonca et al., 2019) and HEALPix (Górski et al., 2005) package.
Data availability
The data underlying this article will be shared on reasonable request to the corresponding author.
References
- Anstey et al. (2020) Anstey D., de Lera Acedo E., Handley W., 2020, arXiv e-prints, p. arXiv:2010.09644
- Barkana (2018) Barkana R., 2018, Nature, 555, 71
- Barkana & Loeb (2005) Barkana R., Loeb A., 2005, ApJ, 626, 1
- Benz (2009) Benz A. O., 2009, Landolt Börnstein, 4B, 103
- Bernardi et al. (2015) Bernardi G., McQuinn M., Greenhill L. J., 2015, ApJ, 799, 90
- Bernardi et al. (2016) Bernardi G., et al., 2016, Monthly Notices of the Royal Astronomical Society, 461, 2847
- Bevins et al. (2020) Bevins H. T. J., Handley W. J., Fialkov A., de Lera Acedo E., Greenhill L. J., Price D. C., 2020, arXiv e-prints, p. arXiv:2007.14970
- Bowman et al. (2018) Bowman J. D., Rogers A. E. E., Monsalve R. A., Mozdzen T. J., Mahesh N., 2018, Nature, 555
- Cohen et al. (2017) Cohen A., Fialkov A., Barkana R., Lotem M., 2017, MNRAS, 472, 1915
- De Oliveira-Costa et al. (2008) De Oliveira-Costa A., Tegmark M., Gaensler B. M., Jonas J., Landecker T. L., Reich P., 2008, MNRAS, 388, 247
- Dowell (2011) Dowell J., 2011, Parametric Model for the LWA-1 Dipole Response as a Function of Frequency
- Dowell et al. (2017) Dowell J., Taylor G. B., Schinzel F. K., Kassim N. E., Stovall K., 2017, MNRAS, 469, 4537
- Eastwood et al. (2018) Eastwood M. W., et al., 2018, The Astronomical Journal, 156, 32
- Ellingson et al. (2013) Ellingson S. W., Craig J., Dowell J., Taylor G. B., Helmboldt J. F., 2013, arXiv e-prints, p. arXiv:1307.0697
- Fialkov et al. (2013) Fialkov A., Barkana R., Visbal E., Tseliakhovich D., Hirata C. M., 2013, MNRAS, 432, 2909
- Fialkov et al. (2014) Fialkov A., Barkana R., Visbal E., 2014, Nature, 506, 197
- Field (1958) Field G. B., 1958, Proceedings of the IRE, 46, 240
- Furlanetto et al. (2006) Furlanetto S. R., Oh S. P., Briggs F. H., 2006, Phys. Rep., 433, 181
- Górski et al. (2005) Górski K. M., Hivon E., Banday A. J., Wandelt B. D., Hansen F. K., Reinecke M., Bartelmann M., 2005, ApJ, 622, 759
- Guzmán et al. (2011) Guzmán A. E., May J., Alvarez H., Maeda K., 2011, A&A, 525, A138
- Harker et al. (2016) Harker G. J. A., Mirocha J., Burns J. O., Pritchard J. R., 2016, MNRAS, 455, 3829
- Harris et al. (2020) Harris C. R., et al., 2020, Nature, 585, 357–362
- Haslam et al. (1982) Haslam C. G. T., Salter C. J., Stoffel H., Wilson W. E., 1982, A&AS, 47, 1
- Hills et al. (2018) Hills R., Kulkarni G., Meerburg P. D., Puchwein E., 2018, Nature, 564, E32
- Kocz et al. (2015) Kocz J., et al., 2015, Journal of Astronomical Instrumentation, 4, 1550003
- Landecker & Wielebinski (1970) Landecker T. L., Wielebinski R., 1970, Australian Journal of Physics Astrophysical Supplement, 16, 1
- McKinley et al. (2018) McKinley B., et al., 2018, MNRAS, 481, 5034
- Mesinger et al. (2013) Mesinger A., Ferrara A., Spiegel D. S., 2013, MNRAS, 431, 621
- Mesinger et al. (2016) Mesinger A., Greig B., Sobacchi E., 2016, MNRAS, 459, 2342
- Mirocha (2014) Mirocha J., 2014, MNRAS, 443, 1211
- Mirocha & Furlanetto (2019) Mirocha J., Furlanetto S. R., 2019, MNRAS, 483, 1980
- Monsalve et al. (2020) Monsalve R. A., et al., 2020, arXiv e-prints, p. arXiv:2012.11019
- Mozdzen et al. (2016) Mozdzen T. J., Bowman J. D., Monsalve R. A., Rogers A. E. E., 2016, MNRAS, 455, 3890
- Mozdzen et al. (2017) Mozdzen T. J., Bowman J. D., Monsalve R. A., Rogers A. E. E., 2017, MNRAS, 464, 4995
- Mozdzen et al. (2019) Mozdzen T. J., Mahesh N., Monsalve R. A., Rogers A. E. E., Bowman J. D., 2019, MNRAS, 483, 4411
- Offringa et al. (2010) Offringa A. R., de Bruyn A. G., Biehl M., Zaroubi S., Bernardi G., Pandey V. N., 2010, MNRAS, 405, 155
- Paravastu et al. (2007) Paravastu et al. H. R., 2007, Impedance Measurements of the Big Blade andFork Antennas on Ground Screensat the LWDA Site
- Patra et al. (2015) Patra N., Subrahmanyan R., Sethi S., Shankar N. U., Raghunathan A., 2015, The Astrophysical Journal, 801, 138
- Philip et al. (2019) Philip L., et al., 2019, Journal of Astronomical Instrumentation, 8, 1950004
- Price et al. (2018) Price D. C., et al., 2018, MNRAS, 478, 4193
- Pritchard & Furlanetto (2007) Pritchard J. R., Furlanetto S. R., 2007, MNRAS, 376, 1680
- Pritchard & Loeb (2010) Pritchard J., Loeb A., 2010, Nature, 468, 772
- Rogers & Bowman (2008) Rogers A., Bowman J., 2008, Astron. J., 136
- Sathyanarayana Rao et al. (2017) Sathyanarayana Rao M., Subrahmanyan R., Udaya Shankar N., Chluba J., 2017, AJ, 153, 26
- Schinzel et al. (2018) Schinzel F., et al., 2018, A Prototype Lower-VHF Radiometry System at the Long Wavelength Array
- Schmitt et al. (2009) Schmitt et al. 2009, Collected LWA Engineering Memos from the Development of the Ground Screen Subsystem
- Shaver et al. (1999) Shaver P. A., Windhorst R. A., Madau P., de Bruyn A. G., 1999, A&A, 345, 380
- Sims & Pober (2020) Sims P. H., Pober J. C., 2020, MNRAS, 492, 22
- Singh & Subrahmanyan (2019) Singh S., Subrahmanyan R., 2019, The Astrophysical Journal, 880, 26
- Singh et al. (2017) Singh S., et al., 2017, ApJ, 845, L12
- Singh et al. (2018) Singh S., Subrahmanyan R., Shankar N. U., Rao M. S., Girish B. S., Raghunathan A., Somashekar R., Srivani K. S., 2018, Experimental Astronomy, 45, 269
- Sokolowski et al. (2015) Sokolowski M., et al., 2015, Publications of the Astronomical Society of Australia, 32, e004
- Spinelli et al. (2019) Spinelli M., Bernardi G., Santos M. G., 2019, MNRAS, 489, 4007
- Tauscher et al. (2020) Tauscher K., Rapetti D., Burns J. O., 2020, ApJ, 897, 132
- Taylor et al. (2012) Taylor G. B., et al., 2012, Journal of Astronomical Instrumentation, 01, 1250004
- The Astropy Collaboration (2013) The Astropy Collaboration 2013, A&A, 558, A33
- Venkatesan et al. (2001) Venkatesan A., Giroux M. L., Shull J. M., 2001, ApJ, 563, 1
- Virtanen et al. (2020) Virtanen P., et al., 2020, Nature Methods, 17, 261
- Voytek et al. (2014) Voytek T. C., Natarajan A., Jáuregui García J. M., Peterson J. B., López-Cruz O., 2014, ApJ, 782, L9
- Wouthuysen (1952) Wouthuysen S. A., 1952, AJ, 57, 31
- Zheng et al. (2016) Zheng H., et al., 2016, Monthly Notices of the Royal Astronomical Society, 464, 3486
- Zonca et al. (2019) Zonca A., Singer L., Lenz D., Reinecke M., Rosset C., Hivon E., Gorski K., 2019, Journal of Open Source Software, 4, 1298
Appendix A Observation details
We detail in this appendix the total amount of hours available for our analysis. We recall that the observing season spanned from December 2018 to May 2019. Data from May 2018 were also included. The final dataset consists of 137 days of usable data. For each day, not all LST are considered. We mainly focus on the range as depicted in Figure 3. We expand for 14 selected days in December/January the LST range to an almost 24 h LST range. We report the total amount of hours in Table 3 dividing the LST range according to this.
As discussed in Section 2, the 137 days are split in 6 different datasets. We detail the number of observing days for each of them in Table 4 and the total amount of data available per LST slot in Figure 18. Note that the reference dataset contains only a subset of the spectra of dset2, as few spectra were discarded in the analysis of the larger LST range.
| LST (h) | 254A (hours of data) | 252A (hours of data) |
|---|---|---|
| 0h-9h | 126 | 126 |
| 9h-12h | 411 | 321 |
| 12h-24h | 140 | 140 |
| Total | 677 | 587 |
| dset | month(s) | 254A: days | 252A: days |
|---|---|---|---|
| 1 | May2018 | 17 | 17 |
| 2 (ref) | Dec2018/Jan2019 | 19 (14) | 17 (14) |
| 3 | Jan/Feb2019 | 24 | 12 |
| 4 | Feb/Mar2019 | 21 | 20 |
| 5 | Mar2019 | 14 | 14 |
| 6 | Mar/Apr/May2019 | 42 | 35 |
Appendix B Stability of the results on the spectral index
We perform some further tests to assess the stability of our measured spectral indices. We concentrate on the results of Section 5.1 which are the central ones of this work.
First we investigate the dependence of our findings with respect to the offset discussed in Section 4 and reported in Figure 12. There is an expected correlation between the offset and the steepness of : the larger the offset that is removed, the more we should obtain a steep , since the subtraction is more effective at high frequencies, where the sky temperature is lower. We report results obtained considering the 1 deviation from the mean in Figure 19. The result for every intermediate value falls in between these solutions for both antenna 254A and 252A. The reported variations shows a consistent trend with LST and deviations of no more than a few % for the overall value of the spectral index.
Our results for the spectral index have been obtained considering a minimum frequency cut at MHz for our spectra. This choice, already discussed in Section 2, minimizes the environmental effects in the data. We report in Figure 20 the best fit of the spectral index for the reference dataset obtained by lowering to or MHz, for completeness. We find a flattening of the spectral index, expected when including these lower frequencies (e.g. De Oliveira-Costa et al., 2008) The effect is particularly strong for antenna 252A, reaching . Note however that the trend in LST is consistent for all frequency cuts. The results for antenna 254A are more stable, as also expected from Figure 5.
